|
|
市場調査レポート
商品コード
1119783
世界と米国のホスフィンガス市場:分析・予測 (2022年~2028年)Global and United States Phosphine Gas Market Report & Forecast 2022-2028 |
||||||
|
|
|||||||
|
● お客様のご希望に応じて、既存データの加工や未掲載情報(例:国別セグメント)の追加などの対応が可能です。 詳細はお問い合わせください。 |
|||||||


| 世界と米国のホスフィンガス市場:分析・予測 (2022年~2028年) |
|
出版日: 2022年08月26日
発行: QYResearch
ページ情報: 英文 98 Pages
納期: 2~3営業日
|
- 全表示
- 概要
- 図表
- 目次
COVID-19の大流行により、世界のホスフィンガスの市場規模は2022年に7,390万米ドルの価値があると推定され、レビュー期間中に6.91%のCAGRで成長し、2028年までに1億1,032万米ドルの再調整されたサイズになると予測されています。
この健康危機による経済変化を十分に考慮し、種類別では、2021年に世界市場の87.45%を占める6Nグレードが2028年までに1億61万米ドルの価値を持ち、COVID-19後の期間に7.53%のCAGRで成長すると予測されます。用途別では、半導体産業が主要セグメントで、2021年には89.52%以上の市場シェアを占め、この予測期間を通して7.30%のCAGRに変化しています。
米国では、ホスフィンガス市場規模は2021年の698万米ドルから2028年には946万米ドルに成長し、予測期間中のCAGRは4.89%と予測されています。
目次
第1章 調査範囲
- ホスフィンガス:製品概略
- 世界のホスフィンガス市場の見通し (2017年・2022年・2028年)
- 販売額 (単位:100万米ドル、2017年~2028年)
- 販売量 (2017年~2028年)
- 米国のホスフィンガス市場の見通し (2017年・2022年・2028年)
- 販売額 (単位:100万米ドル、2017年~2028年)
- 販売量 (2017年~2028年)
- ホスフィンガスの市場規模:米国・世界 (2017年・2022年・2028年)
- 米国の市場規模:対世界シェア (2017年・2022年・2028年)
- 市場成長率:米国 vs 世界 (2017年・2022年・2028年)
- ホスフィンガスの市場力学
- ホスフィンガス業界の動向
- ホスフィンガス市場の促進要因
- ホスフィンガス市場の課題
- ホスフィンガス市場の抑制要因
- 分析対象
- 分析期間
第2章 ホスフィンガス市場:種類別
- 種類別の市場セグメント
- 4N
- 5N
- 6N
- 世界のホスフィンガスの市場規模:種類別
- 販売額:種類別 (2017年・2022年・2028年)
- 販売量:種類別 (2017年・2022年・2028年)
- 平均販売価格 (ASP):種類別 (2017年・2022年・2028年)
- 米国のホスフィンガスの市場規模:種類別
- 販売額:種類別 (2017年・2022年・2028年)
- 販売量:種類別 (2017年・2022年・2028年)
- 平均販売価格 (ASP):種類別 (2017年・2022年・2028年)
第3章 ホスフィンガス市場:用途別
- 用途別の市場セグメント
- 半導体産業
- 太陽電池産業
- 世界のホスフィンガスの市場規模:用途別
- 販売額:用途別 (2017年・2022年・2028年)
- 販売量:用途別 (2017年・2022年・2028年)
- 平均販売価格 (ASP):用途別 (2017年・2022年・2028年)
- 米国のホスフィンガスの市場規模:用途別
第4章 世界のホスフィンガス市場:企業別の競合情勢
- 世界のホスフィンガスの市場規模:企業別
- 主要メーカー:収益ランキング(2021年)
- 世界のホスフィンガスの収益:メーカー別(2017年~2022年)
- 世界のホスフィンガスの販売:メーカー別(2017年~2022年)
- 世界のホスフィンガスの価格:メーカー別(2017年~2022年)
- 世界のホスフィンガス市場の集中度(CR)
- 世界のホスフィンガス企業の製造拠点・製品種類
- メーカーの企業合併・買収 (M&A)、拡張計画
- 米国のホスフィンガスの市場規模:企業別
第5章 世界のホスフィンガスの市場規模:地域別
- 世界のホスフィンガス市場規模:地域別 (2017年・2022年・2028年)
- 世界のホスフィンガス市場規模:地域別(数量、2017年~2028年)
- 世界のホスフィンガス市場規模:地域別(金額、2017年~2028年)
第6章 地域レベル・国レベルのセグメント
- 北米
- 米国
- カナダ
- メキシコ
- アジア太平洋
- 中国
- 日本
- 韓国
- 台湾
- 欧州
- ドイツ
- フランス
- 英国
- イタリア
- ロシア
- 南米
- ブラジル
- 中東・アフリカ
- 中東
- アフリカ
第7章 企業プロファイル
- Entegris
- Linde plc
- Versum Materials
- Taiyo Nippon Sanso
- Solvay
- Nata Opto-electronic
- Shanghai GenTech
第8章 産業チェーンと販売チャネルの分析
- ホスフィンガスの産業チェーン分析
- ホスフィンガスの主要原材料
- ホスフィンガスの生産モードとプロセス
- ホスフィンガスの販売とマーケティング
- ホスフィンガスの顧客
第9章 調査結果と結論
第10章 付録
LIST OF TABLES
- Table 1. Phosphine Gas CAGR in Value (US$ Million), United States VS Global, 2017 VS 2022 VS 2028
- Table 2. Phosphine Gas Market Trends
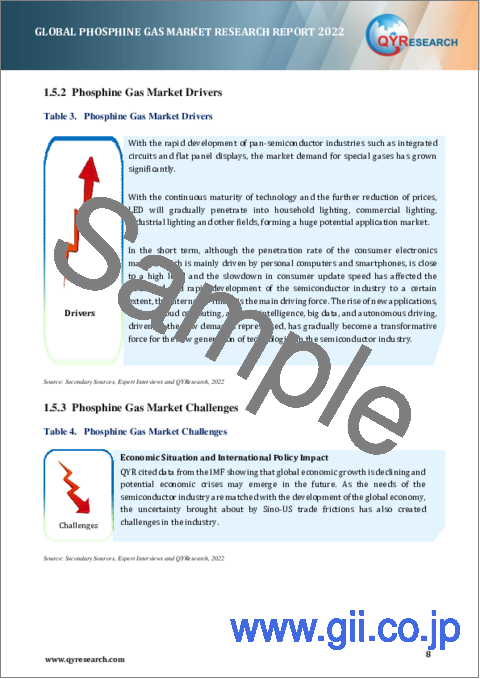
- Table 3. Phosphine Gas Market Drivers
- Table 4. Phosphine Gas Market Challenges
- Table 5. Phosphine Gas Market Restraints
- Table 6. Global Phosphine Gas Sales by Type: 2017 VS 2022 VS 2028 (US$ Million)
- Table 7. United States Phosphine Gas Sales by Type: 2017 VS 2022 VS 2028 (US$ Million)
- Table 8. Global Phosphine Gas Sales by Application: 2017 VS 2022 VS 2028 (US$ Million)
- Table 9. United States Phosphine Gas Sales by Application: 2017 VS 2022 VS 2028 (US$ Million)
- Table 10. Top Phosphine Gas Manufacturers in Global Market, Ranking by Revenue (2021)
- Table 11. Global Phosphine Gas Revenue by Manufacturer, (US$ Million), 2017-2022
- Table 12. Global Phosphine Gas Revenue Share by Manufacturer, 2017-2022
- Table 13. Global Phosphine Gas Sales by Manufacturer, (Tons), 2017-2022
- Table 14. Global Phosphine Gas Sales Share by Manufacturer, 2017-2022
- Table 15. Global Phosphine Gas Price by Manufacturer (2017-2022) & (US$/Kg)
- Table 16. Global Phosphine Gas Manufacturers Market Concentration Ratio (CR5 and HHI)
- Table 17. Global Phosphine Gas by Company Type (Tier 1, Tier 2, and Tier 3) & (based on the Revenue in Phosphine Gas as of 2021)
- Table 18. Top Players of Phosphine Gas in Global Market, Headquarters and Distribution of Producing Region
- Table 19. Manufacturers Phosphine Gas Product Type
- Table 20. Establishment Date of International Phosphine Gas Manufacturers
- Table 21. Manufacturers Mergers & Acquisitions, Expansion Plans
- Table 22. Top Phosphine Gas Players in United States Market, Ranking by Revenue (2021)
- Table 23. United States Phosphine Gas Revenue by Players, (US$ Million), 2020, 2021 & 2022
- Table 24. United States Phosphine Gas Revenue Share by Players, 2020, 2021 & 2022
- Table 25. United States Phosphine Gas Sales by Players, (Tons), 2020, 2021 & 2022
- Table 26. United States Phosphine Gas Sales Share by Players, 2020, 2021 & 2022
- Table 27. Global Phosphine Gas Market Size by Region (US$ Million): 2017 VS 2022 VS 2028
- Table 28. Global Phosphine Gas Sales in Volume by Region (2017-2022) & (Tons)
- Table 29. Global Phosphine Gas Sales in Volume Forecast by Region (2023-2028) & (Tons)
- Table 30. Global Phosphine Gas Sales in Value by Region (2017-2022) & (US$ Million)
- Table 31. Global Phosphine Gas Sales in Value Forecast by Region (2023-2028) & (US$ Million)
- Table 32. North America Phosphine Gas Sales in Volume by Country (2017-2028) & (Tons)
- Table 33. North America Phosphine Gas Sales in Value by Country (2017-2028) & (US$ Million)
- Table 34. Asia-Pacific Phosphine Gas Sales in Volume by Region (2017-2028) & (Tons)
- Table 35. Asia-Pacific Phosphine Gas Sales in Value by Region (2017-2028) & (US$ Million)
- Table 36. Europe Phosphine Gas Sales in Volume by Country (2017-2028) & (Tons)
- Table 37. Europe Phosphine Gas Sales in Value by Country (2017-2028) & (US$ Million)
- Table 38. South America Phosphine Gas Sales in Volume by Country (2017-2028) & (Tons)
- Table 39. South America Phosphine Gas Sales in Value by Country (2017-2028) & (US$ Million)
- Table 40. Middle East and Africa Phosphine Gas Sales in Volume by Country (2017-2028) & (Tons)
- Table 41. Middle East and Africa Phosphine Gas Sales in Value by Country (2017-2028) & (US$ Million)
- Table 42. Entegris Corporation Information
- Table 43. Entegris Description and Business Overview
- Table 44. Entegris Phosphine Gas Sales (Tons), Revenue (US$ Million), Price (US$/Kg) and Gross Margin (2017-2022)
- Table 45. Entegris Phosphine Gas Product
- Table 46. Linde plc Corporation Information
- Table 47. Linde plc Description and Business Overview
- Table 48. Linde plc Phosphine Gas Sales (Tons), Revenue (US$ Million), Price (US$/Kg) and Gross Margin (2017-2022)
- Table 49. Linde plc Phosphine Gas Product
- Table 50. Versum Materials Corporation Information
- Table 51. Versum Materials Description and Business Overview
- Table 52. Versum Materials Phosphine Gas Sales (Tons), Revenue (US$ Million), Price (US$/Kg) and Gross Margin (2017-2022)
- Table 53. Versum Materials Phosphine Gas Product
- Table 54. Taiyo Nippon Sanso Corporation Information
- Table 55. Taiyo Nippon Sanso Description and Business Overview
- Table 56. Taiyo Nippon Sanso Phosphine Gas Sales (Tons), Revenue (US$ Million), Price (US$/Kg) and Gross Margin (2017-2022)
- Table 57. Taiyo Nippon Sanso Phosphine Gas Product
- Table 58. Solvay Corporation Information
- Table 59. Solvay Description and Business Overview
- Table 60. Solvay Phosphine Gas Sales (Tons), Revenue (US$ Million), Price (US$/Kg) and Gross Margin (2017-2022)
- Table 61. Solvay Phosphine Gas Product
- Table 62. Nata Opto-electronic Corporation Information
- Table 63. Nata Opto-electronic Description and Business Overview
- Table 64. Nata Opto-electronic Phosphine Gas Sales (Tons), Revenue (US$ Million), Price (US$/Kg) and Gross Margin (2017-2022)
- Table 65. Nata Opto-electronic Phosphine Gas Product
- Table 66. Shanghai GenTech Corporation Information
- Table 67. Shanghai GenTech Description and Business Overview
- Table 68. Shanghai GenTech Phosphine Gas Sales (Tons), Revenue (US$ Million), Price (US$/Kg) and Gross Margin (2017-2022)
- Table 69. Shanghai GenTech Phosphine Gas Product
- Table 70. Raw Materials Key Suppliers Lists
- Table 71. Phosphine Gas Distributors List
- Table 72. Phosphine Gas Customers List
- Table 73. Research Programs/Design for This Report
- Table 74. Key Data Information from Secondary Sources
- Table 75. Key Data Information from Primary Sources
List of Figures
- Figure 1. Phosphine Gas Product Picture
- Figure 2. Global Phosphine Gas Revenue, (US$ Million), 2017 VS 2022 VS 2028
- Figure 3. Global Phosphine Gas Market Size 2017-2028 (US$ Million)
- Figure 4. Global Phosphine Gas Sales 2017-2028 (Tons)
- Figure 5. United States Phosphine Gas Revenue, (US$ Million), 2017 VS 2022 VS 2028
- Figure 6. United States Phosphine Gas Market Size 2017-2028 (US$ Million)
- Figure 7. United States Phosphine Gas Sales 2017-2028 (Tons)
- Figure 8. United States Phosphine Gas Market Share in Global, in Value 2017-2028
- Figure 9. United States Phosphine Gas Market Share in Global, in Volume 2017-2028
- Figure 10. Phosphine Gas Report Years Considered
- Figure 11. Key Manufacturer of 4N Grade Phosphine Gas
- Figure 12. Key Manufacturer of 5N Grade Phosphine Gas
- Figure 13. Key Manufacturer of 6N Grade Phosphine Gas
- Figure 14. Global Phosphine Gas Market Share by Type in 2022 & 2028
- Figure 15. Global Phosphine Gas Sales in Value by Type (2017-2028) & (US$ Million)
- Figure 16. Global Phosphine Gas Sales Market Share in Value by Type (2017-2028)
- Figure 17. Global Phosphine Gas Sales by Type (2017-2028) & (Tons)
- Figure 18. Global Phosphine Gas Sales Market Share in Volume by Type (2017-2028)
- Figure 19. Global Phosphine Gas Price by Type (2017-2028) & (US$/Kg)
- Figure 20. United States Phosphine Gas Market Share by Type in 2022 & 2028
- Figure 21. United States Phosphine Gas Sales in Value by Type (2017-2028) & (US$ Million)
- Figure 22. United States Phosphine Gas Sales Market Share in Value by Type (2017-2028)
- Figure 23. United States Phosphine Gas Sales by Type (2017-2028) & (Tons)
- Figure 24. United States Phosphine Gas Sales Market Share in Volume by Type (2017-2028)
- Figure 25. United States Phosphine Gas Price by Type (2017-2028) & (US$/Kg)
- Figure 26. Product Picture of Semiconductor Industry
- Figure 27. Product Picture of Photovoltaic Industry
- Figure 28. Global Phosphine Gas Market Share by Application in 2022 & 2028
- Figure 29. Global Phosphine Gas Sales in Value by Application (2017-2028) & (US$ Million)
- Figure 30. Global Phosphine Gas Sales Market Share in Value by Application (2017-2028)
- Figure 31. Global Phosphine Gas Sales by Application (2017-2028) & (Tons)
- Figure 32. Global Phosphine Gas Sales Market Share in Volume by Application (2017-2028)
- Figure 33. Global Phosphine Gas Price by Application (2017-2028) & (US$/Kg)
- Figure 34. United States Phosphine Gas Market Share by Application in 2022 & 2028
- Figure 35. United States Phosphine Gas Sales in Value by Application (2017-2028) & (US$ Million)
- Figure 36. United States Phosphine Gas Sales Market Share in Value by Application (2017-2028)
- Figure 37. United States Phosphine Gas Sales by Application (2017-2028) & (Tons)
- Figure 38. United States Phosphine Gas Sales Market Share in Volume by Application (2017-2028)
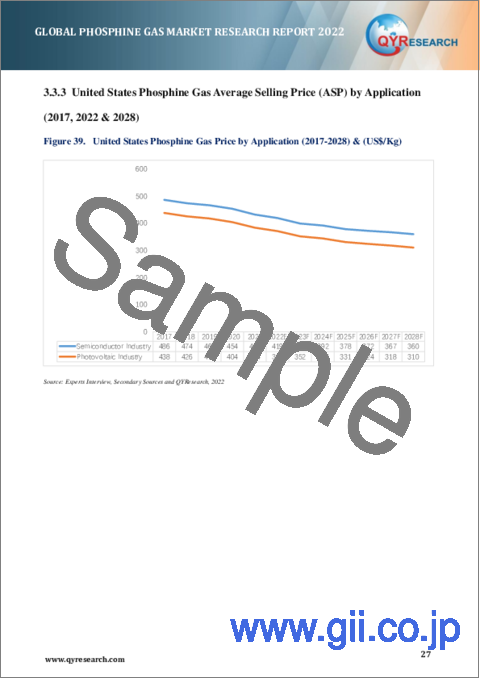
- Figure 39. United States Phosphine Gas Price by Application (2017-2028) & (US$/Kg)
- Figure 40. The Top 3 and 5 Largest Manufacturers of Phosphine Gas in the World: Market Share by Phosphine Gas Revenue in 2021
- Figure 41. Global Phosphine Gas Market Size Market Share by Region: 2022 VS 2028
- Figure 42. Global Phosphine Gas Sales in Volume Market Share by Region (2017-2028)
- Figure 43. Global Phosphine Gas Sales in Value Market Share by Region (2017-2028)
- Figure 44. North America Phosphine Gas Sales in Volume Growth Rate 2017-2028 (Tons)
- Figure 45. North America Phosphine Gas Sales in Value Growth Rate 2017-2028 (US$ Million)
- Figure 46. United States Phosphine Gas Sales in Value Growth Rate (2017-2028) & (US$ Million)
- Figure 47. Canada Phosphine Gas Sales in Value Growth Rate (2017-2028) & (US$ Million)
- Figure 48. Mexico Phosphine Gas Sales in Value Growth Rate (2017-2028) & (US$ Million)
- Figure 49. Asia-Pacific Phosphine Gas Sales in Volume Growth Rate 2017-2028 (Tons)
- Figure 50. Asia-Pacific Phosphine Gas Sales in Value Growth Rate 2017-2028 (US$ Million)
- Figure 51. China Phosphine Gas Sales in Value Growth Rate (2017-2028) & (US$ Million)
- Figure 52. Japan Phosphine Gas Sales in Value Growth Rate (2017-2028) & (US$ Million)
- Figure 53. South Korea Phosphine Gas Sales in Value Growth Rate (2017-2028) & (US$ Million)
- Figure 54. China Taiwan Phosphine Gas Sales in Value Growth Rate (2017-2028) & (US$ Million)
- Figure 55. Europe Phosphine Gas Sales in Volume Growth Rate 2017-2028 (Tons)
- Figure 56. Europe Phosphine Gas Sales in Value Growth Rate 2017-2028 (US$ Million)
- Figure 57. Germany Phosphine Gas Sales in Value Growth Rate (2017-2028) & (US$ Million)
- Figure 58. France Phosphine Gas Sales in Value Growth Rate (2017-2028) & (US$ Million)
- Figure 59. U.K. Phosphine Gas Sales in Value Growth Rate (2017-2028) & (US$ Million)
- Figure 60. Italy Phosphine Gas Sales in Value Growth Rate (2017-2028) & (US$ Million)
- Figure 61. Russia Phosphine Gas Sales in Value Growth Rate (2017-2028) & (US$ Million)
- Figure 62. South America Phosphine Gas Sales in Volume Growth Rate 2017-2028 (Tons)
- Figure 63. South America Phosphine Gas Sales in Value Growth Rate 2017-2028 (US$ Million)
- Figure 64. Brazil Phosphine Gas Sales in Value Growth Rate (2017-2028) & (US$ Million)
- Figure 65. Middle East and Africa Phosphine Gas Sales in Volume Growth Rate 2017-2028 (Tons)
- Figure 66. Middle East and Africa Phosphine Gas Sales in Value Growth Rate 2017-2028 (US$ Million)
- Figure 67. Middle East Phosphine Gas Sales in Value Growth Rate (2017-2028) & (US$ Million)
- Figure 68. Africa Phosphine Gas Sales in Value Growth Rate (2017-2028) & (US$ Million)
- Figure 69. Phosphine Gas Value Chain
- Figure 70. Channels of Distribution
- Figure 71. Distributors Profiles
- Figure 72. Bottom-up and Top-down Approaches for This Report
- Figure 73. Data Triangulation
- Figure 74. Key Executives Interviewed 83
Market Analysis and Insights:
This report focuses on global and United States Phosphine Gas market, also covers the segmentation data of other regions in regional level and county level.
Due to the COVID-19 pandemic, the global Phosphine Gas market size is estimated to be worth US$ 73.90 million in 2022 and is forecast to a readjusted size of US$ 110.32 million by 2028 with a CAGR of 6.91% during the review period. Fully considering the economic change by this health crisis, by Type, 6N grade accounting for 87.45% of the Phosphine Gas global market in 2021, is projected to value US$ 100.61 million by 2028, growing at a revised 7.53% CAGR in the post-COVID-19 period. While by Application, Semiconductor Industry was the leading segment, accounting for over 89.52% market share in 2021, and altered to an 7.30% CAGR throughout this forecast period.
In United States the Phosphine Gas market size is expected to grow from US$ 6.98 million in 2021 to US$ 9.46 million by 2028, at a CAGR of 4.89% during the forecast period.
Scope and Market Size:
Phosphine Gas market is segmented in regional and country level, by players, by Type, and by Application. Players, stakeholders, and other participants in the global Phosphine Gas market will be able to gain the upper hand as they use the report as a powerful resource. The segmental analysis focuses on sales, revenue and forecast by Type and by Application for the period 2017-2028.
For United States market, this report focuses on the Phosphine Gas market size by players, by Type, and by Application, for the period 2017-2028. The key players include the global and local players which play important roles in United States.
By Company
- Entegris
- Linde plc
- Versum Materials
- Taiyo Nippon Sanso
- Solvay
- Nata Opto-electronic
- Shanghai GenTech
Segment by Type
- 4N
- 5N
- 6N
Segment by Application
- Semiconductor Industry
- Photovoltaic Industry
By Region
- North America
- United States
- Canada
- Mexico
- Asia-Pacific
- China
- Japan
- South Korea
- China Taiwan
- Others
- Europe
- Germany
- France
- U.K.
- Italy
- Russia
- Others
- South America
- Brazil
- Others
- Middle East & Africa
- Middle East
- Africa
TABLE OF CONTENTS
1 Study Coverage
- 1.1 Phosphine Gas Product Introduction
- 1.2 Global Phosphine Gas Outlook 2017 VS 2022 VS 2028
- 1.2.1 Global Phosphine Gas Sales in US$ Million for the Year 2017-2028
- 1.2.2 Global Phosphine Gas Sales in Volume for the Year 2017-2028
- 1.3 United States Phosphine Gas Outlook 2017 VS 2022 VS 2028
- 1.3.1 United States Phosphine Gas Sales in US$ Million for the Year 2017-2028
- 1.3.2 United States Phosphine Gas Sales in Volume for the Year 2017-2028
- 1.4 Phosphine Gas Market Size, United States VS Global, 2017 VS 2022 VS 2028
- 1.4.1 The Market Share of United States Phosphine Gas in Global, 2017 VS 2022 VS 2028
- 1.4.2 The Growth Rate of Phosphine Gas Market Size, United States VS Global, 2017 VS 2022 VS 2028
- 1.5 Phosphine Gas Market Dynamics
- 1.5.1 Phosphine Gas Industry Trends
- 1.5.2 Phosphine Gas Market Drivers
- 1.5.3 Phosphine Gas Market Challenges
- 1.5.4 Phosphine Gas Market Restraints
- 1.6 Study Objectives
- 1.7 Years Considered
2 Phosphine Gas by Type
- 2.1 Phosphine Gas Market Segment by Type
- 2.1.1 4N
- 2.1.2 5N
- 2.1.3 6N
- 2.2 Global Phosphine Gas Market Size by Type
- 2.2.1 Global Phosphine Gas Sales in Value, by Type (2017, 2022 & 2028)
- 2.2.2 Global Phosphine Gas Sales in Volume, by Type (2017, 2022 & 2028)
- 2.2.3 Global Phosphine Gas Average Selling Price (ASP) by Type (2017, 2022 & 2028)
- 2.3 United States Phosphine Gas Market Size by Type
- 2.3.1 United States Phosphine Gas Sales in Value, by Type (2017, 2022 & 2028)
- 2.3.2 United States Phosphine Gas Sales in Volume, by Type (2017, 2022 & 2028)
- 2.3.3 United States Phosphine Gas Average Selling Price (ASP) by Type (2017, 2022 & 2028)
3 Phosphine Gas by Application
- 3.1 Phosphine Gas Market Segment by Application
- 3.1.1 Semiconductor Industry
- 3.1.2 Photovoltaic Industry
- 3.2 Global Phosphine Gas Market Size by Application
- 3.2.1 Global Phosphine Gas Sales in Value, by Application (2017, 2022 & 2028)
- 3.2.2 Global Phosphine Gas Sales in Volume, by Application (2017, 2022 & 2028)
- 3.2.3 Global Phosphine Gas Average Selling Price (ASP) by Application (2017, 2022 & 2028)
- 3.3 United States Phosphine Gas Market Size by Application
- 3.3.1 United States Phosphine Gas Sales in Value, by Application (2017, 2022 & 2028)
- 3.3.2 United States Phosphine Gas Sales in Volume, by Application (2017, 2022 & 2028)
- 3.3.3 United States Phosphine Gas Average Selling Price (ASP) by Application (2017, 2022 & 2028)
4 Global Phosphine Gas Competitor Landscape by Company
- 4.1 Global Phosphine Gas Market Size by Company
- 4.1.1 Top Global Phosphine Gas Manufacturers Ranked by Revenue (2021)
- 4.1.2 Global Phosphine Gas Revenue by Manufacturer (2017-2022)
- 4.1.3 Global Phosphine Gas Sales by Manufacturer (2017-2022)
- 4.1.4 Global Phosphine Gas Price by Manufacturer (2017-2022)
- 4.2 Global Phosphine Gas Concentration Ratio (CR)
- 4.2.1 Phosphine Gas Market Concentration Ratio (CR) (2017-2022)
- 4.2.2 Global Top 3 and Top 5 Largest Manufacturers of Phosphine Gas in 2021
- 4.2.3 Global Phosphine Gas Market Share by Company Type (Tier 1, Tier 2, and Tier 3)
- 4.3 Global Phosphine Gas Manufacturing Base Distribution, Product Type
- 4.3.1 Global Phosphine Gas Manufacturers, Headquarters and Distribution of Producing Region
- 4.3.2 Manufacturers Phosphine Gas Product Type
- 4.3.3 Establishment Date of International Phosphine Gas Manufacturers
- 4.4 Manufacturers Mergers & Acquisitions, Expansion Plans
- 4.5 United States Phosphine Gas Market Size by Company
- 4.5.1 Top Phosphine Gas Players in United States, Ranked by Revenue (2021)
- 4.5.2 United States Phosphine Gas Revenue by Players (2020, 2021 & 2022)
- 4.5.3 United States Phosphine Gas Sales by Players (2020, 2021 & 2022)
5 Global Phosphine Gas Market Size by Region
- 5.1 Global Phosphine Gas Market Size by Region: 2017 VS 2022 VS 2028
- 5.2 Global Phosphine Gas Market Size in Volume by Region (2017-2028)
- 5.2.1 Global Phosphine Gas Sales in Volume by Region: 2017-2022
- 5.2.2 Global Phosphine Gas Sales in Volume Forecast by Region (2023-2028)
- 5.3 Global Phosphine Gas Market Size in Value by Region (2017-2028)
- 5.3.1 Global Phosphine Gas Sales in Value by Region: 2017-2022
- 5.3.2 Global Phosphine Gas Sales in Value by Region: 2023-2028
6 Segment in Regional Level & Country Level
- 6.1 North America
- 6.1.1 North America Phosphine Gas Market Size YoY Growth 2017-2028
- 6.1.2 North America Phosphine Gas Market Facts & Figures by Country (2017, 2022 & 2028)
- 6.1.3 United States
- 6.1.4 Canada
- 6.1.5 Mexico
- 6.2 Asia-Pacific
- 6.2.1 Asia-Pacific Phosphine Gas Market Size YoY Growth 2017-2028
- 6.2.2 Asia-Pacific Phosphine Gas Market Facts & Figures by Region (2017, 2022 & 2028)
- 6.2.3 China
- 6.2.4 Japan
- 6.2.5 South Korea
- 6.2.6 China Taiwan
- 6.3 Europe
- 6.3.1 Europe Phosphine Gas Market Size YoY Growth 2017-2028
- 6.3.2 Europe Phosphine Gas Market Facts & Figures by Country (2017, 2022 & 2028)
- 6.3.3 Germany
- 6.3.4 France
- 6.3.5 U.K.
- 6.3.6 Italy
- 6.3.7 Russia
- 6.4 South America
- 6.4.1 South America Phosphine Gas Market Size YoY Growth 2017-2028
- 6.4.2 South America Phosphine Gas Market Facts & Figures by Country (2017, 2022 & 2028)
- 6.4.3 Brazil
- 6.5 Middle East and Africa
- 6.5.1 Middle East and Africa Phosphine Gas Market Size YoY Growth 2017-2028
- 6.5.2 Middle East and Africa Phosphine Gas Market Facts & Figures by Country (2017, 2022 & 2028)
- 6.5.3 Middle East
- 6.5.4 Africa
7 Company Profiles
- 7.1 Entegris
- 7.1.1 Entegris Corporation Information
- 7.1.2 Entegris Description and Business Overview
- 7.1.3 Entegris Phosphine Gas Sales, Revenue and Gross Margin (2017-2022)
- 7.1.4 Entegris Phosphine Gas Products Offered
- 7.2 Linde plc
- 7.2.1 Linde plc Corporation Information
- 7.2.2 Linde plc Description and Business Overview
- 7.2.3 Linde plc Phosphine Gas Sales, Revenue and Gross Margin (2017-2022)
- 7.2.4 Linde plc Phosphine Gas Products Offered
- 7.3 Versum Materials
- 7.3.1 Versum Materials Corporation Information
- 7.3.2 Versum Materials Description and Business Overview
- 7.3.3 Versum Materials Phosphine Gas Sales, Revenue and Gross Margin (2017-2022)
- 7.3.4 Versum Materials Phosphine Gas Products Offered
- 7.4 Taiyo Nippon Sanso
- 7.4.1 Taiyo Nippon Sanso Corporation Information
- 7.4.2 Taiyo Nippon Sanso Description and Business Overview
- 7.4.3 Taiyo Nippon Sanso Phosphine Gas Sales, Revenue and Gross Margin (2017-2022)
- 7.4.4 Taiyo Nippon Sanso Phosphine Gas Products Offered
- 7.5 Solvay
- 7.5.1 Solvay Corporation Information
- 7.5.2 Solvay Description and Business Overview
- 7.5.3 Solvay Phosphine Gas Sales, Revenue and Gross Margin (2017-2022)
- 7.5.4 Solvay Phosphine Gas Products Offered
- 7.6 Nata Opto-electronic
- 7.6.1 Nata Opto-electronic Corporation Information
- 7.6.2 Nata Opto-electronic Description and Business Overview
- 7.6.3 Nata Opto-electronic Phosphine Gas Sales, Revenue and Gross Margin (2017-2022)
- 7.6.4 Nata Opto-electronic Phosphine Gas Products Offered
- 7.7 Shanghai GenTech
- 7.7.1 Shanghai GenTech Corporation Information
- 7.7.2 Shanghai GenTech Description and Business Overview
- 7.7.3 Shanghai GenTech Phosphine Gas Sales, Revenue and Gross Margin (2017-2022)
- 7.7.4 Shanghai GenTech Phosphine Gas Products Offered
8 Industry Chain and Sales Channels Analysis
- 8.1 Phosphine Gas Industry Chain Analysis
- 8.2 Phosphine Gas Key Raw Materials
- 8.3 Phosphine Gas Production Mode & Process
- 8.4 Phosphine Gas Sales and Marketing
- 8.4.1 Phosphine Gas Sales Channels
- 8.4.2 Phosphine Gas Distributors
- 8.5 Phosphine Gas Customers
9 Research Findings and Conclusion
10 Appendix
- 10.1 Research Methodology
- 10.1.1 Methodology/Research Approach
- 10.1.2 Data Source
- 10.2 Author Details
- 10.3 Disclaimer