|
|
市場調査レポート
商品コード
1100624
風力発電用フランジの世界市場:分析・沿革・予測 (2017年~2028年)Global Wind Power Flange Market Report, History and Forecast 2017-2028 |
||||||
|
|
|||||||
|
● お客様のご希望に応じて、既存データの加工や未掲載情報(例:国別セグメント)の追加などの対応が可能です。 詳細はお問い合わせください。 |
|||||||


| 風力発電用フランジの世界市場:分析・沿革・予測 (2017年~2028年) |
|
出版日: 2022年07月12日
発行: QYResearch
ページ情報: 英文 102 Pages
納期: 2~3営業日
|
- 全表示
- 概要
- 図表
- 目次
世界の風力発電用フランジの市場規模は、2021年に8億6,446万米ドルに達した後、2022年から2028年の間に6.98%のCAGRで成長し、2028年末までに14億55万米ドルに達すると予測されています。
目次
第1章 風力発電用フランジ:市場概要
- 風力発電用フランジ:製品概要
- 種類別の市場セグメント
- 2MW未満
- 2MW~3MW
- 3MW以上
- 種類別の市場規模
- 市場規模の概要:種類別 (2017年~2028年)
- 過去の市場規模:種類別 (2017年~2022年)
- 市場規模の予測:種類別 (2023年~2028年)
- 主要地域の市場規模:種類別
- 北米の風力発電用フランジの販売:種類別 (2017年~2022年)
- 欧州の風力発電用フランジの販売:種類別 (2017年~2022年)
- アジア太平洋の風力発電用フランジの販売:種類別 (2017年~2022年)
- ラテンアメリカの風力発電用フランジの販売:種類別 (2017年~2022年)
- 中東・アフリカの風力発電用フランジの販売:種類別 (2017年~2022年)
第2章 風力発電用フランジ:企業別の市場競争
- 世界の風力発電用フランジの主要企業の販売 (2017年~2022年)
- 世界の風力発電用フランジの主要企業の収益 (2017年~2022年)
- 世界の風力発電用フランジの主要企業の価格 (2017年~2022年)
- 世界の風力発電用フランジの主要メーカーの本社
- 風力発電用フランジ市場の競争状況と動向
- 世界の主要メーカー:企業の種類別 (ティア1、ティア2、ティア3) (収益別、2021年)
- 主要メーカーの設立時期
第3章 風力発電用フランジ:地域別の現状と展望
- 世界の風力発電用フランジの市場規模・CAGR:地域別 (2017年・2022年・2028年)
- 過去の市場規模:地域別
- 市場規模の予測:地域別
第4章 風力発電用フランジ:用途別
- 用途別の市場セグメント
- 陸上風力発電
- 洋上風力発電
- 用途別の市場規模 (数量ベース)
- 販売:用途別 (単位:キロトン、2017年~2028年)
- 用途別の市場規模 (金額ベース)
- 販売:用途別 (単位:100万米ドル、2017年~2028年)
第5章 北米の風力発電用フランジ:国別
- 過去の市場規模:国別
- 市場規模の予測:国別
第6章 欧州の風力発電用フランジ:国別
第7章 アジア太平洋の風力発電用フランジ:地域別
第8章 ラテンアメリカの風力発電用フランジ:国別
第9章 中東・アフリカの風力発電用フランジ:国別
第10章 企業プロファイル:風力発電用フランジ事業の主要指標
- Iraeta
- Hengrun
- Tianbao
- Shuanghuan Group
- Taewoong
- Euskal Forging
- Flanschenwerk Thal
- CAB
- Jinrui
- CHW Forge
第11章 上流工程・機会・課題・リスク・影響要因の分析
- 風力発電用フランジの主要原材料
- 製造コストの構造
- 風力発電用フランジの産業チェーンの分析
- 市場力学
第12章 マーケティング戦略分析、流通業者
- 販売チャンネル
- 風力発電用フランジの流通業者
- 風力発電用フランジの下流工程の顧客
第13章 調査結果と結論
第14章 付録
LIST OF TABLES
- Table 1. Wind Power Flange Market Segment by Type
- Table 2. Global Wind Power Flange Sales by Type: 2017 VS 2022 VS 2028 (US$ Million)
- Table 3. Global Wind Power Flange Sales by Type (2017-2022) & (K MT)
- Table 4. Global Wind Power Flange Sales Market Share in Volume by Type (2017-2022)
- Table 5. Global Wind Power Flange Sales by Type (2017-2022) & (US$ Million)
- Table 6. Global Wind Power Flange Sales Market Share in Value by Type (2017-2022)
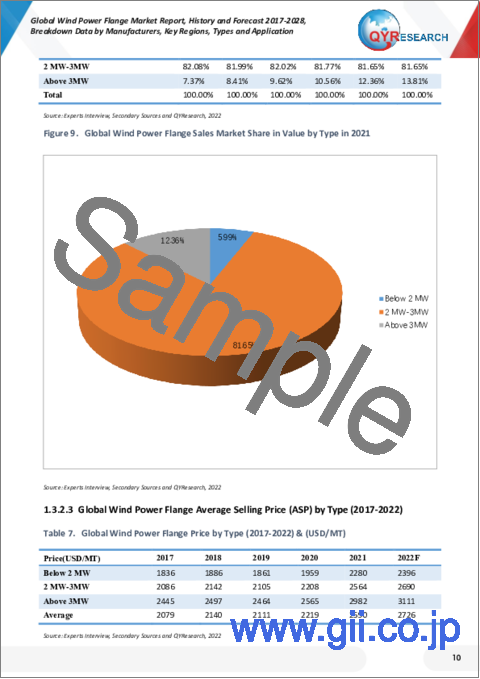
- Table 7. Global Wind Power Flange Price by Type (2017-2022) & (USD/MT)
- Table 8. Global Wind Power Flange Sales by Type (2023-2028) & (K MT)
- Table 9. Global Wind Power Flange Sales Market Share in Volume by Type (2023-2028)
- Table 10. Global Wind Power Flange Sales by Type (2023-2028) & (US$ Million)
- Table 11. Global Wind Power Flange Sales Market Share in Value by Type (2023-2028)
- Table 12. Global Wind Power Flange Price by Type (2023-2028) & (USD/MT)
- Table 13. North America Wind Power Flange Sales by Type (2017-2022) & (K MT)
- Table 14. Europe Wind Power Flange Sales (K MT) by Type (2017-2022)
- Table 15. Asia-Pacific Wind Power Flange Sales (K MT) by Type (2017-2022)
- Table 16. Latin America Wind Power Flange Sales (K MT) by Type (2017-2022)
- Table 17. Middle East and Africa Wind Power Flange Sales (K MT) by Type (2017-2022)
- Table 18. Global Wind Power Flange Sales by Company (2017-2022) & (K MT)
- Table 19. Global Wind Power Flange Sales Share by Company (2017-2022)
- Table 20. Global Wind Power Flange Revenue by Company (2017-2022) & (US$ Million)
- Table 21. Global Wind Power Flange Revenue Share by Company (2017-2022)
- Table 22. Global Market Wind Power Flange Price by Company (2017-2022) & (USD/MT)
- Table 23. Global Wind Power Flange Top Manufacturers Headquarters
- Table 24. Global Wind Power Flange Manufacturers Market Concentration Ratio (CR5 and HHI)
- Table 25. Global Top Manufacturers Market Share by Company Type (Tier 1, Tier 2, and Tier 3) & (based on the Revenue in Wind Power Flange as of 2021)
- Table 26. Established Date of Wind Power Flange Key Manufacturers
- Table 27. Global Wind Power Flange Market Size Comparison by Region (US$ Million): 2017 VS 2022 VS 2028
- Table 28. Global Wind Power Flange Sales by Region (2017-2022) & (K MT)
- Table 29. Global Wind Power Flange Sales Market Share in Volume by Region (2017-2022)
- Table 30. Global Wind Power Flange Sales by Region (2017-2022) & (US$ Million)
- Table 31. Global Wind Power Flange Sales Market Share in Value by Region (2017-2022)
- Table 32. Global Wind Power Flange Sales by Region (2023-2028) & (K MT)
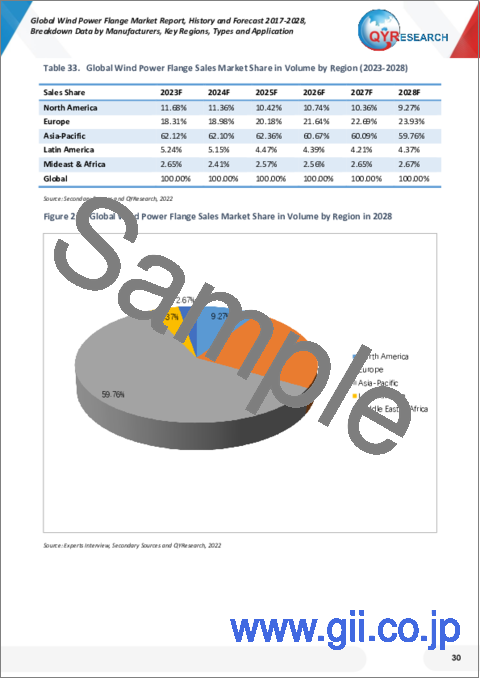
- Table 33. Global Wind Power Flange Sales Market Share in Volume by Region (2023-2028)
- Table 34. Global Wind Power Flange Sales by Region (2023-2028) & (US$ Million)
- Table 35. Global Wind Power Flange Sales Market Share in Value by Region (2023-2028)
- Table 36. Wind Power Flange Market Segment by Type
- Table 37. Global Wind Power Flange Sales by Application: 2017 VS 2022 VS 2028 (K MT)
- Table 38. Global Wind Power Flange Sales by Application (2017-2022) & (K MT)
- Table 39. Global Wind Power Flange Sales Market Share in Volume by Application (2017-2022)
- Table 40. Global Wind Power Flange Sales by Application (2023-2028) & (K MT)
- Table 41. Global Wind Power Flange Sales Market Share in Volume by Application (2023-2028)
- Table 42. Global Wind Power Flange Sales by Application: 2017 VS 2022 VS 2028 (US$ Million)
- Table 43. Global Wind Power Flange Sales by Application (2017-2022) & (US$ Million)
- Table 44. Global Wind Power Flange Sales Market Share in Volume by Application (2017-2022)
- Table 45. Global Wind Power Flange Sales by Application (2023-2028) & (US$ Million)
- Table 46. Global Wind Power Flange Sales Market Share in Volume by Application (2023-2028)
- Table 47. North America Wind Power Flange Sales by Country (2017-2022) & (K MT)
- Table 48. North America Wind Power Flange Sales Market Share in Volume by Country (2017-2022)
- Table 49. North America Wind Power Flange Sales by Country (2017-2022) & (US$ Million)
- Table 50. North America Wind Power Flange Sales Market Share in Value by Country (2017-2022)
- Table 51. North America Wind Power Flange Sales by Country (2023-2028) & (K MT)
- Table 52. North America Wind Power Flange Sales by Country (2023-2028) & (US$ Million)
- Table 53. Europe Wind Power Flange Sales by Country (2017-2022) & (K MT)
- Table 54. Europe Wind Power Flange Sales Market Share in Volume by Country (2017-2022)
- Table 55. Europe Wind Power Flange Sales by Country (2017-2022) & (US$ Million)
- Table 56. Europe Wind Power Flange Sales Market Share in Value by Country (2017-2022)
- Table 57. Europe Wind Power Flange Sales by Country (2023-2028) & (K MT)
- Table 58. Europe Wind Power Flange Sales by Country (2023-2028) & (US$ Million)
- Table 59. Asia-Pacific Wind Power Flange Sales by Region (2017-2022) & (K MT)
- Table 60. Asia-Pacific Wind Power Flange Sales Market Share in Volumeby Region (2017-2022)
- Table 61. Asia-Pacific Wind Power Flange Sales by Region (2017-2022) & (US$ Million)
- Table 62. Asia-Pacific Wind Power Flange Sales Market Share in Value by Region (2017-2022)
- Table 63. Asia-Pacific Wind Power Flange Sales by Region (2023-2028) & (K MT)
- Table 64. Asia-Pacific Wind Power Flange Sales by Region (2023-2028) & (US$ Million)
- Table 65. Latin America Wind Power Flange Sales by Country (2017-2022) & (K MT)
- Table 66. Latin America Wind Power Flange Sales Market Share in Volume by Country (2017-2022)
- Table 67. Latin America Wind Power Flange Sales by Country (2017-2022) & (US$ Million)
- Table 68. Latin America Wind Power Flange Sales Market Share in Value by Country (2017-2022)
- Table 69. Latin America Wind Power Flange Sales by Country (2023-2028) & (K MT)
- Table 70. Latin America Wind Power Flange Sales by Country (2023-2028) & (US$ Million)
- Table 71. Middle East and Africa Wind Power Flange Sales by Country (2017-2022) & (K MT)
- Table 72. Middle East and Africa Wind Power Flange Sales Market Share in Volume by Country (2017-2022)
- Table 73. Middle East and Africa Wind Power Flange Sales by Country (2017-2022) & (US$ Million)
- Table 74. Middle East and Africa Wind Power Flange Sales Market Share in Value by Country (2017-2022)
- Table 75. Middle East and Africa Wind Power Flange Sales by Country (2023-2028) & (K MT)
- Table 76. Middle East and Africa Wind Power Flange Sales by Country (2023-2028) & (US$ Million)
- Table 77. Iraeta Corporation Information
- Table 78. Iraeta Wind Power Flange Sales (K MT), Revenue (US$ Million), Price (USD/MT) and Gross Margin (2017-2022)
- Table 79. Iraeta Wind Power Flange Product
- Table 80. Hengrun Corporation Information
- Table 81. Hengrun Wind Power Flange Sales (K MT), Revenue (US$ Million), Price (USD/MT) and Gross Margin (2017-2022)
- Table 82. Hengrun Wind Power Flange Product
- Table 83. Tianbao Corporation Information
- Table 84. Tianbao Wind Power Flange Sales (K MT), Revenue (US$ Million), Price (USD/MT) and Gross Margin (2017-2022)
- Table 85. Tianbao Wind Power Flange Product
- Table 86. Shuanghuan Group Corporation Information
- Table 87. Shuanghuan Group Wind Power Flange Sales (K MT), Revenue (US$ Million), Price (USD/MT) and Gross Margin (2017-2022)
- Table 88. Shuanghuan Group Wind Power Flange Product
- Table 89. Taewoong Corporation Information
- Table 90. Taewoong Wind Power Flange Sales (K MT), Revenue (US$ Million), Price (USD/MT) and Gross Margin (2017-2022)
- Table 91. Taewoong Wind Power Flange Product
- Table 92. Euskal Forging Corporation Information
- Table 93. Euskal Forging Wind Power Flange Sales (K MT), Revenue (US$ Million), Price (USD/MT) and Gross Margin (2017-2022)
- Table 94. Euskal Forging Wind Power Flange Product
- Table 95. Flanschenwerk Thal Corporation Information
- Table 96. Flanschenwerk Thal Wind Power Flange Sales (K MT), Revenue (US$ Million), Price (USD/MT) and Gross Margin (2017-2022)
- Table 97. Flanschenwerk Thal Wind Power Flange Product
- Table 98. CAB Corporation Information
- Table 99. CAB Wind Power Flange Sales (K MT), Revenue (US$ Million), Price (USD/MT) and Gross Margin (2017-2022)
- Table 100. CAB Wind Power Flange Product
- Table 101. Jinrui Corporation Information
- Table 102. Jinrui Wind Power Flange Sales (K MT), Revenue (US$ Million), Price (USD/MT) and Gross Margin (2017-2022)
- Table 103. Jinrui Wind Power Flange Product
- Table 104. CHW Forge Corporation Information
- Table 105. CHW Forge Wind Power Flange Sales (K MT), Revenue (US$ Million), Price (USD/MT) and Gross Margin (2017-2022)
- Table 106. CHW Forge Wind Power Flange Product
- Table 107. Key Raw Materials Lists
- Table 108. Wind Power Flange Market Trends
- Table 109. Wind Power Flange Opportunities and Drivers
- Table 110. Wind Power Flange Market Challenges
- Table 111. Wind Power Flange Distributors List
- Table 112. Wind Power Flange Downstream Customers
- Table 113. Research Programs/Design for This Report
- Table 114. Key Data Information from Secondary Sources
- Table 115. Key Data Information from Primary Sources
List of Figures
- Figure 1. Wind Power Flange Product Picture
- Figure 2. Global Wind Power Flange Market Size, 2017 VS 2022 VS 2028 (US$ Million)
- Figure 3. Global Wind Power Flange Market Size Status and Outlook (2017-2028) & (US$ Million)
- Figure 4. Global Wind Power Flange Sales Status and Outlook (2017-2028) & (K MT)
- Figure 5. Product Picture of Below 2 MW
- Figure 6. Product Picture of 2 MW-3MWs
- Figure 7. Product Picture of Above 3MW
- Figure 8. Global Wind Power Flange Sales Market Share in Volume by Type in 2021
- Figure 9. Global Wind Power Flange Sales Market Share in Value by Type in 2021
- Figure 10. Global Wind Power Flange Sales Market Share in Volume by Type in 2028
- Figure 11. Global Wind Power Flange Sales Market Share in Value by Type in 2028
- Figure 12. North America Wind Power Flange Sales Market Share in Volume by Type in 2021
- Figure 13. Europe Wind Power Flange Sales Market Share in Volume by Type in 2021
- Figure 14. Asia-Pacific Wind Power Flange Sales Market Share in Volume by Type in 2021
- Figure 15. Latin America Wind Power Flange Sales Market Share in Volume by Type in 2021
- Figure 16. Middle East and Africa Wind Power Flange Sales Market Share in Volume by Type in 2021
- Figure 17. Global Wind Power Flange Sales Share by Company in 2021
- Figure 18. Global Wind Power Flange Revenue Share by Company in 2021
- Figure 19. The 5 Largest Manufacturers in the World: Market Share by Wind Power Flange Revenue in 2021
- Figure 20. Global Wind Power Flange Sales Market Share in Volume by Region in 2021
- Figure 21. Global Wind Power Flange Sales Market Share in Value by Region in 2021
- Figure 22. Global Wind Power Flange Sales Market Share in Volume by Region in 2028
- Figure 23. Global Wind Power Flange Sales Market Share in Value by Region in 2028
- Figure 24. Product Picture of Onshore Wind Power
- Figure 25. Product Picture of Offshore Wind Powers
- Figure 26. Global Wind Power Flange Sales Market Share in Volume by Application in 2021
- Figure 27. Global Wind Power Flange Sales Market Share in Volume by Application in 2028
- Figure 28. Global Wind Power Flange Sales Market Share in Volume by Application in 2021
- Figure 29. Global Wind Power Flange Sales Market Share in Volume by Application in 2028
- Figure 30. Key Raw Materials Steel Price Trend (Yuan/MT)
- Figure 31. Wind Power Flange Manufacturing Cost Structure
- Figure 32. Wind Power Flange Industrial Chain Analysis
- Figure 33. Porter's Five Forces Analysis
- Figure 34. Channels of Distribution
- Figure 35. Distributors Profiles
- Figure 36. Bottom-up and Top-down Approaches for This Report
- Figure 37. Data Triangulation
- Figure 38. Key Executives Interviewed 88
Market Analysis and Insights:
In 2021, the global Wind Power Flange market size was US$ 864.46 million and it is expected to reach US$ 1400.55 million by the end of 2028, with a CAGR of 6.98% between 2022 and 2028.
Scope and Market Size:
The global Wind Power Flange market is segmented by region (country), company, by Type, and By Application. Players, stakeholders, and other participants in the global Wind Power Flange market will be able to gain the upper hand as they use the report as a powerful resource. The segmental analysis focuses on sales, revenue and forecast by region (country), by Type, and By Application for the period 2017-2028.
By Company
- Iraeta
- Hengrun
- Tianbao
- Shuanghuan Group
- Taewoong
- Euskal Forging
- Flanschenwerk Thal
- CAB
- Jinrui
- CHW Forge
Segment by Type
- Below 2 MW
- 2 MW-3MW
- Above 3MW
Segment by Application
- Onshore Wind Power
- Offshore Wind Power
By Region
- North America
- United States
- Canada
- Asia-Pacific
- China
- Japan
- Australia
- India
- Southeast Asia
- Other Regions
- Europe
- Germany
- U.K.
- France
- Sweden
- Spain
- Rest of Europe
- Latin America
- Mexico
- Brazil
- Argentina
- Other Regions
- Middle East & Africa
- Middle East
- Africa
TABLE OF CONTENTS
1 WIND POWER FLANGE MARKET OVERVIEW
- 1.1 Wind Power Flange Product Overview
- 1.2 Wind Power Flange Market Segment by Type
- 1.2.1 Below 2 MW
- 1.2.2 2 MW-3MW
- 1.2.3 Above 3MW
- 1.3 Global Wind Power Flange Market Size by Type
- 1.3.1 Global Wind Power Flange Market Size Overview by Type (2017-2028)
- 1.3.2 Global Wind Power Flange Historic Market Size Review by Type (2017-2022)
- 1.3.2.1 Global Wind Power Flange Sales Breakdown in Volume, by Type (2017-2022)
- 1.3.2.2 Global Wind Power Flange Sales Breakdown in Value, by Type (2017-2022)
- 1.3.2.3 Global Wind Power Flange Average Selling Price (ASP) by Type (2017-2022)
- 1.3.3 Global Wind Power Flange Forecasted Market Size by Type (2023-2028)
- 1.3.3.1 Global Wind Power Flange Sales Breakdown in Volume by Type (2023-2028)
- 1.3.3.2 Global Wind Power Flange Sales Breakdown in Value by Type (2023-2028)
- 1.3.3.3 Global Wind Power Flange Average Selling Price (ASP) by Type (2023-2028)
- 1.4 Key Regions Market Size Segment by Type
- 1.4.1 North America Wind Power Flange Sales Breakdown by Type (2017-2022)
- 1.4.2 Europe Wind Power Flange Sales Breakdown by Type (2017-2022)
- 1.4.3 Asia-Pacific Wind Power Flange Sales Breakdown by Type (2017-2022)
- 1.4.4 Latin America Wind Power Flange Sales Breakdown by Type (2017-2022)
- 1.4.5 Middle East and Africa Wind Power Flange Sales Breakdown by Type (2017-2022)
2 WIND POWER FLANGE MARKET COMPETITION BY COMPANY
- 2.1 Global Top Players by Wind Power Flange Sales (2017-2022)
- 2.2 Global Top Players by Wind Power Flange Revenue (2017-2022)
- 2.3 Global Top Players by Wind Power Flange Price (2017-2022)
- 2.4 Global Wind Power Flange Top Manufacturers Headquarters
- 2.5 Wind Power Flange Market Competitive Situation and Trends
- 2.5.1 Wind Power Flange Market Concentration Rate (2017-2022)
- 2.5.2 Global 5 Largest Manufacturers by Wind Power Flange Revenue in 2021
- 2.6 Global Top Manufacturers by Company Type (Tier 1, Tier 2, and Tier 3) & (based on the Revenue in Wind Power Flange as of 2021)
- 2.7 Established Date of Wind Power Flange Key Manufacturers
3 WIND POWER FLANGE STATUS AND OUTLOOK BY REGION
- 3.1 Global Wind Power Flange Market Size and CAGR by Region: 2017 VS 2022 VS 2028
- 3.2 Global Wind Power Flange Historic Market Size by Region
- 3.2.1 Global Wind Power Flange Sales in Volume by Region (2017-2022)
- 3.2.2 Global Wind Power Flange Sales in Value by Region (2017-2022)
- 3.3 Global Wind Power Flange Forecasted Market Size by Region
- 3.3.1 Global Wind Power Flange Sales in Volume by Region (2023-2028)
- 3.3.2 Global Wind Power Flange Sales in Value by Region (2023-2028)
4 WIND POWER FLANGE BY APPLICATION
- 4.1 Wind Power Flange Market Segment by Application
- 4.1.1 Onshore Wind Power
- 4.1.2 Offshore Wind Power
- 4.2 Global Wind Power Flange Market Size by Application
- 4.2.1 Global Wind Power Flange Market Size Overview by Application (2017-2028)
- 4.2.2 Global Wind Power Flange Sales Breakdown in Volume, by Application (2017-2022)
- 4.2.3 Global Wind Power Flange Sales Breakdown in Volume by Application (2023-2028)
- 4.3 Global Wind Power Flange Market Size by Application
- 4.3.1 Global Wind Power Flange Market Size Overview by Application (2017-2028)
- 4.3.2 Global Wind Power Flange Sales Breakdown in Volume, by Application (2017-2022)
- 4.3.3 Global Wind Power Flange Sales Breakdown in Volume by Application (2023-2028)
5 NORTH AMERICA WIND POWER FLANGE BY COUNTRY
- 5.1 North America Wind Power Flange Historic Market Size by Country
- 5.1.1 North America Wind Power Flange Sales in Volume by Country (2017-2022)
- 5.1.2 North America Wind Power Flange Sales in Value by Country (2017-2022)
- 5.2 North America Wind Power Flange Forecasted Market Size by Country
- 5.2.1 North America Wind Power Flange Sales in Volume by Country (2023-2028)
- 5.2.2 North America Wind Power Flange Sales in Value by Country (2023-2028)
6 EUROPE WIND POWER FLANGE BY COUNTRY
- 6.1 Europe Wind Power Flange Historic Market Size by Country
- 6.1.1 Europe Wind Power Flange Sales in Volume by Country (2017-2022)
- 6.1.2 Europe Wind Power Flange Sales in Value by Country (2017-2022)
- 6.2 Europe Wind Power Flange Forecasted Market Size by Country
- 6.2.1 Europe Wind Power Flange Sales in Volume by Country (2023-2028)
- 6.2.2 Europe Wind Power Flange Sales in Value by Country (2023-2028)
7 ASIA-PACIFIC WIND POWER FLANGE BY REGION
- 7.1 Asia-Pacific Wind Power Flange Historic Market Size by Region
- 7.1.1 Asia-Pacific Wind Power Flange Sales in Volume by Region (2017-2022)
- 7.1.2 Asia-Pacific Wind Power Flange Sales in Value by Region (2017-2022)
- 7.2 Asia-Pacific Wind Power Flange Forecasted Market Size by Region
- 7.2.1 Asia-Pacific Wind Power Flange Sales in Volume by Region (2023-2028)
- 7.2.2 Asia-Pacific Wind Power Flange Sales in Value by Region (2023-2028)
8 LATIN AMERICA WIND POWER FLANGE BY COUNTRY
- 8.1 Latin America Wind Power Flange Historic Market Size by Country
- 8.1.1 Latin America Wind Power Flange Sales in Volume by Country (2017-2022)
- 8.1.2 Latin America Wind Power Flange Sales in Value by Country (2017-2022)
- 8.2 Latin America Wind Power Flange Forecasted Market Size by Country
- 8.2.1 Latin America Wind Power Flange Sales in Volume by Country (2023-2028)
- 8.2.2 Latin America Wind Power Flange Sales in Value by Country (2023-2028)
9 MIDDLE EAST AND AFRICA WIND POWER FLANGE BY COUNTRY
- 9.1 Middle East and Africa Wind Power Flange Historic Market Size by Country
- 9.1.1 Middle East and Africa Wind Power Flange Sales in Volume by Country (2017-2022)
- 9.1.2 Middle East and Africa Wind Power Flange Sales in Value by Country (2017-2022)
- 9.2 Middle East and Africa Wind Power Flange Forecasted Market Size by Country
- 9.2.1 Middle East and Africa Wind Power Flange Sales in Volume by Country (2023-2028)
- 9.2.2 Middle East and Africa Wind Power Flange Sales in Value by Country (2023-2028)
10 COMPANY PROFILES AND KEY FIGURES IN WIND POWER FLANGE BUSINESS
- 10.1 Iraeta
- 10.1.1 Iraeta Corporation Information
- 10.1.2 Iraeta Wind Power Flange Sales, Revenue and Gross Margin (2017-2022)
- 10.1.3 Iraeta Wind Power Flange Products Offered
- 10.2 Hengrun
- 10.2.1 Hengrun Corporation Information
- 10.2.2 Hengrun Wind Power Flange Sales, Revenue and Gross Margin (2017-2022)
- 10.2.3 Hengrun Wind Power Flange Products Offered
- 10.3 Tianbao
- 10.3.1 Tianbao Corporation Information
- 10.3.2 Tianbao Wind Power Flange Sales, Revenue and Gross Margin (2017-2022)
- 10.3.3 Tianbao Wind Power Flange Products Offered
- 10.4 Shuanghuan Group
- 10.4.1 Shuanghuan Group Corporation Information
- 10.4.2 Shuanghuan Group Wind Power Flange Sales, Revenue and Gross Margin (2017-2022)
- 10.4.3 Shuanghuan Group Wind Power Flange Products Offered
- 10.5 Taewoong
- 10.5.1 Taewoong Corporation Information
- 10.5.2 Taewoong Wind Power Flange Sales, Revenue and Gross Margin (2017-2022)
- 10.5.3 Taewoong Wind Power Flange Products Offered
- 10.6 Euskal Forging
- 10.6.1 Euskal Forging Corporation Information
- 10.6.2 Euskal Forging Wind Power Flange Sales, Revenue and Gross Margin (2017-2022)
- 10.6.3 Euskal Forging Wind Power Flange Products Offered
- 10.7 Flanschenwerk Thal
- 10.7.1 Flanschenwerk Thal Corporation Information
- 10.7.2 Flanschenwerk Thal Wind Power Flange Sales, Revenue and Gross Margin (2017-2022)
- 10.7.3 Flanschenwerk Thal Wind Power Flange Products Offered
- 10.8 CAB
- 10.8.1 CAB Corporation Information
- 10.8.2 CAB Wind Power Flange Sales, Revenue and Gross Margin (2017-2022)
- 10.8.3 CAB Wind Power Flange Products Offered
- 10.9 Jinrui
- 10.9.1 Jinrui Corporation Information
- 10.9.2 Jinrui Wind Power Flange Sales, Revenue and Gross Margin (2017-2022)
- 10.9.3 Jinrui Wind Power Flange Products Offered
- 10.10 CHW Forge
- 10.10.1 CHW Forge Corporation Information
- 10.10.2 CHW Forge Wind Power Flange Sales, Revenue and Gross Margin (2017-2022)
- 10.10.3 CHW Forge Wind Power Flange Products Offered
11 UPSTREAM, OPPORTUNITIES, CHALLENGES, RISKS AND INFLUENCES FACTORS ANALYSIS
- 11.1 Wind Power Flange Key Raw Materials
- 11.1.1 Key Raw Materials
- 11.1.2 Key Raw Materials Price
- 11.2 Manufacturing Cost Structure
- 11.2.1 Raw Materials
- 11.2.2 Labor Cost
- 11.2.3 Manufacturing Expenses
- 11.3 Wind Power Flange Industrial Chain Analysis
- 11.4 Market Dynamics
- 11.4.1 Wind Power Flange Market Trends
- 11.4.2 Wind Power Flange Opportunities and Drivers
- 11.4.3 Wind Power Flange Market Challenges
- 11.4.4 Porter's Five Forces Analysis
12 MARKETING STRATEGY ANALYSIS, DISTRIBUTORS
- 12.1 Sales Channel
- 12.2 Wind Power Flange Distributors
- 12.3 Wind Power Flange Downstream Customers
13 RESEARCH FINDINGS AND CONCLUSION
14 APPENDIX
- 14.1 Research Methodology
- 14.1.1 Methodology/Research Approach
- 14.1.1.1 Research Programs/Design
- 14.1.1.2 Market Size Estimation
- 14.1.1.3 Market Breakdown and Data Triangulation
- 14.1.2 Data Source
- 14.1.2.1 Secondary Sources
- 14.1.2.2 Primary Sources
- 14.1.1 Methodology/Research Approach
- 14.2 Author Details
- 14.3 Disclaimer