|
|
市場調査レポート
商品コード
1100555
2-シアノピリジンの世界市場の分析 (2022年)Global 2-Cyanopyridine Market Research Report 2022 |
||||||
|
|
|||||||
|
● お客様のご希望に応じて、既存データの加工や未掲載情報(例:国別セグメント)の追加などの対応が可能です。 詳細はお問い合わせください。 |
|||||||


| 2-シアノピリジンの世界市場の分析 (2022年) |
|
出版日: 2022年07月12日
発行: QYResearch
ページ情報: 英文 123 Pages
納期: 2~3営業日
|
- 全表示
- 概要
- 図表
- 目次
世界の2-シアノピリジンの市場規模は、新型コロナウイルス感染症 (COVID-19) による再調整を経て、2022年に8,974万米ドル、2028年までに9,882万米ドルに達する見通しです。
また、予測期間中 (2022年~2028年) に1.62%のCAGRで成長すると予想されています。
種類別では、工業グレードが2021年に世界市場の84.84%を占め、2028年には8,439万米ドルの規模に達し、2022年から2028年まで1.67%のCAGRで成長すると予測されています。
目次
第1章 2-シアノピリジン:市場概要
- 2-シアノピリジン:製品の概要と範囲
- 種類別のセグメント
- 市場規模・成長率の分析:種類別 (2022年・2028年)
- 医薬品グレード
- 工業グレード
- 用途別のセグメント
- 市場規模・成長率の分析:用途別 (2022年・2028年)
- 農薬
- 医薬品中間体
- 染料中間体
- その他
- 世界市場の成長見通し
- 世界の2-シアノピリジンの収益:推定・予測 (2017年~2028年)
- 世界の2-シアノピリジンの生産能力:推定・予測 (2017年~2028年)
- 世界の2-シアノピリジンの生産:推定・予測 (2017年~2028年)
- 地域別の市場規模
- 世界の2-シアノピリジンの市場規模:推定・予測、地域別 (2017年・2022年・2028年)
- 米国:推定・予測 (2017年~2028年)
- 日本:推定・予測 (2017年~2028年)
- 中国:推定・予測 (2017年~2028年)
- インド:推定・予測 (2017年~2028年)
第2章 メーカー別の市場競争
- 世界の2-シアノピリジンの生産能力・市場シェア:メーカー別 (2017年~2022年)
- 世界の2-シアノピリジンの収益・市場シェア:メーカー別 (2017年~2022年)
- 市場シェア:企業の種類別 (ティア1、ティア2、ティア3)
- 世界の2-シアノピリジンの平均価格:メーカー別 (2017年~2022年)
- 2-シアノピリジンメーカーの製造拠点・提供エリア・製品種類
- 2-シアノピリジン市場の競争状況と動向
第3章 地域別の生産能力
- 世界の2-シアノピリジンの生産能力・市場シェア:地域別 (2017年~2022年)
- 世界の2-シアノピリジンの収益・市場シェア:地域別 (2017年~2022年)
- 世界の2-シアノピリジンの生産能力・収益・価格・粗利益 (2017年~2022年)
- 米国の2-シアノピリジンの生産
- 日本の2-シアノピリジンの生産
- 中国の2-シアノピリジンの生産 (2017年~2022年)
- インドの2-シアノピリジンの生産 (2017年~2022年)
第4章 2-シアノピリジン:地域別の消費
- 世界の2-シアノピリジンの消費:地域別
- 消費:地域別
- 消費・市場シェア:地域別
- 北米
- 米国
- カナダ
- メキシコ
- 欧州
- ドイツ
- フランス
- 英国
- イタリア
- ロシア
- アジア太平洋
- 中国
- 日本
- 韓国
- 東南アジア
- インド
- オーストラリア
- 南米
- ブラジル
- アルゼンチン
第5章 種類別のセグメント
- 2-シアノピリジンの生産・市場シェア:種類別 (2017年~2022年)
- 2-シアノピリジンの収益・市場シェア:種類別 (2017年~2022年)
- 2-シアノピリジンの価格:種類別 (2017年~2022年)
第6章 用途別のセグメント
- 2-シアノピリジンの生産・市場シェア:用途別 (2017年~2022年)
- 2-シアノピリジンの収益・市場シェア:用途別 (2017年~2022年)
- 2-シアノピリジンの価格:用途別 (2017年~2022年)
第7章 主要企業のプロファイル
- NANTONG ACETIC ACID CHEMICAL
- 企業情報
- 製品ポートフォリオ
- 生産能力・収益・価格・粗利益 (2017年~2022年)
- 主要事業・市場
- KOEI CHEMICAL
- VERTELLUS
- JUBILANT INGREVIA
- HEBEI YANUO CHEMICAL
第8章 2-シアノピリジンの製造コストの分析
- 2-シアノピリジンの主要原材料の分析
- 製造コストの構造比率
- 2-シアノピリジンの製造プロセスの分析
- 2-シアノピリジンの産業チェーンの分析
第9章 マーケティングチャネル・流通業者・顧客
- マーケティングチャネル
- 2-シアノピリジンの流通業者の一覧
- 2-シアノピリジンの顧客
第10章 2-シアノピリジン市場:市場力学
- 2-シアノピリジン業界の動向
- 2-シアノピリジン市場の促進要因
- 2-シアノピリジン市場の課題
- 2-シアノピリジン市場の抑制要因
第11章 生産・供給予測
- 世界の2-シアノピリジンの生産予測:地域別 (2023年~2028年)
- 米国:生産・収益予測 (2023年~2028年)
- 日本:生産・収益予測 (2023年~2028年)
- 中国:生産・収益予測 (2023年~2028年)
- インド:生産・収益予測 (2023年~2028年)
第12章 消費・需要予測
- 世界の2-シアノピリジンの予測・需要分析
- 北米:消費予測、国別
- 欧州:消費予測、国別
- アジア太平洋:消費予測、地域別
- ラテンアメリカ:消費予測、国別
- 中東・アフリカ:消費予測、国別
第13章 種類別・用途別の予測
- 世界の生産・収益・価格予測:種類別 (2023年~2028年)
- 世界の生産・収益・価格予測:用途別 (2023年~2028年)
第14章 調査結果と結論
第15章 調査手法とデータソース
LIST OF TABLES
- Table 1. Global 2-Cyanopyridine Market Size by Type (MT) & (US$ Million) & (2022 VS 2028)
- Table 2. Global 2-Cyanopyridine Market Size by Application (MT) & (US$ Million) & (2022 VS 2028)
- Table 3. 2-Cyanopyridine Market Size Comparison by Region: 2017 VS 2022 VS 2028 (US$ Million)
- Table 4. Global 2-Cyanopyridine Production Capacity (MT) by Manufacturers in 2021
- Table 5. Global 2-Cyanopyridine Production by Manufacturers (2017-2022) & (MT)
- Table 6. Global 2-Cyanopyridine Production Market Share by Manufacturers (2017-2022)
- Table 7. Global 2-Cyanopyridine Revenue by Manufacturers (2017-2022) & (US$ Million)
- Table 8. Global 2-Cyanopyridine Revenue Share by Manufacturers (2017-2022)
- Table 9. Company Type (Tier 1, Tier 2, and Tier 3) & (based on the Revenue in 2-Cyanopyridine as of 2021)
- Table 10. Global Market 2-Cyanopyridine Average Price (US$/MT) of Key Manufacturers (2017-2022)
- Table 11. Manufacturers 2-Cyanopyridine Production Sites and Area Served
- Table 12. Manufacturers 2-Cyanopyridine Product Type
- Table 13. Global 2-Cyanopyridine Production Capacity (MT) by Region (2017-2022)
- Table 14. Global 2-Cyanopyridine Production (MT) by Region (2017-2022)
- Table 15. Global 2-Cyanopyridine Production Market Share by Region (2017-2022)
- Table 16. Global 2-Cyanopyridine Revenue (US$ Million) by Region (2017-2022)
- Table 17. Global 2-Cyanopyridine Revenue Market Share by Region (2017-2022)
- Table 18. Global 2-Cyanopyridine Production Capacity (MT), Revenue (US$ Million), Price (US$/MT) and Gross Margin (2017-2022)
- Table 19. USA 2-Cyanopyridine Production Capacity (MT), Revenue (US$ Million), Price (US$/MT) and Gross Margin (2017-2022)
- Table 20. Japan 2-Cyanopyridine Production Capacity (MT), Revenue (US$ Million), Price (US$/MT) and Gross Margin (2017-2022)
- Table 21. China 2-Cyanopyridine Production Capacity (MT), Revenue (US$ Million), Price (US$/MT) and Gross Margin (2017-2022)
- Table 22. India 2-Cyanopyridine Production Capacity (MT), Revenue (US$ Million), Price (US$/MT) and Gross Margin (2017-2022)
- Table 23. Global 2-Cyanopyridine Consumption by Region (2017-2022) & (MT)
- Table 24. Global 2-Cyanopyridine Consumption Market Share by Region (2017-2022)
- Table 25. North America 2-Cyanopyridine Consumption by Country (2017-2022) & (MT)
- Table 26. Europe 2-Cyanopyridine Consumption by Country (2017-2022) & (MT)
- Table 27. Asia Pacific 2-Cyanopyridine Consumption by Region (2017-2022) & (MT)
- Table 28. South America 2-Cyanopyridine Consumption by Country (2017-2022) & (MT)
- Table 29. Global 2-Cyanopyridine Production (MT) by Type (2017-2022)
- Table 30. Global 2-Cyanopyridine Production Market Share by Type (2017-2022)
- Table 31. Global 2-Cyanopyridine Revenue (US$ Million) by Type (2017-2022)
- Table 32. Global 2-Cyanopyridine Revenue Share by Type (2017-2022)
- Table 33. Global 2-Cyanopyridine Price (US$/MT) by Type (2017-2022)
- Table 34. Global 2-Cyanopyridine Production (MT) by Application (2017-2022)
- Table 35. Global 2-Cyanopyridine Production Market Share by Application (2017-2022)
- Table 36. Global 2-Cyanopyridine Revenue (US$ Million) by Application (2017-2022)
- Table 37. Global 2-Cyanopyridine Revenue Share by Application (2017-2022)
- Table 38. Global 2-Cyanopyridine Price (US$/MT) by Application (2017-2022)
- Table 39. Nantong Acetic Acid Chemical 2-Cyanopyridine Corporation Information
- Table 40. Nantong Acetic Acid Chemical 2-Cyanopyridine Specification and Application
- Table 41. Nantong Acetic Acid Chemical 2-Cyanopyridine Production Capacity (MT), Revenue (US$ Million), Price (US$/MT) and Gross Margin (2017-2022)
- Table 42. Koei Chemical 2-Cyanopyridine Corporation Information
- Table 43. Koei Chemical 2-Cyanopyridine Specification and Application
- Table 44. Koei Chemical 2-Cyanopyridine Production Capacity (MT), Revenue (US$ Million), Price (US$/MT) and Gross Margin (2017-2022)
- Table 45. Koei Chemical Recent Developments/Updates
- Table 46. Vertellus 2-Cyanopyridine Corporation Information
- Table 47. Vertellus 2-Cyanopyridine Specification and Application
- Table 48. Vertellus 2-Cyanopyridine Production Capacity (MT), Revenue (US$ Million), Price (US$/MT) and Gross Margin (2017-2022)
- Table 49. Vertellus Recent Developments/Updates
- Table 50. Jubilant Ingrevia 2-Cyanopyridine Corporation Information
- Table 51. Jubilant Ingrevia 2-Cyanopyridine Specification and Application
- Table 52. Jubilant Ingrevia 2-Cyanopyridine Production Capacity (MT), Revenue (US$ Million), Price (US$/MT) and Gross Margin (2017-2022)
- Table 53. Jubilant Ingrevia Recent Developments/Updates
- Table 54. Hebei Yanuo Chemical 2-Cyanopyridine Corporation Information
- Table 55. Hebei Yanuo Chemical 2-Cyanopyridine Specification and Application
- Table 56. Hebei Yanuo Chemical 2-Cyanopyridine Production Capacity (MT), Revenue (US$ Million), Price (US$/MT) and Gross Margin (2017-2022)
- Table 57. Production Base and Market Concentration Rate of Raw Material
- Table 58. Key Suppliers of Raw Materials
- Table 59. 2-Cyanopyridine Distributors List
- Table 60. 2-Cyanopyridine Customers List
- Table 61. 2-Cyanopyridine Market Trends
- Table 62. 2-Cyanopyridine Market Drivers
- Table 63. 2-Cyanopyridine Market Challenges
- Table 64. Global 2-Cyanopyridine Production (MT) Forecast by Region (2023-2028)
- Table 65. Global 2-Cyanopyridine Production Market Share Forecast by Region (2023-2028)
- Table 66. Global Forecasted Demand Analysis of 2-Cyanopyridine by Region (2023-2028) & (MT)
- Table 67. North America 2-Cyanopyridine Consumption Forecast by Country (2023-2028) & (MT)
- Table 68. Europe 2-Cyanopyridine Consumption Forecast by Country (2023-2028) & (MT)
- Table 69. Asia Pacific 2-Cyanopyridine Consumption Forecast by Region (2023-2028) & (MT)
- Table 70. South America 2-Cyanopyridine Consumption Forecast by Country (2023-2028) & (MT)
- Table 71. Global 2-Cyanopyridine Production Forecast by Type (2023-2028) & (MT)
- Table 72. Global 2-Cyanopyridine Production Market Share Forecast by Type (2023-2028)
- Table 73. Global 2-Cyanopyridine Revenue Forecast by Type (2023-2028) & (US$ Million)
- Table 74. Global 2-Cyanopyridine Revenue Market Share Forecast by Type (2023-2028)
- Table 75. Global 2-Cyanopyridine Price Forecast by Type (2023-2028) & (US$/MT)
- Table 76. Global 2-Cyanopyridine Production Forecast by Application (2023-2028) & (MT)
- Table 77. Global 2-Cyanopyridine Production Market Share Forecast by Application (2023-2028)
- Table 78. Global 2-Cyanopyridine Revenue Forecast by Application (2023-2028) & (US$ Million)
- Table 79. Global 2-Cyanopyridine Revenue Market Share Forecast by Application (2023-2028)
- Table 80. Global 2-Cyanopyridine Price Forecast by Application (2023-2028) & (US$/MT)
- Table 81. Research Programs/Design for This Report
- Table 82. Key Data Information from Secondary Sources
- Table 83. Key Data Information from Primary Sources
List of Figures
- Figure 1. Product Picture of 2-Cyanopyridine
- Figure 2. Global 2-Cyanopyridine Market Share by Type: 2022 VS 2028
- Figure 3. Global 2-Cyanopyridine Market Share by Application: 2022 VS 2028
- Figure 4. Pesticides
- Figure 5. Pharmaceutical Intermediates
- Figure 6. Dye Intermediates
- Figure 7. Global 2-Cyanopyridine Revenue (US$ Million), 2017 VS 2022 VS 2028
- Figure 8. Global 2-Cyanopyridine Revenue (US$ Million) (2017-2028)
- Figure 9. Global 2-Cyanopyridine Production Capacity (MT) & (2017-2028)
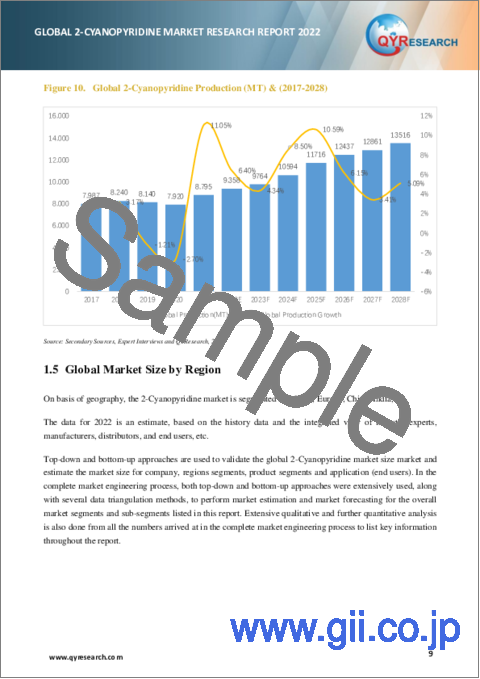
- Figure 10. Global 2-Cyanopyridine Production (MT) & (2017-2028)
- Figure 11. USA 2-Cyanopyridine Revenue (US$ Million) Growth Rate (2017-2028)
- Figure 12. Japan 2-Cyanopyridine Revenue (US$ Million) Growth Rate (2017-2028)
- Figure 13. China 2-Cyanopyridine Revenue (US$ Million) Growth Rate (2017-2028)
- Figure 14. India 2-Cyanopyridine Revenue (US$ Million) Growth Rate (2017-2028)
- Figure 15. 2-Cyanopyridine Production Share by Manufacturers in 2021
- Figure 16. Global 2-Cyanopyridine Revenue Share by Manufacturers in 2021
- Figure 17. The Global 3 Largest Players: Market Share by 2-Cyanopyridine Revenue in 2021
- Figure 18. USA 2-Cyanopyridine Production (MT) Growth Rate (2017-2022)
- Figure 19. Japan 2-Cyanopyridine Production (MT) Growth Rate (2017-2022)
- Figure 20. China 2-Cyanopyridine Production (MT) Growth Rate (2017-2022)
- Figure 21. India 2-Cyanopyridine Production (MT) Growth Rate (2017-2022)
- Figure 22. Global 2-Cyanopyridine Consumption Market Share by Region (2017-2022)
- Figure 23. North America 2-Cyanopyridine Consumption and Growth Rate (2017-2022) & (MT)
- Figure 24. North America 2-Cyanopyridine Consumption Market Share by Country in 2021
- Figure 25. U.S. 2-Cyanopyridine Consumption and Growth Rate (2017-2022) & (MT)
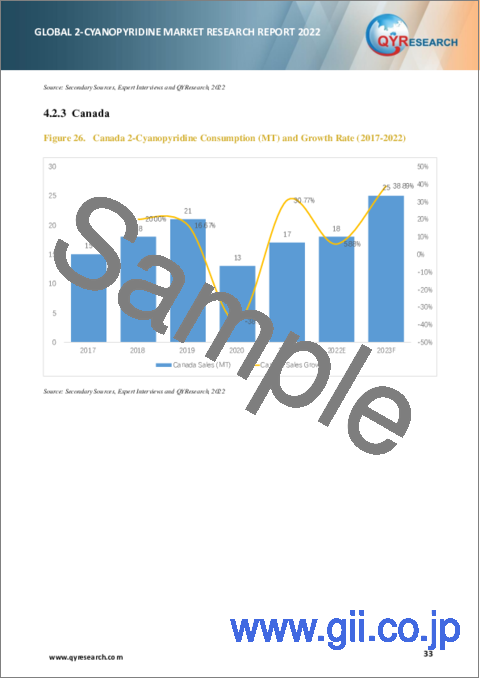
- Figure 26. Canada 2-Cyanopyridine Consumption (MT) and Growth Rate (2017-2022)
- Figure 27. Mexico 2-Cyanopyridine Consumption and Growth Rate (2017-2022) & (MT)
- Figure 28. Europe 2-Cyanopyridine Consumption and Growth Rate (2017-2022) & (MT)
- Figure 29. Europe 2-Cyanopyridine Consumption Market Share by Country in 2021
- Figure 30. Germany 2-Cyanopyridine Consumption and Growth Rate (2017-2022) & (MT)
- Figure 31. France 2-Cyanopyridine Consumption and Growth Rate (2017-2022) & (MT)
- Figure 32. U.K. 2-Cyanopyridine Consumption and Growth Rate (2017-2022) & (MT)
- Figure 33. Italy 2-Cyanopyridine Consumption and Growth Rate (2017-2022) & (MT)
- Figure 34. Russia 2-Cyanopyridine Consumption and Growth Rate (2017-2022) & (MT)
- Figure 35. Asia Pacific 2-Cyanopyridine Consumption and Growth Rate (MT)
- Figure 36. Asia Pacific 2-Cyanopyridine Consumption Market Share by Region in 2021
- Figure 37. China 2-Cyanopyridine Consumption and Growth Rate (2017-2022) & (MT)
- Figure 38. Japan 2-Cyanopyridine Consumption and Growth Rate (2017-2022) & (MT)
- Figure 39. South Korea 2-Cyanopyridine Consumption and Growth Rate (2017-2022) & (MT)
- Figure 40. Southeast Asia 2-Cyanopyridine Consumption and Growth Rate (2017-2022) & (MT)
- Figure 41. India 2-Cyanopyridine Consumption and Growth Rate (2017-2022) & (MT)
- Figure 42. Australia 2-Cyanopyridine Consumption and Growth Rate (2017-2022) & (MT)
- Figure 43. South America 2-Cyanopyridine Consumption and Growth Rate (MT)
- Figure 44. South America 2-Cyanopyridine Consumption Market Share by Country in 2021
- Figure 45. Brazil 2-Cyanopyridine Consumption and Growth Rate (2017-2022) & (MT)
- Figure 46. Argentina 2-Cyanopyridine Consumption and Growth Rate (2017-2022) & (MT)
- Figure 47. Production Market Share of 2-Cyanopyridine by Type (2017-2022)
- Figure 48. Production Market Share of 2-Cyanopyridine by Type in 2021
- Figure 49. Revenue Share of 2-Cyanopyridine by Type (2017-2022)
- Figure 50. Revenue Market Share of 2-Cyanopyridine by Type in 2021
- Figure 51. Production Market Share of 2-Cyanopyridine by Application (2017-2022)
- Figure 52. Production Market Share of 2-Cyanopyridine by Application in 2021
- Figure 53. Revenue Share of 2-Cyanopyridine by Application (2017-2022)
- Figure 54. Revenue Market Share of 2-Cyanopyridine by Application in 2021
- Figure 55. Manufacturing Cost Structure of 2-Cyanopyridine
- Figure 56. Manufacturing Process Analysis of 2-Cyanopyridine
- Figure 57. 2-Cyanopyridine Industrial Chain Analysis
- Figure 58. Channels of Distribution
- Figure 59. Distributors Profiles
- Figure 60. Global Chemical Industry Market Share
- Figure 61. USA 2-Cyanopyridine Production (MT) Growth Rate Forecast (2023-2028)
- Figure 62. USA 2-Cyanopyridine Revenue (US$ Million) Growth Rate Forecast (2023-2028)
- Figure 63. Japan 2-Cyanopyridine Production (MT) Growth Rate Forecast (2023-2028)
- Figure 64. Japan 2-Cyanopyridine Revenue (US$ Million) Growth Rate Forecast (2023-2028)
- Figure 65. China 2-Cyanopyridine Production (MT) Growth Rate Forecast (2023-2028)
- Figure 66. China 2-Cyanopyridine Revenue (US$ Million) Growth Rate Forecast (2023-2028)
- Figure 67. India 2-Cyanopyridine Production (MT) Growth Rate Forecast (2023-2028)
- Figure 68. India 2-Cyanopyridine Revenue (US$ Million) Growth Rate Forecast (2023-2028)
- Figure 69. Bottom-up and Top-down Approaches for This Report
- Figure 70. Data Triangulation 103
Due to the COVID-19 pandemic, the global 2-Cyanopyridine market size is estimated to be worth US$ 89.74 million in 2022 and is forecast to a readjusted size of US$ 98.82 million by 2028 with a CAGR of 1.62% during the forecast period 2022-2028. Fully considering the economic change by this health crisis, Industrial Grade accounting for 84.84% of the 2-Cyanopyridine global market in 2021, is projected to value US$ 84.39 million by 2028, growing at a revised 1.67% CAGR from 2022 to 2028.
The global major manufacturers of 2-Cyanopyridine include Nantong Acetic Acid Chemical, Koei Chemical, Vertellus, Jubilant Ingrevia, Hebei Yanuo Chemical, and etc. In terms of revenue, the global three largest players hold a 78.05% market share of 2-Cyanopyridine in 2021.
Drivers and Restrains:
The research report has incorporated the analysis of different factors that augment the market's growth. It constitutes trends, restraints, and drivers that transform the market in either a positive or negative manner. This section also provides the scope of different segments and applications that can potentially influence the market in the future. The detailed information is based on current trends and historic milestones. This section also provides an analysis of the volume of production about the global market and about each type from 2017 to 2028. This section mentions the volume of production by region from 2017 to 2028. Pricing analysis is included in the report according to each type from the year 2017 to 2028, manufacturer from 2017 to 2022, region from 2017 to 2022, and global price from 2017 to 2028.
A thorough evaluation of the restrains included in the report portrays the contrast to drivers and gives room for strategic planning. Factors that overshadow the market growth are pivotal as they can be understood to devise different bends for getting hold of the lucrative opportunities that are present in the ever-growing market. Additionally, insights into market expert's opinions have been taken to understand the market better.
Segment Analysis:
The research report includes specific segments by region (country), by manufacturers, by Type and by Application. Each type provides information about the production during the forecast period of 2017 to 2028. by Application segment also provides consumption during the forecast period of 2017 to 2028. Understanding the segments helps in identifying the importance of different factors that aid the market growth.
By Company
- Nantong Acetic Acid Chemical
- Koei Chemical
- Vertellus
- Jubilant Ingrevia
- Hebei Yanuo Chemical
Segment by Type
- Pharmaceutical Grade
- Industrial Grade
Segment by Application
- Pesticides
- Pharmaceutical Intermediates
- Dye Intermediates
- Others
Production by Region
- China
- Japan
- USA
- India
Consumption by Region
- North America
- U.S.
- Canada
- Mexico
- Asia-Pacific
- China
- Japan
- South Korea
- China Taiwan
- Southeast Asia
- India
- Australia
- Europe
- Germany
- France
- U.K.
- Italy
- Russia
- Rest of Europe
- South America
- Brazil
- Argentina
- Rest of South America
TABLE OF CONTENTS
1 2-CYANOPYRIDINE MARKET OVERVIEW
- 1.1 PRODUCT OVERVIEW AND SCOPE OF 2-CYANOPYRIDINE
- 1.2 2-CYANOPYRIDINE SEGMENT BY TYPE
- 1.2.1 GLOBAL 2-CYANOPYRIDINE MARKET SIZE GROWTH RATE ANALYSIS BY TYPE: 2022 VS 2028
- 1.2.2 PHARMACEUTICAL GRADE
- 1.2.3 INDUSTRIAL GRADE
- 1.3 2-CYANOPYRIDINE SEGMENT BY APPLICATION
- 1.3.1 GLOBAL 2-CYANOPYRIDINE MARKET SIZE GROWTH RATE ANALYSIS BY APPLICATION: 2022 VS 2028
- 1.3.2 PESTICIDES
- 1.3.3 PHARMACEUTICAL INTERMEDIATES
- 1.3.4 DYE INTERMEDIATES
- 1.3.5 OTHERS
- 1.4 GLOBAL MARKET GROWTH PROSPECTS
- 1.4.1 GLOBAL 2-CYANOPYRIDINE REVENUE ESTIMATES AND FORECASTS (2017-2028)
- 1.4.2 GLOBAL 2-CYANOPYRIDINE PRODUCTION CAPACITY ESTIMATES AND FORECASTS (2017-2028)
- 1.4.3 GLOBAL 2-CYANOPYRIDINE PRODUCTION ESTIMATES AND FORECASTS (2017-2028)
- 1.5 GLOBAL MARKET SIZE BY REGION
- 1.5.1 GLOBAL 2-CYANOPYRIDINE MARKET SIZE ESTIMATES AND FORECASTS BY REGION: 2017 VS 2022 VS 2028
- 1.5.2 USA 2-CYANOPYRIDINE ESTIMATES AND FORECASTS (2017-2028)
- 1.5.3 JAPAN 2-CYANOPYRIDINE ESTIMATES AND FORECASTS (2017-2028)
- 1.5.4 CHINA 2-CYANOPYRIDINE ESTIMATES AND FORECASTS (2017-2028)
- 1.5.5 INDIA 2-CYANOPYRIDINE ESTIMATES AND FORECASTS (2017-2028)
2 MARKET COMPETITION BY MANUFACTURERS
- 2.1 GLOBAL 2-CYANOPYRIDINE PRODUCTION CAPACITY MARKET SHARE BY MANUFACTURERS (2017-2022)
- 2.2 GLOBAL 2-CYANOPYRIDINE REVENUE MARKET SHARE BY MANUFACTURERS (2017-2022)
- 2.3 2-CYANOPYRIDINE MARKET SHARE BY COMPANY TYPE (TIER 1, TIER 2, AND TIER 3)
- 2.4 GLOBAL 2-CYANOPYRIDINE AVERAGE PRICE BY MANUFACTURERS (2017-2022)
- 2.5 MANUFACTURERS 2-CYANOPYRIDINE PRODUCTION SITES, AREA SERVED, PRODUCT TYPE
- 2.6 2-CYANOPYRIDINE MARKET COMPETITIVE SITUATION AND TRENDS
- 2.6.1 2-CYANOPYRIDINE MARKET CONCENTRATION RATE
- 2.6.2 GLOBAL 3 LARGEST 2-CYANOPYRIDINE PLAYERS MARKET SHARE BY REVENUE
3 PRODUCTION CAPACITY BY REGION
- 3.1 GLOBAL PRODUCTION CAPACITY OF 2-CYANOPYRIDINE MARKET SHARE BY REGION (2017-2022)
- 3.2 GLOBAL 2-CYANOPYRIDINE REVENUE MARKET SHARE BY REGION (2017-2022)
- 3.3 GLOBAL 2-CYANOPYRIDINE PRODUCTION CAPACITY, REVENUE, PRICE AND GROSS MARGIN (2017-2022)
- 3.4 USA 2-CYANOPYRIDINE PRODUCTION
- 3.4.1 USA 2-CYANOPYRIDINE PRODUCTION GROWTH RATE (2017-2022)
- 3.4.2 USA 2-CYANOPYRIDINE PRODUCTION CAPACITY, REVENUE, PRICE AND GROSS MARGIN (2017-2022)
- 3.5 JAPAN 2-CYANOPYRIDINE PRODUCTION
- 3.5.1 JAPAN 2-CYANOPYRIDINE PRODUCTION GROWTH RATE (2017-2022)
- 3.5.2 JAPAN 2-CYANOPYRIDINE PRODUCTION CAPACITY, REVENUE, PRICE AND GROSS MARGIN (2017-2022)
- 3.6 CHINA 2-CYANOPYRIDINE PRODUCTION (2017-2022)
- 3.6.1 CHINA 2-CYANOPYRIDINE PRODUCTION GROWTH RATE (2017-2022)
- 3.6.2 CHINA 2-CYANOPYRIDINE PRODUCTION CAPACITY, REVENUE, PRICE AND GROSS MARGIN (2017-2022)
- 3.7 INDIA 2-CYANOPYRIDINE PRODUCTION (2017-2022)
- 3.7.1 INDIA 2-CYANOPYRIDINE PRODUCTION GROWTH RATE (2017-2022)
- 3.7.2 INDIA 2-CYANOPYRIDINE PRODUCTION CAPACITY, REVENUE, PRICE AND GROSS MARGIN (2017-2022)
4 2-CYANOPYRIDINE CONSUMPTION BY REGION
- 4.1 GLOBAL 2-CYANOPYRIDINE CONSUMPTION BY REGION
- 4.1.1 GLOBAL 2-CYANOPYRIDINE CONSUMPTION BY REGION
- 4.1.2 GLOBAL 2-CYANOPYRIDINE CONSUMPTION MARKET SHARE BY REGION
- 4.2 NORTH AMERICA
- 4.2.1 NORTH AMERICA 2-CYANOPYRIDINE CONSUMPTION BY COUNTRY
- 4.2.2 U.S.
- 4.2.3 CANADA
- 4.2.4 MEXICO
- 4.3 EUROPE
- 4.3.1 EUROPE 2-CYANOPYRIDINE CONSUMPTION BY COUNTRY
- 4.3.2 GERMANY
- 4.3.3 FRANCE
- 4.3.4 U.K.
- 4.3.5 ITALY
- 4.3.6 RUSSIA
- 4.4 ASIA PACIFIC
- 4.4.1 ASIA PACIFIC 2-CYANOPYRIDINE CONSUMPTION BY REGION
- 4.4.2 CHINA
- 4.4.3 JAPAN
- 4.4.4 SOUTH KOREA
- 4.4.5 SOUTHEAST ASIA
- 4.4.6 INDIA
- 4.4.7 AUSTRALIA
- 4.5 SOUTH AMERICA
- 4.5.1 SOUTH AMERICA 2-CYANOPYRIDINE CONSUMPTION BY COUNTRY
- 4.5.2 BRAZIL
- 4.5.3 ARGENTINA
5 SEGMENT BY TYPE
- 5.1 GLOBAL 2-CYANOPYRIDINE PRODUCTION MARKET SHARE BY TYPE (2017-2022)
- 5.2 GLOBAL 2-CYANOPYRIDINE REVENUE MARKET SHARE BY TYPE (2017-2022)
- 5.3 GLOBAL 2-CYANOPYRIDINE PRICE BY TYPE (2017-2022)
6 SEGMENT BY APPLICATION
- 6.1 GLOBAL 2-CYANOPYRIDINE PRODUCTION MARKET SHARE BY APPLICATION (2017-2022)
- 6.2 GLOBAL 2-CYANOPYRIDINE REVENUE MARKET SHARE BY APPLICATION (2017-2022)
- 6.3 GLOBAL 2-CYANOPYRIDINE PRICE BY APPLICATION (2017-2022)
7 KEY COMPANIES PROFILED
- 7.1 NANTONG ACETIC ACID CHEMICAL
- 7.1.1 NANTONG ACETIC ACID CHEMICAL 2-CYANOPYRIDINE CORPORATION INFORMATION
- 7.1.2 NANTONG ACETIC ACID CHEMICAL 2-CYANOPYRIDINE PRODUCT PORTFOLIO
- 7.1.3 NANTONG ACETIC ACID CHEMICAL 2-CYANOPYRIDINE PRODUCTION CAPACITY, REVENUE, PRICE AND GROSS MARGIN (2017-2022)
- 7.1.4 NANTONG ACETIC ACID CHEMICAL MAIN BUSINESS AND MARKETS SERVED
- 7.2 KOEI CHEMICAL
- 7.2.1 KOEI CHEMICAL 2-CYANOPYRIDINE CORPORATION INFORMATION
- 7.2.2 KOEI CHEMICAL 2-CYANOPYRIDINE PRODUCT PORTFOLIO
- 7.2.3 KOEI CHEMICAL 2-CYANOPYRIDINE PRODUCTION CAPACITY, REVENUE, PRICE AND GROSS MARGIN (2017-2022)
- 7.2.4 KOEI CHEMICAL MAIN BUSINESS AND MARKETS SERVED
- 7.2.5 KOEI CHEMICAL RECENT DEVELOPMENTS/UPDATES
- 7.3 VERTELLUS
- 7.3.1 VERTELLUS 2-CYANOPYRIDINE CORPORATION INFORMATION
- 7.3.2 VERTELLUS 2-CYANOPYRIDINE PRODUCT PORTFOLIO
- 7.3.3 VERTELLUS 2-CYANOPYRIDINE PRODUCTION CAPACITY, REVENUE, PRICE AND GROSS MARGIN (2017-2022)
- 7.3.4 VERTELLUS MAIN BUSINESS AND MARKETS SERVED
- 7.3.5 VERTELLUS RECENT DEVELOPMENTS/UPDATES
- 7.4 JUBILANT INGREVIA
- 7.4.1 JUBILANT INGREVIA 2-CYANOPYRIDINE CORPORATION INFORMATION
- 7.4.2 JUBILANT INGREVIA 2-CYANOPYRIDINE PRODUCT PORTFOLIO
- 7.4.3 JUBILANT INGREVIA 2-CYANOPYRIDINE PRODUCTION CAPACITY, REVENUE, PRICE AND GROSS MARGIN (2017-2022)
- 7.4.4 JUBILANT INGREVIA MAIN BUSINESS AND MARKETS SERVED
- 7.4.5 JUBILANT INGREVIA RECENT DEVELOPMENTS/UPDATES
- 7.5 HEBEI YANUO CHEMICAL
- 7.5.1 HEBEI YANUO CHEMICAL 2-CYANOPYRIDINE CORPORATION INFORMATION
- 7.5.2 HEBEI YANUO CHEMICAL 2-CYANOPYRIDINE PRODUCT PORTFOLIO
- 7.5.3 HEBEI YANUO CHEMICAL 2-CYANOPYRIDINE PRODUCTION CAPACITY, REVENUE, PRICE AND GROSS MARGIN (2017-2022)
- 7.5.4 HEBEI YANUO CHEMICAL MAIN BUSINESS AND MARKETS SERVED
8 2-CYANOPYRIDINE MANUFACTURING COST ANALYSIS
- 8.1 2-CYANOPYRIDINE KEY RAW MATERIALS ANALYSIS
- 8.1.1 KEY RAW MATERIALS
- 8.1.2 KEY SUPPLIERS OF RAW MATERIALS
- 8.2 PROPORTION OF MANUFACTURING COST STRUCTURE
- 8.3 MANUFACTURING PROCESS ANALYSIS OF 2-CYANOPYRIDINE
- 8.4 2-CYANOPYRIDINE INDUSTRIAL CHAIN ANALYSIS
9 MARKETING CHANNEL, DISTRIBUTORS AND CUSTOMERS
- 9.1 MARKETING CHANNEL
- 9.2 2-CYANOPYRIDINE DISTRIBUTORS LIST
- 9.3 2-CYANOPYRIDINE CUSTOMERS
10 2-CYANOPYRIDINE MARKET DYNAMICS
- 10.1 2-CYANOPYRIDINE INDUSTRY TRENDS
- 10.2 2-CYANOPYRIDINE MARKET DRIVERS
- 10.3 2-CYANOPYRIDINE MARKET CHALLENGES AND RESTRAINTS
11 PRODUCTION AND SUPPLY FORECAST
- 11.1 GLOBAL FORECASTED PRODUCTION OF 2-CYANOPYRIDINE BY REGION (2023-2028)
- 11.2 USA 2-CYANOPYRIDINE PRODUCTION, REVENUE FORECAST (2023-2028)
- 11.3 JAPAN 2-CYANOPYRIDINE PRODUCTION, REVENUE FORECAST (2023-2028)
- 11.4 CHINA 2-CYANOPYRIDINE PRODUCTION, REVENUE FORECAST (2023-2028)
- 11.5 INDIA 2-CYANOPYRIDINE PRODUCTION, REVENUE FORECAST (2023-2028)
12 CONSUMPTION AND DEMAND FORECAST
- 12.1 GLOBAL FORECASTED DEMAND ANALYSIS OF 2-CYANOPYRIDINE BY REGION
- 12.2 NORTH AMERICA FORECASTED CONSUMPTION OF 2-CYANOPYRIDINE BY COUNTRY
- 12.3 EUROPE MARKET FORECASTED CONSUMPTION OF 2-CYANOPYRIDINE BY COUNTRY
- 12.4 ASIA PACIFIC MARKET FORECASTED CONSUMPTION OF 2-CYANOPYRIDINE BY REGION
- 12.5 SOUTH AMERICA FORECASTED CONSUMPTION OF 2-CYANOPYRIDINE BY COUNTRY
13 FORECAST BY TYPE AND BY APPLICATION
- 13.1 GLOBAL PRODUCTION, REVENUE AND PRICE FORECAST BY TYPE (2023-2028)
- 13.1.1 GLOBAL FORECASTED PRODUCTION OF 2-CYANOPYRIDINE BY TYPE (2023-2028)
- 13.1.2 GLOBAL FORECASTED REVENUE OF 2-CYANOPYRIDINE BY TYPE (2023-2028)
- 13.1.3 GLOBAL FORECASTED PRICE OF 2-CYANOPYRIDINE BY TYPE (2023-2028)
- 13.2 GLOBAL PRODUCTION, REVENUE AND PRICE FORECAST BY APPLICATION (2023-2028)
- 13.2.1 GLOBAL FORECASTED PRODUCTION OF 2-CYANOPYRIDINE BY APPLICATION (2023-2028)
- 13.2.2 GLOBAL FORECASTED REVENUE OF 2-CYANOPYRIDINE BY APPLICATION (2023-2028)
- 13.2.3 GLOBAL FORECASTED PRICE OF 2-CYANOPYRIDINE BY APPLICATION (2023-2028)
14 RESEARCH FINDINGS AND CONCLUSION
15 METHODOLOGY AND DATA SOURCE
- 15.1 METHODOLOGY/RESEARCH APPROACH
- 15.1.1 RESEARCH PROGRAMS/DESIGN
- 15.1.2 MARKET SIZE ESTIMATION
- 15.1.3 MARKET BREAKDOWN AND DATA TRIANGULATION
- 15.2 DATA SOURCE
- 15.2.1 SECONDARY SOURCES
- 15.2.2 PRIMARY SOURCES
- 15.3 AUTHOR LIST
- 15.4 DISCLAIMER