|
|
市場調査レポート
商品コード
1080308
粉末状亜塩素酸ナトリウムの世界市場:分析・沿革・予測 (2017年~2028年)Global Powdered Sodium Chlorite Market Report, History and Forecast 2017-2028 |
||||||
|
|
|||||||
|
● お客様のご希望に応じて、既存データの加工や未掲載情報(例:国別セグメント)の追加などの対応が可能です。 詳細はお問い合わせください。 |
|||||||


| 粉末状亜塩素酸ナトリウムの世界市場:分析・沿革・予測 (2017年~2028年) |
|
出版日: 2022年06月01日
発行: QYResearch
ページ情報: 英文 132 Pages
納期: 2~3営業日
|
- 全表示
- 概要
- 図表
- 目次
世界の粉末状亜塩素酸ナトリウムの市場規模は、新型コロナウイルス感染症 (COVID-19) による再調整を経て、2021年に1億3,097万米ドル、2028年までに1億9,049万米ドルに達すると予測されています。
また、分析期間中に4.65%のCAGRで成長する見通しです。
地域別に見ると、北米の市場規模が2021年に2,705万米ドルに達する一方、中国は2028年に7,172万米ドルに達すると予測されています。
種類別では、80%亜塩素酸ナトリウムが2021年に世界市場の47.13%を占め、COVID-19以後の期間に4.44%のCAGRで成長すると予測されています。用途別では、水処理セグメントが予測期間中に4.73%のCAGRで成長し、2028年には約60.8%のシェアを獲得すると見込まれています。
当レポートでは、世界の粉末状亜塩素酸ナトリウムの市場について分析し、種類別・用途別・地域別 (国別) の市場動向の見通し (2017年~2028年)、主要企業のプロファイルなどについて調査しております。
目次
第1章 粉末状亜塩素酸ナトリウム:市場概要
- 粉末状亜塩素酸ナトリウム:製品概要
- 種類別の市場セグメント
- 80%亜塩素酸ナトリウム
- 82%亜塩素酸ナトリウム
- 90%亜塩素酸ナトリウム
- 78%亜塩素酸ナトリウム
- 種類別の市場規模
- 市場規模の概要:種類別 (2017年~2028年)
- 過去の市場規模:種類別 (2017年~2022年)
- 市場規模の予測:種類別 (2023年~2028年)
- 主要地域の市場規模:種類別
- 北米の粉末状亜塩素酸ナトリウムの販売:種類別 (2017年~2022年)
- 欧州の粉末状亜塩素酸ナトリウムの販売:種類別 (2017年~2022年)
- アジア太平洋の粉末状亜塩素酸ナトリウムの販売:種類別 (2017年~2022年)
- ラテンアメリカの粉末状亜塩素酸ナトリウムの販売:種類別 (2017年~2022年)
- 中東・アフリカの粉末状亜塩素酸ナトリウムの販売:種類別 (2017年~2022年)
第2章 粉末状亜塩素酸ナトリウム:企業別の市場競争
- 世界の粉末状亜塩素酸ナトリウムの主要企業の販売 (2017年~2022年)
- 世界の粉末状亜塩素酸ナトリウムの主要企業の収益 (2017年~2022年)
- 世界の粉末状亜塩素酸ナトリウムの主要企業の価格 (2017年~2022年)
- 世界の粉末状亜塩素酸ナトリウムの主要メーカーの製造拠点・提供エリア・製品種類
- 粉末状亜塩素酸ナトリウム市場の競争状況と動向
- 世界の主要メーカー:企業の種類別 (ティア1、ティア2、ティア3) (収益別、2021年)
- 主要メーカーの創立時期
- 主要メーカーの主力製品
- 企業合併・買収 (M&A)、拡大
第3章 粉末状亜塩素酸ナトリウム:地域別の現状と展望
- 世界の粉末状亜塩素酸ナトリウムの市場規模・CAGR:地域別 (2017年・2021年・2028年)
- 過去の市場規模:地域別
- 市場規模の予測:地域別
第4章 粉末状亜塩素酸ナトリウム:用途別
- 用途別の市場セグメント
- 水処理
- 繊維製品向け用途
- パルプ向け用途
- 金属表面処理
- その他
- 用途別の市場規模
- 市場規模の概要:用途別 (2017年~2028年)
- 過去の市場規模:用途別 (2017年~2022年)
- 市場規模の予測:用途別 (2023年~2028年)
- 主要地域の市場規模:用途別
- 北米の粉末状亜塩素酸ナトリウムの販売:用途別 (2017年~2022年)
- 欧州の粉末状亜塩素酸ナトリウムの販売:用途別 (2017年~2022年)
- アジア太平洋の粉末状亜塩素酸ナトリウムの販売:用途別 (2017年~2022年)
- ラテンアメリカの粉末状亜塩素酸ナトリウムの販売:用途別 (2017年~2022年)
- 中東・アフリカの粉末状亜塩素酸ナトリウムの販売:用途別 (2017年~2022年)
第5章 北米の粉末状亜塩素酸ナトリウム:国別
- 過去の市場規模:国別
- 市場規模の予測:国別
第6章 欧州の粉末状亜塩素酸ナトリウム:国別
第7章 アジア太平洋の粉末状亜塩素酸ナトリウム:地域別
第8章 ラテンアメリカの粉末状亜塩素酸ナトリウム:国別
第9章 中東・アフリカの粉末状亜塩素酸ナトリウム:国別
第10章 企業プロファイル:粉末状亜塩素酸ナトリウム事業の主要指標
- SHANDONG GAOYUAN
- GAOMI KAIXUAN
- GAOMI YONGKANG
- DONGYING SHENGYA
- GAOMI HOYOND
- OXY CHEM
- SHANDONG XINYU
- LIANYUNGANG XINGANG
- ERCO
- ERCROS
- SHREE CHLORATES
- GAOMI DENGSHUN
第11章 上流工程・機会・課題・リスク・影響要因の分析
- 粉末状亜塩素酸ナトリウムの主要原材料
- 製造コストの構造
- 粉末状亜塩素酸ナトリウムの産業チェーンの分析
- 粉末状亜塩素酸ナトリウムの市場力学
第12章 マーケティング戦略分析、流通業者
- 販売チャンネル
- 粉末状亜塩素酸ナトリウムの流通業者
- 粉末状亜塩素酸ナトリウムの下流工程の顧客
第13章 調査結果と結論
第14章 付録
LIST OF TABLES
- Table 1. Major Company of 80% Sodium Chlorite
- Table 2. Major Company of 82% Sodium Chlorite
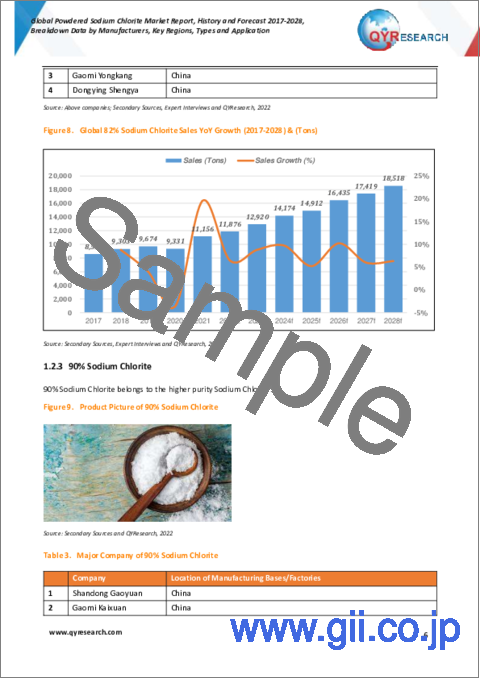
- Table 3. Major Company of 90% Sodium Chlorite
- Table 4. Major Company of 78% Sodium Chlorite
- Table 5. Global Powdered Sodium Chlorite Sales by Type: 2017 VS 2021 VS 2028 (US$ Million)
- Table 6. Global Powdered Sodium Chlorite Sales by Type (2017-2022) & (Tons)
- Table 7. Global Powdered Sodium Chlorite Sales Market Share in Volume by Type (2017-2022)
- Table 8. Global Powdered Sodium Chlorite Sales by Type (2017-2022) & (US$ Million)
- Table 9. Global Powdered Sodium Chlorite Sales Market Share in Value by Type (2017-2022)
- Table 10. Global Powdered Sodium Chlorite Price by Type (2017-2022) & (US$/Ton)
- Table 11. Global Powdered Sodium Chlorite Sales by Type (2023-2028) & (Tons)
- Table 12. Global Powdered Sodium Chlorite Sales Market Share in Volume by Type (2023-2028)
- Table 13. Global Powdered Sodium Chlorite Sales by Type (2023-2028) & (US$ Million)
- Table 14. Global Powdered Sodium Chlorite Sales Market Share in Value by Type (2023-2028)
- Table 15. Global Powdered Sodium Chlorite Price by Type (2023-2028) & (US$/Ton)
- Table 16. North America Powdered Sodium Chlorite Sales by Type (2017-2022) & (Tons)
- Table 17. North America Powdered Sodium Chlorite Sales by Type (2017-2022) & (US$ Million)
- Table 18. Europe Powdered Sodium Chlorite Sales (Tons) by Type (2017-2022)
- Table 19. Europe Powdered Sodium Chlorite Sales by Type (2017-2022) & (US$ Million)
- Table 20. Asia-Pacific Powdered Sodium Chlorite Sales (Tons) by Type (2017-2022)
- Table 21. Asia-Pacific Powdered Sodium Chlorite Sales by Type (2017-2022) & (US$ Million)
- Table 22. Latin America Powdered Sodium Chlorite Sales (Tons) by Type (2017-2022)
- Table 23. Latin America Powdered Sodium Chlorite Sales by Type (2017-2022) & (US$ Million)
- Table 24. Middle East and Africa Powdered Sodium Chlorite Sales (Tons) by Type (2017-2022)
- Table 25. Middle East and Africa Powdered Sodium Chlorite Sales by Type (2017-2022) & (US$ Million)
- Table 26. Global Powdered Sodium Chlorite Sales by Company (2017-2022) & (Tons)
- Table 27. Global Powdered Sodium Chlorite Sales Share by Company (2017-2022)
- Table 28. Global Powdered Sodium Chlorite Revenue by Company (2017-2022) & (US$ Million)
- Table 29. Global Powdered Sodium Chlorite Revenue Share by Company (2017-2022)
- Table 30. Global Market Powdered Sodium Chlorite Price by Company (2017-2022) & (US$/Ton)
- Table 31. Global Powdered Sodium Chlorite Top Manufacturers Manufacturing Base Distribution and Sales Area
- Table 32. Global Powdered Sodium Chlorite Manufacturers Market Concentration Ratio (CR5 and HHI)
- Table 33. Global Top Manufacturers Market Share by Company Type (Tier 1, Tier 2, and Tier 3) & (based on the Revenue in Powdered Sodium Chlorite as of 2021)
- Table 34. Date of Key Manufacturers Established
- Table 35. Key Manufacturers Powdered Sodium Chlorite Product Type
- Table 36. Mergers & Acquisitions, Expansion Plans
- Table 37. Global Powdered Sodium Chlorite Market Size Comparison by Region (US$ Million): 2017 VS 2021 VS 2028
- Table 38. Global Powdered Sodium Chlorite Sales by Region (2017-2022) & (Tons)
- Table 39. Global Powdered Sodium Chlorite Sales Market Share in Volume by Region (2017-2022)
- Table 40. Global Powdered Sodium Chlorite Sales by Region (2017-2022) & (US$ Million)
- Table 41. Global Powdered Sodium Chlorite Sales Market Share in Value by Region (2017-2022)
- Table 42. Global Powdered Sodium Chlorite Sales (Tons), Value (US$ Million), Price (US$/Ton) and Gross Margin (2017-2022)
- Table 43. Global Powdered Sodium Chlorite Sales by Region (2023-2028) & (Tons)
- Table 44. Global Powdered Sodium Chlorite Sales Market Share in Volume by Region (2023-2028)
- Table 45. Global Powdered Sodium Chlorite Sales by Region (2023-2028) & (US$ Million)
- Table 46. Global Powdered Sodium Chlorite Sales Market Share in Value by Region (2023-2028)
- Table 47. Global Powdered Sodium Chlorite Sales (Tons), Value (US$ Million), Price (US$/Ton) and Gross Margin (2023-2028)
- Table 48. Global Powdered Sodium Chlorite Sales by Application: 2017 VS 2021 VS 2028 (US$ Million)
- Table 49. Global Powdered Sodium Chlorite Sales by Application (2017-2022) & (Tons)
- Table 50. Global Powdered Sodium Chlorite Sales Market Share in Volume by Application (2017-2022)
- Table 51. Global Powdered Sodium Chlorite Sales by Application (2017-2022) & (US$ Million)
- Table 52. Global Powdered Sodium Chlorite Sales Market Share in Value by Application (2017-2022)
- Table 53. Global Powdered Sodium Chlorite Price by Application (2017-2022) & (US$/Ton)
- Table 54. Global Powdered Sodium Chlorite Sales by Application (2023-2028) & (Tons)
- Table 55. Global Powdered Sodium Chlorite Sales Market Share in Volume by Application (2023-2028)
- Table 56. Global Powdered Sodium Chlorite Sales by Application (2023-2028) & (US$ Million)
- Table 57. Global Powdered Sodium Chlorite Sales Market Share in Value by Application (2023-2028)
- Table 58. Global Powdered Sodium Chlorite Price by Application (2023-2028) & (US$/Ton)
- Table 59. North America Powdered Sodium Chlorite Sales by Application (2017-2022) & (Tons)
- Table 60. North America Powdered Sodium Chlorite Sales by Application (2017-2022) & (US$ Million)
- Table 61. Europe Powdered Sodium Chlorite Sales (Tons) by Application (2017-2022)
- Table 62. Europe Powdered Sodium Chlorite Sales by Application (2017-2022) & (US$ Million)
- Table 63. Asia-Pacific Powdered Sodium Chlorite Sales (Tons) by Application (2017-2022)
- Table 64. Asia-Pacific Powdered Sodium Chlorite Sales by Application (2017-2022) & (US$ Million)
- Table 65. Latin America Powdered Sodium Chlorite Sales (Tons) by Application (2017-2022)
- Table 66. Latin America Powdered Sodium Chlorite Sales by Application (2017-2022) & (US$ Million)
- Table 67. Middle East and Africa Powdered Sodium Chlorite Sales (Tons) by Application (2017-2022)
- Table 68. Middle East and Africa Powdered Sodium Chlorite Sales by Application (2017-2022) & (US$ Million)
- Table 69. North America Powdered Sodium Chlorite Sales by Country (2017-2022) & (Tons)
- Table 70. North America Powdered Sodium Chlorite Sales Market Share in Volume by Country (2017-2022)
- Table 71. North America Powdered Sodium Chlorite Sales by Country (2017-2022) & (US$ Million)
- Table 72. North America Powdered Sodium Chlorite Sales Market Share in Value by Country (2017-2022)
- Table 73. North America Powdered Sodium Chlorite Sales by Country (2023-2028) & (Tons)
- Table 74. North America Powdered Sodium Chlorite Sales Market Share in Volume by Country (2023-2028)
- Table 75. North America Powdered Sodium Chlorite Sales by Country (2023-2028) & (US$ Million)
- Table 76. North America Powdered Sodium Chlorite Sales Market Share in Value by Country (2023-2028)
- Table 77. Europe Powdered Sodium Chlorite Sales by Country (2017-2022) & (Tons)
- Table 78. Europe Powdered Sodium Chlorite Sales Market Share in Volume by Country (2017-2022)
- Table 79. Europe Powdered Sodium Chlorite Sales by Country (2017-2022) & (US$ Million)
- Table 80. Europe Powdered Sodium Chlorite Sales Market Share in Value by Country (2017-2022)
- Table 81. Europe Powdered Sodium Chlorite Sales by Country (2023-2028) & (Tons)
- Table 82. Europe Powdered Sodium Chlorite Sales Market Share in Volume by Country (2023-2028)
- Table 83. Europe Powdered Sodium Chlorite Sales by Country (2023-2028) & (US$ Million)
- Table 84. Europe Powdered Sodium Chlorite Sales Market Share in Value by Country (2023-2028)
- Table 85. Asia-Pacific Powdered Sodium Chlorite Sales by Region (2017-2022) & (Tons)
- Table 86. Asia-Pacific Powdered Sodium Chlorite Sales Market Share in Volumeby Region (2017-2022)
- Table 87. Asia-Pacific Powdered Sodium Chlorite Sales by Region (2017-2022) & (US$ Million)
- Table 88. Asia-Pacific Powdered Sodium Chlorite Sales Market Share in Value by Region (2017-2022)
- Table 89. Asia-Pacific Powdered Sodium Chlorite Sales by Region (2023-2028) & (Tons)
- Table 90. Asia-Pacific Powdered Sodium Chlorite Sales Market Share in Volume by Region (2023-2028)
- Table 91. Asia-Pacific Powdered Sodium Chlorite Sales by Region (2023-2028) & (US$ Million)
- Table 92. Asia-Pacific Powdered Sodium Chlorite Sales Market Share in Value by Region (2023-2028)
- Table 93. Latin America Powdered Sodium Chlorite Sales by Country (2017-2022) & (Tons)
- Table 94. Latin America Powdered Sodium Chlorite Sales Market Share in Volume by Country (2017-2022)
- Table 95. Latin America Powdered Sodium Chlorite Sales by Country (2017-2022) & (US$ Million)
- Table 96. Latin America Powdered Sodium Chlorite Sales Market Share in Value by Country (2017-2022)
- Table 97. Latin America Powdered Sodium Chlorite Sales by Country (2023-2028) & (Tons)
- Table 98. Latin America Powdered Sodium Chlorite Sales Market Share in Volume by Country (2023-2028)
- Table 99. Latin America Powdered Sodium Chlorite Sales by Country (2023-2028) & (US$ Million)
- Table 100. Latin America Powdered Sodium Chlorite Sales Market Share in Value by Country (2023-2028)
- Table 101. Middle East and Africa Powdered Sodium Chlorite Sales by Country (2017-2022) & (Tons)
- Table 102. Middle East and Africa Powdered Sodium Chlorite Sales Market Share in Volume by Country (2017-2022)
- Table 103. Middle East and Africa Powdered Sodium Chlorite Sales by Country (2017-2022) & (US$ Million)
- Table 104. Middle East and Africa Powdered Sodium Chlorite Sales Market Share in Value by Country (2017-2022)
- Table 105. Middle East and Africa Powdered Sodium Chlorite Sales by Country (2023-2028) & (Tons)
- Table 106. Middle East and Africa Powdered Sodium Chlorite Sales Market Share by Country (2023-2028)
- Table 107. Middle East and Africa Powdered Sodium Chlorite Sales by Country (2023-2028) & (US$ Million)
- Table 108. Middle East and Africa Powdered Sodium Chlorite Sales Market Share in Value by Country (2023-2028)
- Table 109. Shandong Gaoyuan Corporation Information
- Table 110. Shandong Gaoyuan Introduction and Business Overview
- Table 111. Shandong Gaoyuan Powdered Sodium Chlorite Sales (Tons), Revenue (US$ Million), Price (US$/Ton) and Gross Margin (2017-2022)
- Table 112. Shandong Gaoyuan Powdered Sodium Chlorite Product
- Table 113. Gaomi Kaixuan Corporation Information
- Table 114. Gaomi Kaixuan Introduction and Business Overview
- Table 115. Gaomi Kaixuan Powdered Sodium Chlorite Sales (Tons), Revenue (US$ Million), Price (US$/Ton) and Gross Margin (2017-2022)
- Table 116. Gaomi Kaixuan Powdered Sodium Chlorite Product
- Table 117. Gaomi Yongkang Corporation Information
- Table 118. Gaomi Yongkang Introduction and Business Overview
- Table 119. Gaomi Yongkang Powdered Sodium Chlorite Sales (Tons), Revenue (US$ Million), Price (US$/Ton) and Gross Margin (2017-2022)
- Table 120. Gaomi Yongkang Powdered Sodium Chlorite Product
- Table 121. Dongying Shengya Corporation Information
- Table 122. Dongying Shengya Introduction and Business Overview
- Table 123. Dongying Shengya Powdered Sodium Chlorite Sales (Tons), Revenue (US$ Million), Price (US$/Ton) and Gross Margin (2017-2022)
- Table 124. Dongying Shengya Powdered Sodium Chlorite Product
- Table 125. Gaomi Hoyond Corporation Information
- Table 126. Gaomi Hoyond Introduction and Business Overview
- Table 127. Gaomi Hoyond Powdered Sodium Chlorite Sales (Tons), Revenue (US$ Million), Price (US$/Ton) and Gross Margin (2017-2022)
- Table 128. Gaomi Hoyond Powdered Sodium Chlorite Product
- Table 129. Oxy Chem Corporation Information
- Table 130. Oxy Chem Introduction and Business Overview
- Table 131. Oxy Chem Powdered Sodium Chlorite Sales (Tons), Revenue (US$ Million), Price (US$/Ton) and Gross Margin (2017-2022)
- Table 132. Oxy Chem Powdered Sodium Chlorite Product
- Table 133. Shandong Xinyu Corporation Information
- Table 134. Shandong Xinyu Introduction and Business Overview
- Table 135. Shandong Xinyu Powdered Sodium Chlorite Sales (Tons), Revenue (US$ Million), Price (US$/Ton) and Gross Margin (2017-2022)
- Table 136. Shandong Xinyu Powdered Sodium Chlorite Product
- Table 137. Lianyungang Xingang Corporation Information
- Table 138. Lianyungang Xingang Introduction and Business Overview
- Table 139. Lianyungang Xingang Powdered Sodium Chlorite Sales (Tons), Revenue (US$ Million), Price (US$/Ton) and Gross Margin (2017-2022)
- Table 140. Lianyungang Xingang Powdered Sodium Chlorite Product
- Table 141. ERCO Corporation Information
- Table 142. ERCO Introduction and Business Overview
- Table 143. ERCO Powdered Sodium Chlorite Sales (Tons), Revenue (US$ Million), Price (US$/Ton) and Gross Margin (2017-2022)
- Table 144. ERCO Powdered Sodium Chlorite Product
- Table 145. Ercros Corporation Information
- Table 146. Ercros Introduction and Business Overview
- Table 147. Ercros Powdered Sodium Chlorite Sales (Tons), Revenue (US$ Million), Price (US$/Ton) and Gross Margin (2017-2022)
- Table 148. Ercros Powdered Sodium Chlorite Product
- Table 149. Shree Chlorates Corporation Information
- Table 150. Shree Chlorates Introduction and Business Overview
- Table 151. Shree Chlorates Powdered Sodium Chlorite Sales (Tons), Revenue (US$ Million), Price (US$/Ton) and Gross Margin (2017-2022)
- Table 152. Shree Chlorates Powdered Sodium Chlorite Product
- Table 153. Gaomi Dengshun Corporation Information
- Table 154. Gaomi Dengshun Introduction and Business Overview
- Table 155. Gaomi Dengshun Powdered Sodium Chlorite Sales (Tons), Revenue (US$ Million), Price (US$/Ton) and Gross Margin (2017-2022)
- Table 156. Gaomi Dengshun Powdered Sodium Chlorite Product
- Table 157. Key Raw Materials Lists
- Table 158. Raw Materials Key Suppliers Lists
- Table 159. Powdered Sodium Chlorite Market Trends
- Table 160. Powdered Sodium Chlorite Market Drivers
- Table 161. Powdered Sodium Chlorite Market Restraints
- Table 162. Powdered Sodium Chlorite Distributors List
- Table 163. Powdered Sodium Chlorite Downstream Customers
- Table 164. Research Programs/Design for This Report
- Table 165. Key Data Information from Secondary Sources
- Table 166. Key Data Information from Primary Sources
List of Figures
- Figure 1. Powdered Sodium Chlorite Product Picture
- Figure 2. Global Powdered Sodium Chlorite Market Size, 2017 VS 2021 VS 2028 (US$ Million)
- Figure 3. Global Powdered Sodium Chlorite Market Size Status and Outlook (2017-2028) & (US$ Million)
- Figure 4. Global Powdered Sodium Chlorite Sales Status and Outlook (2017-2028) & (Tons)
- Figure 5. Product Picture of 80% Sodium Chlorite
- Figure 6. Global 80% Sodium Chlorite Sales YoY Growth (2017-2028) & (Tons)
- Figure 7. Product Picture of 82% Sodium Chlorite
- Figure 8. Global 82% Sodium Chlorite Sales YoY Growth (2017-2028) & (Tons)
- Figure 9. Product Picture of 90% Sodium Chlorite
- Figure 10. Global 90% Sodium Chlorite Sales YoY Growth (2017-2028) & (Tons)
- Figure 11. Product Picture of 78% Sodium Chlorite
- Figure 12. Global 78% Sodium Chlorite Sales YoY Growth (2017-2028) & (Tons)
- Figure 13. Global Powdered Sodium Chlorite Sales by Type (2017-2028) & (US$ Million)
- Figure 14. Global Powdered Sodium Chlorite Market Share by Type in 2021 & 2028
- Figure 15. North America Powdered Sodium Chlorite Sales Market Share in Volume by Type in 2021
- Figure 16. North America Powdered Sodium Chlorite Sales Market Share in Value by Type in 2021
- Figure 17. Europe Powdered Sodium Chlorite Sales Market Share in Volume by Type in 2021
- Figure 18. Europe Powdered Sodium Chlorite Sales Market Share in Value by Type in 2021
- Figure 19. Asia-Pacific Powdered Sodium Chlorite Sales Market Share in Volume by Type in 2021
- Figure 20. Asia-Pacific Powdered Sodium Chlorite Sales Market Share in Value by Type in 2021
- Figure 21. Latin America Powdered Sodium Chlorite Sales Market Share in Volume by Type in 2021
- Figure 22. Latin America Powdered Sodium Chlorite Sales Market Share in Value by Type in 2021
- Figure 23. Middle East and Africa Powdered Sodium Chlorite Sales Market Share in Volume by Type in 2021
- Figure 24. Middle East and Africa Powdered Sodium Chlorite Sales Market Share in Value by Type in 2021
- Figure 25. The 5 and 10 Largest Manufacturers in the World: Market Share by Powdered Sodium Chlorite Sales in 2021
- Figure 26. The 5 and 10 Largest Manufacturers in the World: Market Share by Powdered Sodium Chlorite Revenue in 2021
- Figure 27. Powdered Sodium Chlorite Market Share by Company Type (Tier 1, Tier 2, and Tier 3): 2017 VS 2021
- Figure 28. Product Picture of Water Treatment
- Figure 29. Global Water Treatment Sales YoY Growth (2017-2028) & (Tons)
- Figure 30. Product Picture of Textile Application
- Figure 31. Global Textile Application Sales YoY Growth (2017-2028) & (Tons)
- Figure 32. Product Picture of Pulp Application
- Figure 33. Global Pulp Application Sales YoY Growth (2017-2028) & (Tons)
- Figure 34. Product Picture of Metal Surface Treatment
- Figure 35. Global Metal Surface Treatment Sales YoY Growth (2017-2028) & (Tons)
- Figure 36. Product Picture of Other
- Figure 37. Global Other Sales YoY Growth (2017-2028) & (Tons)
- Figure 38. Global Powdered Sodium Chlorite Sales by Application (2017-2028) & (US$ Million)
- Figure 39. Global Powdered Sodium Chlorite Market Share by Application in 2021 & 2028
- Figure 40. North America Powdered Sodium Chlorite Sales Market Share in Volume by Application in 2021
- Figure 41. North America Powdered Sodium Chlorite Sales Market Share in Value by Application in 2021
- Figure 42. Europe Powdered Sodium Chlorite Sales Market Share in Volume by Application in 2021
- Figure 43. Europe Powdered Sodium Chlorite Sales Market Share in Value by Application in 2021
- Figure 44. Asia-Pacific Powdered Sodium Chlorite Sales Market Share in Volume by Application in 2021
- Figure 45. Asia-Pacific Powdered Sodium Chlorite Sales Market Share in Value by Application in 2021
- Figure 46. Latin America Powdered Sodium Chlorite Sales Market Share in Volume by Application in 2021
- Figure 47. Latin America Powdered Sodium Chlorite Sales Market Share in Value by Application in 2021
- Figure 48. Middle East and Africa Powdered Sodium Chlorite Sales Market Share in Volume by Application in 2021
- Figure 49. Middle East and Africa Powdered Sodium Chlorite Sales Market Share in Value by Application in 2021
- Figure 50. Key Raw Materials Price
- Figure 51. Powdered Sodium Chlorite Manufacturing Cost Structure
- Figure 52. Powdered Sodium Chlorite Industrial Chain Analysis
- Figure 53. Channels of Distribution
- Figure 54. Distributors Profiles
- Figure 55. Bottom-up and Top-down Approaches for This Report
- Figure 56. Data Triangulation
- Figure 57. Key Executives Interviewed
Market Analysis and Insights: Global Powdered Sodium Chlorite Market
Due to the COVID-19 pandemic, the global Powdered Sodium Chlorite market size is estimated to be worth US$ 130.97 million in 2021 and is forecast to a readjusted size of US$ 190.49 million by 2028 with a CAGR of 4.65% during the review period.
The global main manufacturers of Powdered Sodium Chlorite include Shandong Gaoyuan, Gaomi Kaixuan, Gaomi Yongkang, Dongying Shengya, Gaomi Hoyond, Oxy Chem, Shandong Xinyu, Lianyungang Xingang, and ERCO, etc. In 2021, the global six largest players have a share approximately 56.36% in terms of revenue.
The North America Powdered Sodium Chlorite market is estimated at US$ 27.05 million in 2021, while China is forecast to reach US$ 71.72 million by 2028. The proportion of the China is 30.09% in 2021 and it is predicted that the share will reach 37.65% in 2028, trailing a CAGR of 7.98 % through the analysis period. As for the Europe Powdered Sodium Chlorite landscape, Germany is projected to reach US$ 14.02 million by 2028. and in Asia, the notable markets are Japan and South Korea, CAGR is 3.83 % and 5.13 % respectively for the next 6-year period.
80% Sodium Chlorite accounting for 47.13% of the Powdered Sodium Chlorite global market in 2021, is projected to value US$ 88.61 million by 2028, growing at a revised 4.44% CAGR in the post-COVID-19 period. While Water Treatment segment is altered to an 4.73 % CAGR throughout this forecast period and will hold a share about 60.8% in 2028.
Global Powdered Sodium Chlorite Scope and Market Size
The global Powdered Sodium Chlorite market is segmented by region (country), company, by Type, and by Application. Players, stakeholders, and other participants in the global Powdered Sodium Chlorite market will be able to gain the upper hand as they use the report as a powerful resource. The segmental analysis focuses on sales, revenue and forecast by region (country), by Type, and by Application for the period 2017-2028.
By Company
- Shandong Gaoyuan
- Gaomi Kaixuan
- Gaomi Yongkang
- Dongying Shengya
- Gaomi Hoyond
- Oxy Chem
- Shandong Xinyu
- Lianyungang Xingang
- ERCO
- Ercros
- Shree Chlorates
- Gaomi Dengshun
Segment by Type
- 80% Sodium Chlorite
- 82% Sodium Chlorite
- 90% Sodium Chlorite
- 78% Sodium Chlorite
Segment by Application
- Water Treatment
- Textile Application
- Pulp Application
- Metal Surface Treatment
- Other
By Region
- North America
- United States
- Canada
- Asia-Pacific
- China
- Japan
- South Korea
- India
- Australia
- Taiwan
- Indonesia
- Thailand
- Malaysia
- Philippines
- Europe
- Germany
- France
- U.K.
- Italy
- Russia
- Latin America
- Mexico
- Brazil
- Argentina
- Middle East & Africa
- Turkey
- Saudi Arabia
- UAE
TABLE OF CONTENTS
1 POWDERED SODIUM CHLORITE MARKET OVERVIEW
- 1.1 POWDERED SODIUM CHLORITE PRODUCT OVERVIEW
- 1.2 POWDERED SODIUM CHLORITE MARKET SEGMENT BY TYPE
- 1.2.1 80% SODIUM CHLORITE
- 1.2.2 82% SODIUM CHLORITE
- 1.2.3 90% SODIUM CHLORITE
- 1.2.4 78% SODIUM CHLORITE
- 1.3 GLOBAL POWDERED SODIUM CHLORITE MARKET SIZE BY TYPE
- 1.3.1 GLOBAL POWDERED SODIUM CHLORITE MARKET SIZE OVERVIEW BY TYPE (2017-2028)
- 1.3.2 GLOBAL POWDERED SODIUM CHLORITE HISTORIC MARKET SIZE REVIEW BY TYPE (2017-2022)
- 1.3.3 GLOBAL POWDERED SODIUM CHLORITE FORECASTED MARKET SIZE BY TYPE (2023-2028)
- 1.4 KEY REGIONS MARKET SIZE SEGMENT BY TYPE
- 1.4.1 NORTH AMERICA POWDERED SODIUM CHLORITE SALES BREAKDOWN BY TYPE (2017-2022)
- 1.4.2 EUROPE POWDERED SODIUM CHLORITE SALES BREAKDOWN BY TYPE (2017-2022)
- 1.4.3 ASIA-PACIFIC POWDERED SODIUM CHLORITE SALES BREAKDOWN BY TYPE (2017-2022)
- 1.4.4 LATIN AMERICA POWDERED SODIUM CHLORITE SALES BREAKDOWN BY TYPE (2017-2022)
- 1.4.5 MIDDLE EAST AND AFRICA POWDERED SODIUM CHLORITE SALES BREAKDOWN BY TYPE (2017-2022)
2 POWDERED SODIUM CHLORITE MARKET COMPETITION BY COMPANY
- 2.1 GLOBAL TOP PLAYERS BY POWDERED SODIUM CHLORITE SALES (2017-2022)
- 2.2 GLOBAL TOP PLAYERS BY POWDERED SODIUM CHLORITE REVENUE (2017-2022)
- 2.3 GLOBAL TOP PLAYERS BY POWDERED SODIUM CHLORITE PRICE (2017-2022)
- 2.4 GLOBAL TOP MANUFACTURERS POWDERED SODIUM CHLORITE MANUFACTURING BASE DISTRIBUTION, SALES AREA, PRODUCT TYPE
- 2.5 POWDERED SODIUM CHLORITE MARKET COMPETITIVE SITUATION AND TRENDS
- 2.5.1 POWDERED SODIUM CHLORITE MARKET CONCENTRATION RATE (2017-2022)
- 2.5.2 GLOBAL 5 AND 10 LARGEST MANUFACTURERS BY POWDERED SODIUM CHLORITE SALES AND REVENUE IN 2021
- 2.6 GLOBAL TOP MANUFACTURERS BY COMPANY TYPE (TIER 1, TIER 2, AND TIER 3) & (BASED ON THE REVENUE IN POWDERED SODIUM CHLORITE AS OF 2021)
- 2.7 DATE OF KEY MANUFACTURERS ESTABLISHED
- 2.8 KEY MANUFACTURERS POWDERED SODIUM CHLORITE PRODUCT OFFERED
- 2.9 MERGERS & ACQUISITIONS, EXPANSION
3 POWDERED SODIUM CHLORITE STATUS AND OUTLOOK BY REGION
- 3.1 GLOBAL POWDERED SODIUM CHLORITE MARKET SIZE AND CAGR BY REGION: 2017 VS 2021 VS 2028
- 3.2 GLOBAL POWDERED SODIUM CHLORITE HISTORIC MARKET SIZE BY REGION
- 3.2.1 GLOBAL POWDERED SODIUM CHLORITE SALES IN VOLUME BY REGION (2017-2022)
- 3.2.2 GLOBAL POWDERED SODIUM CHLORITE SALES IN VALUE BY REGION (2017-2022)
- 3.2.3 GLOBAL POWDERED SODIUM CHLORITE SALES (VOLUME & VALUE), PRICE AND GROSS MARGIN (2017-2022)
- 3.3 GLOBAL POWDERED SODIUM CHLORITE FORECASTED MARKET SIZE BY REGION
- 3.3.1 GLOBAL POWDERED SODIUM CHLORITE SALES IN VOLUME BY REGION (2023-2028)
- 3.3.2 GLOBAL POWDERED SODIUM CHLORITE SALES IN VALUE BY REGION (2023-2028)
- 3.3.3 GLOBAL POWDERED SODIUM CHLORITE SALES (VOLUME & VALUE), PRICE AND GROSS MARGIN (2023-2028)
4 POWDERED SODIUM CHLORITE BY APPLICATION
- 4.1 POWDERED SODIUM CHLORITE MARKET SEGMENT BY APPLICATION
- 4.1.1 WATER TREATMENT
- 4.1.2 TEXTILE APPLICATION
- 4.1.3 PULP APPLICATION
- 4.1.4 METAL SURFACE TREATMENT
- 4.1.5 OTHER
- 4.2 GLOBAL POWDERED SODIUM CHLORITE MARKET SIZE BY APPLICATION
- 4.2.1 GLOBAL POWDERED SODIUM CHLORITE MARKET SIZE OVERVIEW BY APPLICATION (2017-2028)
- 4.2.2 GLOBAL POWDERED SODIUM CHLORITE HISTORIC MARKET SIZE REVIEW BY APPLICATION (2017-2022)
- 4.2.3 GLOBAL POWDERED SODIUM CHLORITE FORECASTED MARKET SIZE BY APPLICATION (2023-2028)
- 4.3 KEY REGIONS MARKET SIZE SEGMENT BY APPLICATION
- 4.3.1 NORTH AMERICA POWDERED SODIUM CHLORITE SALES BREAKDOWN BY APPLICATION (2017-2022)
- 4.3.2 EUROPE POWDERED SODIUM CHLORITE SALES BREAKDOWN BY APPLICATION (2017-2022)
- 4.3.3 ASIA-PACIFIC POWDERED SODIUM CHLORITE SALES BREAKDOWN BY APPLICATION (2017-2022)
- 4.3.4 LATIN AMERICA POWDERED SODIUM CHLORITE SALES BREAKDOWN BY APPLICATION (2017-2022)
- 4.3.5 MIDDLE EAST AND AFRICA POWDERED SODIUM CHLORITE SALES BREAKDOWN BY APPLICATION (2017-2022)
5 NORTH AMERICA POWDERED SODIUM CHLORITE BY COUNTRY
- 5.1 NORTH AMERICA POWDERED SODIUM CHLORITE HISTORIC MARKET SIZE BY COUNTRY
- 5.1.1 NORTH AMERICA POWDERED SODIUM CHLORITE SALES IN VOLUME BY COUNTRY (2017-2022)
- 5.1.2 NORTH AMERICA POWDERED SODIUM CHLORITE SALES IN VALUE BY COUNTRY (2017-2022)
- 5.2 NORTH AMERICA POWDERED SODIUM CHLORITE FORECASTED MARKET SIZE BY COUNTRY
- 5.2.1 NORTH AMERICA POWDERED SODIUM CHLORITE SALES IN VOLUME BY COUNTRY (2023-2028)
- 5.2.2 NORTH AMERICA POWDERED SODIUM CHLORITE SALES IN VALUE BY COUNTRY (2023-2028)
6 EUROPE POWDERED SODIUM CHLORITE BY COUNTRY
- 6.1 EUROPE POWDERED SODIUM CHLORITE HISTORIC MARKET SIZE BY COUNTRY
- 6.1.1 EUROPE POWDERED SODIUM CHLORITE SALES IN VOLUME BY COUNTRY (2017-2022)
- 6.1.2 EUROPE POWDERED SODIUM CHLORITE SALES IN VALUE BY COUNTRY (2017-2022)
- 6.2 EUROPE POWDERED SODIUM CHLORITE FORECASTED MARKET SIZE BY COUNTRY
- 6.2.1 EUROPE POWDERED SODIUM CHLORITE SALES IN VOLUME BY COUNTRY (2023-2028)
- 6.2.2 EUROPE POWDERED SODIUM CHLORITE SALES IN VALUE BY COUNTRY (2023-2028)
7 ASIA-PACIFIC POWDERED SODIUM CHLORITE BY REGION
- 7.1 ASIA-PACIFIC POWDERED SODIUM CHLORITE HISTORIC MARKET SIZE BY REGION
- 7.1.1 ASIA-PACIFIC POWDERED SODIUM CHLORITE SALES IN VOLUME BY REGION (2017-2022)
- 7.1.2 ASIA-PACIFIC POWDERED SODIUM CHLORITE SALES IN VALUE BY REGION (2017-2022)
- 7.2 ASIA-PACIFIC POWDERED SODIUM CHLORITE FORECASTED MARKET SIZE BY REGION
- 7.2.1 ASIA-PACIFIC POWDERED SODIUM CHLORITE SALES IN VOLUME BY REGION (2023-2028)
- 7.2.2 ASIA-PACIFIC POWDERED SODIUM CHLORITE SALES IN VALUE BY REGION (2023-2028)
8 LATIN AMERICA POWDERED SODIUM CHLORITE BY COUNTRY
- 8.1 LATIN AMERICA POWDERED SODIUM CHLORITE HISTORIC MARKET SIZE BY COUNTRY
- 8.1.1 LATIN AMERICA POWDERED SODIUM CHLORITE SALES IN VOLUME BY COUNTRY (2017-2022)
- 8.1.2 LATIN AMERICA POWDERED SODIUM CHLORITE SALES IN VALUE BY COUNTRY (2017-2022)
- 8.2 LATIN AMERICA POWDERED SODIUM CHLORITE FORECASTED MARKET SIZE BY COUNTRY
- 8.2.1 LATIN AMERICA POWDERED SODIUM CHLORITE SALES IN VOLUME BY COUNTRY (2023-2028)
- 8.2.2 LATIN AMERICA POWDERED SODIUM CHLORITE SALES IN VALUE BY COUNTRY (2023-2028)
9 MIDDLE EAST AND AFRICA POWDERED SODIUM CHLORITE BY COUNTRY
- 9.1 MIDDLE EAST AND AFRICA POWDERED SODIUM CHLORITE HISTORIC MARKET SIZE BY COUNTRY
- 9.1.1 MIDDLE EAST AND AFRICA POWDERED SODIUM CHLORITE SALES IN VOLUME BY COUNTRY (2017-2022)
- 9.1.2 MIDDLE EAST AND AFRICA POWDERED SODIUM CHLORITE SALES IN VALUE BY COUNTRY (2017-2022)
- 9.2 MIDDLE EAST AND AFRICA POWDERED SODIUM CHLORITE FORECASTED MARKET SIZE BY COUNTRY
- 9.2.1 MIDDLE EAST AND AFRICA POWDERED SODIUM CHLORITE SALES IN VOLUME BY COUNTRY (2023-2028)
- 9.2.2 MIDDLE EAST AND AFRICA POWDERED SODIUM CHLORITE SALES IN VALUE BY COUNTRY (2023-2028)
10 COMPANY PROFILES AND KEY FIGURES IN POWDERED SODIUM CHLORITE BUSINESS
- 10.1 SHANDONG GAOYUAN
- 10.1.1 SHANDONG GAOYUAN CORPORATION INFORMATION
- 10.1.2 SHANDONG GAOYUAN INTRODUCTION AND BUSINESS OVERVIEW
- 10.1.3 SHANDONG GAOYUAN POWDERED SODIUM CHLORITE SALES, REVENUE AND GROSS MARGIN (2017-2022)
- 10.1.4 SHANDONG GAOYUAN POWDERED SODIUM CHLORITE PRODUCTS OFFERED
- 10.2 GAOMI KAIXUAN
- 10.2.1 GAOMI KAIXUAN CORPORATION INFORMATION
- 10.2.2 GAOMI KAIXUAN INTRODUCTION AND BUSINESS OVERVIEW
- 10.2.3 GAOMI KAIXUAN POWDERED SODIUM CHLORITE SALES, REVENUE AND GROSS MARGIN (2017-2022)
- 10.2.4 GAOMI KAIXUAN POWDERED SODIUM CHLORITE PRODUCTS OFFERED
- 10.3 GAOMI YONGKANG
- 10.3.1 GAOMI YONGKANG CORPORATION INFORMATION
- 10.3.2 GAOMI YONGKANG INTRODUCTION AND BUSINESS OVERVIEW
- 10.3.3 GAOMI YONGKANG POWDERED SODIUM CHLORITE SALES, REVENUE AND GROSS MARGIN (2017-2022)
- 10.3.4 GAOMI YONGKANG POWDERED SODIUM CHLORITE PRODUCTS OFFERED
- 10.4 DONGYING SHENGYA
- 10.4.1 DONGYING SHENGYA CORPORATION INFORMATION
- 10.4.2 DONGYING SHENGYA INTRODUCTION AND BUSINESS OVERVIEW
- 10.4.3 DONGYING SHENGYA POWDERED SODIUM CHLORITE SALES, REVENUE AND GROSS MARGIN (2017-2022)
- 10.4.4 DONGYING SHENGYA POWDERED SODIUM CHLORITE PRODUCTS OFFERED
- 10.5 GAOMI HOYOND
- 10.5.1 GAOMI HOYOND CORPORATION INFORMATION
- 10.5.2 GAOMI HOYOND INTRODUCTION AND BUSINESS OVERVIEW
- 10.5.3 GAOMI HOYOND POWDERED SODIUM CHLORITE SALES, REVENUE AND GROSS MARGIN (2017-2022)
- 10.5.4 GAOMI HOYOND POWDERED SODIUM CHLORITE PRODUCTS OFFERED
- 10.6 OXY CHEM
- 10.6.1 OXY CHEM CORPORATION INFORMATION
- 10.6.2 OXY CHEM INTRODUCTION AND BUSINESS OVERVIEW
- 10.6.3 OXY CHEM POWDERED SODIUM CHLORITE SALES, REVENUE AND GROSS MARGIN (2017-2022)
- 10.6.4 OXY CHEM POWDERED SODIUM CHLORITE PRODUCTS OFFERED
- 10.7 SHANDONG XINYU
- 10.7.1 SHANDONG XINYU CORPORATION INFORMATION
- 10.7.2 SHANDONG XINYU INTRODUCTION AND BUSINESS OVERVIEW
- 10.7.3 SHANDONG XINYU POWDERED SODIUM CHLORITE SALES, REVENUE AND GROSS MARGIN (2017-2022)
- 10.7.4 SHANDONG XINYU POWDERED SODIUM CHLORITE PRODUCTS OFFERED
- 10.8 LIANYUNGANG XINGANG
- 10.8.1 LIANYUNGANG XINGANG CORPORATION INFORMATION
- 10.8.2 LIANYUNGANG XINGANG INTRODUCTION AND BUSINESS OVERVIEW
- 10.8.3 LIANYUNGANG XINGANG POWDERED SODIUM CHLORITE SALES, REVENUE AND GROSS MARGIN (2017-2022)
- 10.8.4 LIANYUNGANG XINGANG POWDERED SODIUM CHLORITE PRODUCTS OFFERED
- 10.9 ERCO
- 10.9.1 ERCO CORPORATION INFORMATION
- 10.9.2 ERCO INTRODUCTION AND BUSINESS OVERVIEW
- 10.9.3 ERCO POWDERED SODIUM CHLORITE SALES, REVENUE AND GROSS MARGIN (2017-2022)
- 10.9.4 ERCO POWDERED SODIUM CHLORITE PRODUCTS OFFERED
- 10.10 ERCROS
- 10.10.1 ERCROS CORPORATION INFORMATION
- 10.10.2 ERCROS INTRODUCTION AND BUSINESS OVERVIEW
- 10.10.3 ERCROS POWDERED SODIUM CHLORITE SALES, REVENUE AND GROSS MARGIN (2017-2022)
- 10.10.4 ERCROS POWDERED SODIUM CHLORITE PRODUCTS OFFERED
- 10.11 SHREE CHLORATES
- 10.11.1 SHREE CHLORATES CORPORATION INFORMATION
- 10.11.2 SHREE CHLORATES INTRODUCTION AND BUSINESS OVERVIEW
- 10.11.3 SHREE CHLORATES POWDERED SODIUM CHLORITE SALES, REVENUE AND GROSS MARGIN (2017-2022)
- 10.11.4 SHREE CHLORATES POWDERED SODIUM CHLORITE PRODUCTS OFFERED
- 10.12 GAOMI DENGSHUN
- 10.12.1 GAOMI DENGSHUN CORPORATION INFORMATION
- 10.12.2 GAOMI DENGSHUN INTRODUCTION AND BUSINESS OVERVIEW
- 10.12.3 GAOMI DENGSHUN POWDERED SODIUM CHLORITE SALES, REVENUE AND GROSS MARGIN (2017-2022)
- 10.12.4 GAOMI DENGSHUN POWDERED SODIUM CHLORITE PRODUCTS OFFERED
11 UPSTREAM, OPPORTUNITIES, CHALLENGES, RISKS AND INFLUENCES FACTORS ANALYSIS
- 11.1 POWDERED SODIUM CHLORITE KEY RAW MATERIALS
- 11.1.1 KEY RAW MATERIALS
- 11.1.2 KEY RAW MATERIALS PRICE
- 11.1.3 RAW MATERIALS KEY SUPPLIERS
- 1.1 MANUFACTURING COST STRUCTURE
- 1.1.1 RAW MATERIALS
- 1.1.2 LABOR COST
- 1.1.3 MANUFACTURING EXPENSES
- 11.2 POWDERED SODIUM CHLORITE INDUSTRIAL CHAIN ANALYSIS
- 11.3 POWDERED SODIUM CHLORITE MARKET DYNAMICS
- 11.3.1 POWDERED SODIUM CHLORITE INDUSTRY TRENDS
- 11.3.2 POWDERED SODIUM CHLORITE MARKET DRIVERS
- 11.3.3 POWDERED SODIUM CHLORITE MARKET RESTRAINTS
12 MARKETING STRATEGY ANALYSIS, DISTRIBUTORS
- 12.1 SALES CHANNEL
- 12.2 POWDERED SODIUM CHLORITE DISTRIBUTORS
- 12.3 POWDERED SODIUM CHLORITE DOWNSTREAM CUSTOMERS
13 RESEARCH FINDINGS AND CONCLUSION
14 APPENDIX
- 14.1 RESEARCH METHODOLOGY
- 14.1.1 METHODOLOGY/RESEARCH APPROACH
- 14.1.2 DATA SOURCE
- 14.2 AUTHOR DETAILS
- 14.3 DISCLAIMER