|
|
市場調査レポート
商品コード
1078930
中型・大型兵器の世界市場:産業分析・成長動向・競合分析 (2022年~2028年)Global Medium and Heavy Weapons Industry Research Report Growth Trends and Competitive Analysis 2022-2028 |
||||||
|
|
|||||||
|
● お客様のご希望に応じて、既存データの加工や未掲載情報(例:国別セグメント)の追加などの対応が可能です。 詳細はお問い合わせください。 |
|||||||


| 中型・大型兵器の世界市場:産業分析・成長動向・競合分析 (2022年~2028年) |
|
出版日: 2022年05月28日
発行: QYResearch
ページ情報: 英文 143 Pages
納期: 2~3営業日
|
- 全表示
- 概要
- 図表
- 目次
世界の中型・大型兵器の市場規模は、新型コロナウイルス感染症 (COVID-19) による再調整を経て、2021年には6,731億7,000万米ドル、2028年までに9,288億3,200万米ドルに達すると予測されています。
また、予測期間中 (2022年~2028年) に4.45%のCAGRで成長する見通しです。
種類別では、大型兵器 (重火器) が2021年に世界市場の97.21%を占め、2022年から2028年の間に4.48%のCAGRで成長すると予測されています。用途別では、防衛分野が予測期間中に4.67%のCAGRで成長する見通しです。
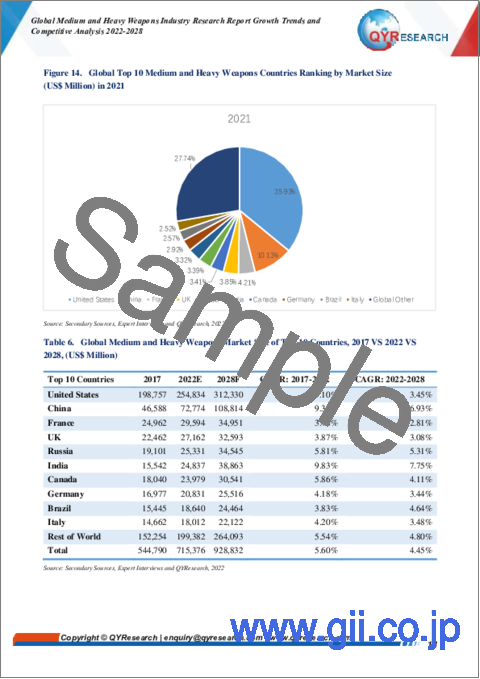
地域別に見ると、米国が2021年に世界市場の35.93%、中国が10.13%のシェアを占めています。
当レポートでは、世界の中型・大型兵器の市場について分析し、種類別・用途別・地域別 (国別) の市場動向の見通し (2017年~2028年)、主要企業のプロファイルなどについて調査しております。
目次
第1章 調査範囲
- 中型・大型兵器:製品概略
- 種類別の市場
- 市場規模・成長率:種類別 (2017年・2021年・2028年)
- 中型兵器
- 大型兵器 (重火器)
- 用途別の市場
- 分析対象
- 分析期間
第2章 市場の展望
- 世界の中型・大型兵器の市場規模 (2017年~2028年)
- 中型・大型兵器の市場規模:主要地域別 (2017年・2021年・2028年)
- 世界の中型・大型兵器の市場規模:地域別 (2017年~2022年)
- 世界の中型・大型兵器の市場規模の予測:地域別 (2023年~2028年)
- 上位10ヶ国:市場規模のランキング
第3章 中型・大型兵器の市場:企業別の競合情勢
- 主要中型・大型兵器企業の収益
- 市場シェア:企業の種類別 (ティア1、ティア2、ティア3)
- 分析対象企業:中型・大型兵器の収益別のランキング
- 世界の中型・大型兵器市場の集中度
- 中型・大型兵器の主要企業:本社・提供エリア
- 中型・大型兵器の主要企業:製品・ソリューション・サービス
- 中型・大型兵器市場での創立時期
- 企業合併・買収 (M&A)、拡張計画
第4章 中型・大型兵器:種類別の内訳データ
- 過去の市場規模:種類別 (2017年~2022年)
- 市場規模の予測:種類別 (2023年~2028年)
第5章 中型・大型兵器:用途別の内訳データ
- 過去の市場規模:用途別 (2017年~2022年)
- 市場規模の予測:用途別 (2023年~2028年)
第6章 北米
- 北米の中型・大型兵器の収益:企業別 (2020年~2022年)
- 中型・大型兵器の収益:種類別 (2017年~2028年)
- 中型・大型兵器の収益:用途別 (2017年~2028年)
- 中型・大型兵器の収益:国別 (2017年~2028年)
- 米国
- カナダ
- メキシコ
第7章 欧州
- 欧州の中型・大型兵器の収益:企業別 (2020年~2022年)
- 中型・大型兵器の収益:種類別 (2017年~2028年)
- 中型・大型兵器の収益:用途別 (2017年~2028年)
- 中型・大型兵器の収益:国別 (2017年~2028年)
- ドイツ
- フランス
- 英国
- イタリア
- ロシア
第8章 アジア太平洋
- アジア太平洋の中型・大型兵器の収益:企業別 (2020年~2022年)
- 中型・大型兵器の収益:種類別 (2017年~2028年)
- 中型・大型兵器の収益:用途別 (2017年~2028年)
- 中型・大型兵器の収益:地域別 (2017年~2028年)
- 中国
- 日本
- 韓国
- インド
- オーストラリア
- 東南アジア
第9章 南米
- 南米の中型・大型兵器の収益:企業別 (2017年~2022年)
- 中型・大型兵器の収益:種類別 (2017年~2028年)
- 中型・大型兵器の収益:用途別 (2017年~2028年)
- 中型・大型兵器の収益:国別 (2017年~2028年)
- ブラジル
- アルゼンチン
第10章 中東・アフリカ
- 中東・アフリカの中型・大型兵器の収益:企業別 (2017年~2022年)
- 中型・大型兵器の収益:種類別 (2017年~2028年)
- 中型・大型兵器の収益:用途別 (2017年~2028年)
- 中型・大型兵器の収益:国別 (2017年~2028年)
- トルコ
- サウジアラビア
- イスラエル
第11章 企業プロファイル
- Lockheed Martin
- Raytheon Technologies
- Boeing
- Northrop Grumman
- General Dynamics
- BAE Systems
- NORINCO Group
- L3Harris Technologies
- Airbus
- Leonardo
- Thales
- Almaz-Antey
- Rheinmetall
- Elbit Systems
- Saab
- Indian Ordnance Factories
第12章 中型・大型兵器の市場力学
- 中型・大型兵器業界の動向
- 中型・大型兵器市場の促進要因
- 中型・大型兵器市場の課題と抑制要因
第13章 調査結果と結論
第14章 付録
LIST OF TABLES
- Table 1. Global Medium and Heavy Weapons Market Size Growth Rate by Type (US$ Million): 2017 VS 2021 VS 2028
- Table 2. Global Medium and Heavy Weapons Market Size Growth by Application (US$ Million): 2017 VS 2021 VS 2028
- Table 3. Global Medium and Heavy Weapons Market Size (US$ Million) by Region: 2017 VS 2021 VS 2028
- Table 4. Global Medium and Heavy Weapons Revenue by Region (2017-2022) & (US$ Million)
- Table 5. Global Medium and Heavy Weapons Revenue Forecast by Region (2023-2028) & (US$ Million)
- Table 6. Global Medium and Heavy Weapons Market Size of Top 10 Countries, 2017 VS 2022 VS 2028, (US$ Million)
- Table 7. Global Medium and Heavy Weapons Revenue by Players (2017-2022) & (US$ Million)
- Table 8. Global Medium and Heavy Weapons Market Share by Players (2017-2022)
- Table 9. Global Top Medium and Heavy Weapons Players by Company Type (Tier 1, Tier 2, and Tier 3) & (based on the Revenue in Medium and Heavy Weapons as of 2021)
- Table 10. Ranking of Global Top Medium and Heavy Weapons Companies by Revenue (US$ Million) in 2021
- Table 11. Global 5 Largest Players Market Share by Medium and Heavy Weapons Revenue (CR5 and HHI) & (2017-2022)
- Table 12. Key Players Headquarters and Area Served
- Table 13. Key Players Medium and Heavy Weapons Product Solution and Service
- Table 14. Established Date of Medium and Heavy Weapons Market
- Table 15. Mergers & Acquisitions, Expansion Plans
- Table 16. Global Medium and Heavy Weapons Market Size by Type (2017-2022) & (US$ Million)
- Table 17. Global Medium and Heavy Weapons Revenue Market Share by Type (2017-2022)
- Table 18. Global Medium and Heavy Weapons Forecasted Market Size by Type (2023-2028) & (US$ Million)
- Table 19. Global Medium and Heavy Weapons Revenue Market Share by Type (2023-2028)
- Table 20. Global Medium and Heavy Weapons Market Size by Application (2017-2022) & (US$ Million)
- Table 21. Global Medium and Heavy Weapons Revenue Market Share by Application (2017-2022)
- Table 22. Global Medium and Heavy Weapons Forecasted Market Size by Application (2023-2028) & (US$ Million)
- Table 23. Global Medium and Heavy Weapons Revenue Market Share by Application (2023-2028)
- Table 24. North America Medium and Heavy Weapons Revenue by Company (2020-2022) & (US$ Million)
- Table 25. North America Medium and Heavy Weapons Revenue by Type (2017-2022) & (US$ Million)
- Table 26. North America Medium and Heavy Weapons Revenue by Type (2023-2028) & (US$ Million)
- Table 27. North America Medium and Heavy Weapons Revenue by Application (2017-2022) & (US$ Million)
- Table 28. North America Medium and Heavy Weapons Revenue by Application (2023-2028) & (US$ Million)
- Table 29. North America Medium and Heavy Weapons Revenue by Country (2017-2022) & (US$ Million)
- Table 30. North America Medium and Heavy Weapons Revenue by Country (2023-2028) & (US$ Million)
- Table 31. Europe Medium and Heavy Weapons Revenue by Company (2020-2022) & (US$ Million)
- Table 32. Europe Medium and Heavy Weapons Revenue by Type (2017-2022) & (US$ Million)
- Table 33. Europe Medium and Heavy Weapons Revenue by Type (2023-2028) & (US$ Million)
- Table 34. Europe Medium and Heavy Weapons Revenue by Application (2017-2022) & (US$ Million)
- Table 35. Europe Medium and Heavy Weapons Revenue by Application (2023-2028) & (US$ Million)
- Table 36. Europe Medium and Heavy Weapons Revenue by Country (2017-2022) & (US$ Million)
- Table 37. Europe Medium and Heavy Weapons Revenue by Country (2023-2028) & (US$ Million)
- Table 38. Asia Pacific Medium and Heavy Weapons Revenue by Company (2020-2022) & (US$ Million)
- Table 39. Asia Pacific Medium and Heavy Weapons Revenue by Type (2017-2022) & (US$ Million)
- Table 40. Asia Pacific Medium and Heavy Weapons Revenue by Type (2023-2028) & (US$ Million)
- Table 41. Asia Pacific Medium and Heavy Weapons Revenue by Application (2017-2022) & (US$ Million)
- Table 42. Asia Pacific Medium and Heavy Weapons Revenue by Application (2023-2028) & (US$ Million)
- Table 43. Asia Pacific Medium and Heavy Weapons Revenue by Region (2017-2022) & (US$ Million)
- Table 44. Asia Pacific Medium and Heavy Weapons Revenue by Region (2023-2028) & (US$ Million)
- Table 45. South America Medium and Heavy Weapons Revenue by Company (2017-2022) & (US$ Million)
- Table 46. South America Medium and Heavy Weapons Revenue by Type (2017-2022) & (US$ Million)
- Table 47. South America Medium and Heavy Weapons Revenue by Type (2023-2028) & (US$ Million)
- Table 48. South America Medium and Heavy Weapons Revenue by Application (2017-2022) & (US$ Million)
- Table 49. South America Medium and Heavy Weapons Revenue by Application (2023-2028) & (US$ Million)
- Table 50. South America Medium and Heavy Weapons Revenue by Country (2017-2022) & (US$ Million)
- Table 51. South America Medium and Heavy Weapons Revenue by Country (2023-2028) & (US$ Million)
- Table 52. Middle East and Africa Medium and Heavy Weapons Revenue by Company (2017-2022) & (US$ Million)
- Table 53. Middle East and Africa Medium and Heavy Weapons Revenue by Type (2017-2022) & (US$ Million)
- Table 54. Middle East and Africa Medium and Heavy Weapons Revenue by Type (2023-2028) & (US$ Million)
- Table 55. Middle East and Africa Medium and Heavy Weapons Revenue by Application (2017-2022) & (US$ Million)
- Table 56. Middle East and Africa Medium and Heavy Weapons Revenue by Application (2023-2028) & (US$ Million)
- Table 57. Middle East and Africa Medium and Heavy Weapons Revenue by Country (2017-2022) & (US$ Million)
- Table 58. Middle East and Africa Medium and Heavy Weapons Revenue by Country (2023-2028) & (US$ Million)
- Table 59. Lockheed Martin Company Details
- Table 60. Lockheed Martin Business Overview
- Table 61. Lockheed Martin Medium and Heavy Weapons Products and Services
- Table 62. Lockheed Martin Revenue in Medium and Heavy Weapons Business (2017-2022) & (US$ Million)
- Table 63. Raytheon Technologies Company Details
- Table 64. Raytheon Technologies Business Overview
- Table 65. Raytheon Technologies Medium and Heavy Weapons Products and Services
- Table 66. Raytheon Technologies Revenue in Medium and Heavy Weapons Business (2017-2022) & (US$ Million)
- Table 67. Boeing Company Details
- Table 68. Boeing Business Overview
- Table 69. Boeing Medium and Heavy Weapons Products and Services
- Table 70. Boeing Revenue in Medium and Heavy Weapons Business (2017-2022) & (US$ Million)
- Table 71. Northrop Grumman Company Details
- Table 72. Northrop Grumman Business Overview
- Table 73. Northrop Grumman Medium and Heavy Weapons Products and Services
- Table 74. Northrop Grumman Revenue in Medium and Heavy Weapons Business (2017-2022) & (US$ Million)
- Table 75. General Dynamics Company Details
- Table 76. General Dynamics Business Overview
- Table 77. General Dynamics Medium and Heavy Weapons Products and Services
- Table 78. General Dynamics Revenue in Medium and Heavy Weapons Business (2017-2022) & (US$ Million)
- Table 79. BAE Systems Company Details
- Table 80. BAE Systems Business Overview
- Table 81. BAE Systems Medium and Heavy Weapons Products and Services
- Table 82. BAE Systems Revenue in Medium and Heavy Weapons Business (2017-2022) & (US$ Million)
- Table 83. NORINCO Group Company Details
- Table 84. NORINCO Group Business Overview
- Table 85. NORINCO Group Medium and Heavy Weapons Products and Services
- Table 86. NORINCO Group Revenue in Medium and Heavy Weapons Business (2017-2022) & (US$ Million)
- Table 87. L3Harris Technologies Company Details
- Table 88. L3Harris Technologies Business Overview
- Table 89. L3Harris Technologies Medium and Heavy Weapons Products and Services
- Table 90. L3Harris Technologies Revenue in Medium and Heavy Weapons Business (2017-2022) & (US$ Million)
- Table 91. Airbus Company Details
- Table 92. Airbus Business Overview
- Table 93. Airbus Medium and Heavy Weapons Products and Services
- Table 94. Airbus Revenue in Medium and Heavy Weapons Business (2017-2022) & (US$ Million)
- Table 95. Leonardo Company Details
- Table 96. Leonardo Business Overview
- Table 97. Leonardo Medium and Heavy Weapons Products and Services
- Table 98. Leonardo Revenue in Medium and Heavy Weapons Business (2017-2022) & (US$ Million)
- Table 99. Thales Company Details
- Table 100. Thales Business Overview
- Table 101. Thales Medium and Heavy Weapons Products and Services
- Table 102. Thales Revenue in Medium and Heavy Weapons Business (2017-2022) & (US$ Million)
- Table 103. Almaz-Antey Company Details
- Table 104. Almaz-Antey Business Overview
- Table 105. Almaz-Antey Medium and Heavy Weapons Products and Services
- Table 106. Almaz-Antey Revenue in Medium and Heavy Weapons Business (2017-2022) & (US$ Million)
- Table 107. Rheinmetall Company Details
- Table 108. Rheinmetall Business Overview
- Table 109. Rheinmetall Medium and Heavy Weapons Products and Services
- Table 110. Rheinmetall Revenue in Medium and Heavy Weapons Business (2017-2022) & (US$ Million)
- Table 111. Elbit Systems Company Details
- Table 112. Elbit Systems Business Overview
- Table 113. Elbit Systems Medium and Heavy Weapons Products and Services
- Table 114. Elbit Systems Revenue in Medium and Heavy Weapons Business (2017-2022) & (US$ Million)
- Table 115. Saab Company Details
- Table 116. Saab Business Overview
- Table 117. Saab Medium and Heavy Weapons Products and Services
- Table 118. Saab Revenue in Medium and Heavy Weapons Business (2017-2022) & (US$ Million)
- Table 119. Indian Ordnance Factories Company Details
- Table 120. Indian Ordnance Factories Business Overview
- Table 121. Indian Ordnance Factories Medium and Heavy Weapons Products and Services
- Table 122. Indian Ordnance Factories Revenue in Medium and Heavy Weapons Business (2017-2022) & (US$ Million)
- Table 123. Medium and Heavy Weapons Market Drivers
- Table 124. Medium and Heavy Weapons Market Challenges
- Table 125. Research Programs/Design for This Report
- Table 126. Key Data Information from Secondary Sources
- Table 127. Key Data Information from Primary Sources
List of Figures
- Figure 1. Medium and Heavy Weapons Product Picture
- Figure 2. Global Medium and Heavy Weapons Market Size by Type (US$ Million): 2017 VS 2021 VS 2028
- Figure 3. Global Medium and Heavy Weapons Market Share by Type: 2021 VS 2028
- Figure 4. Medium Weapons Features
- Figure 5. Heavy Weapons Features
- Figure 6. Global Medium and Heavy Weapons Market Size by Application (US$ Million): 2017 VS 2021 VS 2028
- Figure 7. Global Medium and Heavy Weapons Market Share by Application: 2021 VS 2028
- Figure 8. Medium and Heavy Weapons Report Years Considered
- Figure 9. Global Medium and Heavy Weapons Revenue, (US$ Million), 2017 VS 2022 VS 2028
- Figure 10. Global Medium and Heavy Weapons Market Size 2017-2028 (US$ Million)
- Figure 11. Global Medium and Heavy Weapons Market Size Market Share by Region: 2021 VS 2028
- Figure 12. Global Medium and Heavy Weapons Revenue Market Share by Region in 2017 VS 2022
- Figure 13. Global Medium and Heavy Weapons Revenue Market Share Forecast by Region (2023-2028)
- Figure 14. Global Top 10 Medium and Heavy Weapons Countries Ranking by Market Size (US$ Million) in 2021
- Figure 15. Global Medium and Heavy Weapons Market Size of Top 10 Countries, 2017 VS 2022 VS 2028, (US$ Million)
- Figure 16. Global Medium and Heavy Weapons Market Share by Players in 2021
- Figure 17. Global Top Medium and Heavy Weapons Players by Company Type (Tier 1, Tier 2, and Tier 3) & (based on the Revenue in Medium and Heavy Weapons as of 2021)
- Figure 18. The Top 10 and 5 Players Market Share by Medium and Heavy Weapons Revenue in 2021
- Figure 19. North America Medium and Heavy Weapons Revenue Market Share by Company in 2021
- Figure 20. North America Medium and Heavy Weapons Revenue Market Share by Type (2017-2028)
- Figure 21. North America Medium and Heavy Weapons Revenue Market Share by Application (2017-2028)
- Figure 22. North America Medium and Heavy Weapons Revenue Share by Country (2017-2028)
- Figure 23. United States Medium and Heavy Weapons Revenue (2017-2028) & (US$ Million)
- Figure 24. Canada Medium and Heavy Weapons Revenue (2017-2028) & (US$ Million)
- Figure 25. Mexico Medium and Heavy Weapons Revenue (2017-2028) & (US$ Million)
- Figure 26. Europe Medium and Heavy Weapons Revenue Market Share by Company in 2021
- Figure 27. Europe Medium and Heavy Weapons Revenue Market Share by Type (2017-2028)
- Figure 28. Europe Medium and Heavy Weapons Revenue Market Share by Application (2017-2028)
- Figure 29. Europe Medium and Heavy Weapons Revenue Share by Country (2017-2028)
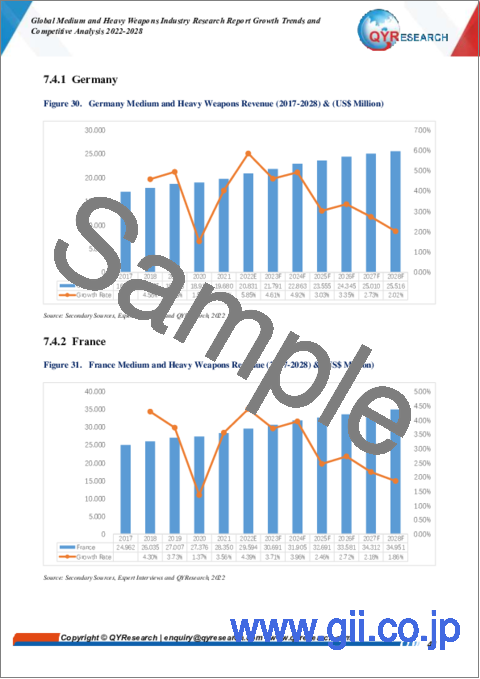
- Figure 30. Germany Medium and Heavy Weapons Revenue (2017-2028) & (US$ Million)
- Figure 31. France Medium and Heavy Weapons Revenue (2017-2028) & (US$ Million)
- Figure 32. U.K. Medium and Heavy Weapons Revenue (2017-2028) & (US$ Million)
- Figure 33. Italy Medium and Heavy Weapons Revenue (2017-2028) & (US$ Million)
- Figure 34. Russia Medium and Heavy Weapons Revenue (2017-2028) & (US$ Million)
- Figure 35. Asia Pacific Medium and Heavy Weapons Revenue Market Share by Company in 2021
- Figure 36. Asia Pacific Medium and Heavy Weapons Revenue Market Share by Type (2017-2028)
- Figure 37. Asia Pacific Medium and Heavy Weapons Revenue Market Share by Application (2017-2028)
- Figure 38. Asia Pacific Medium and Heavy Weapons Revenue Share by Region (2017-2028)
- Figure 39. China Medium and Heavy Weapons Revenue (2017-2028) & (US$ Million)
- Figure 40. Japan Medium and Heavy Weapons Revenue (2017-2028) & (US$ Million)
- Figure 41. South Korea Medium and Heavy Weapons Revenue (2017-2028) & (US$ Million)
- Figure 42. India Medium and Heavy Weapons Revenue (2017-2028) & (US$ Million)
- Figure 43. Australia Medium and Heavy Weapons Revenue (2017-2028) & (US$ Million)
- Figure 44. Southeast Asia Medium and Heavy Weapons Revenue (2017-2028) & (US$ Million)
- Figure 45. South America Medium and Heavy Weapons Revenue Market Share by Company in 2021
- Figure 46. South America Medium and Heavy Weapons Revenue Market Share by Type (2017-2028)
- Figure 47. South America Medium and Heavy Weapons Revenue Market Share by Application (2017-2028)
- Figure 48. South America Medium and Heavy Weapons Revenue Share by Country (2017-2028)
- Figure 49. Brazil Medium and Heavy Weapons Revenue (2017-2028) & (US$ Million)
- Figure 50. Argentina Medium and Heavy Weapons Revenue (2017-2028) & (US$ Million)
- Figure 51. Middle East and Africa Medium and Heavy Weapons Revenue Market Share by Company in 2021
- Figure 52. Middle East and Africa Medium and Heavy Weapons Revenue Market Share by Type (2017-2028)
- Figure 53. Middle East and Africa Medium and Heavy Weapons Revenue Market Share by Application (2017-2028)
- Figure 54. Middle East and Africa Medium and Heavy Weapons Revenue Share by Country (2017-2028)
- Figure 55. Turkey Medium and Heavy Weapons Revenue (2017-2028) & (US$ Million)
- Figure 56. Saudi Arabia Medium and Heavy Weapons Revenue (2017-2028) & (US$ Million)
- Figure 57. Israel Medium and Heavy Weapons Revenue (2017-2028) & (US$ Million)
- Figure 58. Lockheed Martin Revenue Growth Rate in Medium and Heavy Weapons Business (2017-2022)
- Figure 59. Raytheon Technologies Revenue Growth Rate in Medium and Heavy Weapons Business (2017-2022)
- Figure 60. Boeing Revenue Growth Rate in Medium and Heavy Weapons Business (2017-2022)
- Figure 61. Northrop Grumman Revenue Growth Rate in Medium and Heavy Weapons Business (2017-2022)
- Figure 62. General Dynamics Revenue Growth Rate in Medium and Heavy Weapons Business (2017-2022)
- Figure 63. BAE Systems Revenue Growth Rate in Medium and Heavy Weapons Business (2017-2022)
- Figure 64. NORINCO Group Revenue Growth Rate in Medium and Heavy Weapons Business (2017-2022)
- Figure 65. L3Harris Technologies Revenue Growth Rate in Medium and Heavy Weapons Business (2017-2022)
- Figure 66. Airbus Revenue Growth Rate in Medium and Heavy Weapons Business (2017-2022)
- Figure 67. Leonardo Revenue Growth Rate in Medium and Heavy Weapons Business (2017-2022)
- Figure 68. Thales Revenue Growth Rate in Medium and Heavy Weapons Business (2017-2022)
- Figure 69. Almaz-Antey Revenue Growth Rate in Medium and Heavy Weapons Business (2017-2022)
- Figure 70. Rheinmetall Revenue Growth Rate in Medium and Heavy Weapons Business (2017-2022)
- Figure 71. Elbit Systems Revenue Growth Rate in Medium and Heavy Weapons Business (2017-2022)
- Figure 72. Saab Revenue Growth Rate in Medium and Heavy Weapons Business (2017-2022)
- Figure 73. Indian Ordnance Factories Revenue Growth Rate in Medium and Heavy Weapons Business (2017-2022)
- Figure 74. Global Share of Exports of Major Arms by the 10 Largest Exporters, 2017-21
- Figure 75. Bottom-up and Top-down Approaches for This Report
- Figure 76. Data Triangulation
- Figure 77. Key Executives Interviewed
Summary
Due to the COVID-19 pandemic, the global Medium and Heavy Weapons market size was US$ 673,170 million in 2021 and is forecast to a readjusted size of US$ 928,832 million by 2028 with a CAGR of 4.45% during the forecast period 2022-2028. Fully considering the economic change by this health crisis, Heavy Weapons accounting for 97.21% of the Medium and Heavy Weapons global market in 2021, is projected to value US$ 904,258 million by 2028, growing at a revised 4.48% CAGR from 2022 to 2028. While Defense segment is altered to an 4.67% CAGR throughout this forecast period.
The global key manufacturers of Medium and Heavy Weapons include Lockheed Martin, Raytheon Technologies, Boeing, Northrop Grumman, General Dynamics, BAE Systems, NORINCO Group, L3Harris Technologies, and Airbus, etc. In 2021, the global top five players hold a share approximately 28.45% in terms of revenue.
The United States Medium and Heavy Weapons market size was US$ 241,869 million in 2021, while China size was US$ 68,224 million. The proportion of the United States was 35.93% in 2021, while China percentage was 10.13%, and it is predicted that China share will reach 11.72% in 2028, trailing a CAGR of 6.93% through the analysis period. As for the Europe Medium and Heavy Weapons landscape, Germany is projected to reach US$ 25,516 million by 2028. and in Asia, the notable markets are Japan and South Korea, CAGR is 2.86% and 6.15% respectively for the next 6-year period.
The market research report offered here is a very useful resource that can help manufacturers, stakeholders, decision-makers, and other market participants to become familiar with every factor impacting the growth of the global Medium and Heavy Weapons market. The analysts authoring the report have closely studied key strategies adopted by top players of the global Medium and Heavy Weapons market. The report includes SWOT, and other market analyses to provide a clear and deep understanding of important aspects of the global Medium and Heavy Weapons market. Readers of the report can become informed about current and future trends of the global Medium and Heavy Weapons market and how they will impact market growth during the forecast period.
By Company
- Lockheed Martin
- Raytheon Technologies
- Boeing
- Northrop Grumman
- General Dynamics
- BAE Systems
- NORINCO Group
- L3Harris Technologies
- Airbus
- Leonardo
- Thales
- Almaz-Antey
- Rheinmetall
- Elbit Systems
- Saab
- Indian Ordnance Factories
Segment by Type
Medium Weapons
- Heavy Weapons
Segment by Application
- Defense
- Homeland Security
By Region
- North America
- United States
- Canada
- Mexico
- Asia-Pacific
- China
- Japan
- South Korea
- India
- Australia
- Southeast Asia
- Others
Europe
- Germany
- France
- U.K.
- Italy
- Russia
- Others
- South America
- Brazil
- Argentina
- Others
- Middle East & Africa
- Turkey
- Saudi Arabia
- Israel
- Others
TABLE OF CONTENTS
1 Report Overview
- 1.1 Study Scope
- 1.2 Market Analysis by Type
- 1.2.1 Global Medium and Heavy Weapons Market Size Growth Rate by Type: 2017 VS 2021 VS 2028
- 1.2.2 Medium Weapons
- 1.2.3 Heavy Weapons
- 1.3 Market by Application
- 1.4 Study Objectives
- 1.5 Years Considered
2 Market Perspective
- 2.1 Global Medium and Heavy Weapons Market Size 2017-2028
- 2.2 Medium and Heavy Weapons Market Size across Key Geographies Worldwide: 2017 VS 2021 VS 2028
- 2.3 Global Medium and Heavy Weapons Market Size by Region (2017-2022)
- 2.4 Global Medium and Heavy Weapons Market Size Forecast by Region (2023-2028)
- 2.5 Global Top 10 Medium and Heavy Weapons Countries Ranking by Market Size
3 Medium and Heavy Weapons Competition by Company
- 3.1 Global Medium and Heavy Weapons Revenue by Players
- 3.1.1 Global Medium and Heavy Weapons Revenue by Players (2017-2022)
- 3.1.2 Global Medium and Heavy Weapons Market Share by Players (2017-2022)
- 3.2 Global Medium and Heavy Weapons Market Share by Company Type (Tier 1, Tier 2, and Tier 3)
- 3.3 Company Covered: Ranking by Medium and Heavy Weapons Revenue
- 3.4 Global Medium and Heavy Weapons Market Concentration Ratio
- 3.4.1 Global Medium and Heavy Weapons Market Concentration Ratio (CR5 and HHI)
- 3.4.2 Global Top 10 and Top 5 Companies by Medium and Heavy Weapons Revenue in 2021
- 3.5 Global Medium and Heavy Weapons Key Players Head office and Area Served
- 3.6 Key Players Medium and Heavy Weapons Product Solution and Service
- 3.7 Established Date of Medium and Heavy Weapons Market
- 3.8 Mergers & Acquisitions, Expansion Plans
4 Global Medium and Heavy Weapons Breakdown Data by Type
- 4.1 Global Medium and Heavy Weapons Historic Market Size by Type (2017-2022)
- 4.2 Global Medium and Heavy Weapons Forecasted Market Size by Type (2023-2028)
5 Global Medium and Heavy Weapons Breakdown Data by Application
- 5.1 Global Medium and Heavy Weapons Historic Market Size by Application (2017-2022)
- 5.2 Global Medium and Heavy Weapons Forecasted Market Size by Application (2023-2028)
6 North America
- 6.1 North America Medium and Heavy Weapons Revenue by Company (2020-2022)
- 6.2 North America Medium and Heavy Weapons Revenue by Type (2017-2028)
- 6.3 North America Medium and Heavy Weapons Revenue by Application (2017-2028)
- 6.4 North America Medium and Heavy Weapons Revenue by Country (2017-2028)
- 6.4.1 United States
- 6.4.2 Canada
- 6.4.3 Mexico
7 Europe
- 7.1 Europe Medium and Heavy Weapons Revenue by Company (2020-2022)
- 7.2 Europe Medium and Heavy Weapons Revenue by Type (2017-2028)
- 7.3 Europe Medium and Heavy Weapons Revenue by Application (2017-2028)
- 7.4 Europe Medium and Heavy Weapons Revenue by Country (2017-2028)
- 7.4.1 Germany
- 7.4.2 France
- 7.4.3 U.K.
- 7.4.4 Italy
- 7.4.5 Russia
8 Asia Pacific
- 8.1 Asia Pacific Medium and Heavy Weapons Revenue by Company (2020-2022)
- 8.2 Asia Pacific Medium and Heavy Weapons Revenue by Type (2017-2028)
- 8.3 Asia Pacific Medium and Heavy Weapons Revenue by Application (2017-2028)
- 8.4 Asia Pacific Medium and Heavy Weapons Revenue by Region (2017-2028)
- 8.4.1 China
- 8.4.2 Japan
- 8.4.3 South Korea
- 8.4.4 India
- 8.4.5 Australia
- 8.4.6 Southeast Asia
9 South America
- 9.1 South America Medium and Heavy Weapons Revenue by Company (2017-2022)
- 9.2 South America Medium and Heavy Weapons Revenue by Type (2017-2028)
- 9.3 South America Medium and Heavy Weapons Revenue by Application (2017-2028)
- 9.4 South America Medium and Heavy Weapons Revenue by Country (2017-2028)
- 9.4.1 Brazil
- 9.4.2 Argentina
10 Middle East and Africa
- 10.1 Middle East and Africa Medium and Heavy Weapons Revenue by Company (2017-2022)
- 10.2 Middle East and Africa Medium and Heavy Weapons Revenue by Type (2017-2028)
- 10.3 Middle East and Africa Medium and Heavy Weapons Revenue by Application (2017-2028)
- 10.4 Middle East and Africa Medium and Heavy Weapons Revenue by Country (2017-2028)
- 10.4.1 Turkey
- 10.4.2 Saudi Arabia
- 10.4.3 Israel
11 Company Profiles
- 11.1 Lockheed Martin
- 11.1.1 Lockheed Martin Company Details
- 11.1.2 Lockheed Martin Business Overview
- 11.1.3 Lockheed Martin Medium and Heavy Weapons Products and Services
- 11.1.4 Lockheed Martin Revenue in Medium and Heavy Weapons Business (2017-2022)
- 11.2 Raytheon Technologies
- 11.2.1 Raytheon Technologies Company Details
- 11.2.2 Raytheon Technologies Business Overview
- 11.2.3 Raytheon Technologies Medium and Heavy Weapons Products and Services
- 11.2.4 Raytheon Technologies Revenue in Medium and Heavy Weapons Business (2017-2022)
- 11.3 Boeing
- 11.3.1 Boeing Company Details
- 11.3.2 Boeing Business Overview
- 11.3.3 Boeing Medium and Heavy Weapons Products and Services
- 11.3.4 Boeing Revenue in Medium and Heavy Weapons Business (2017-2022)
- 11.4 Northrop Grumman
- 11.4.1 Northrop Grumman Company Details
- 11.4.2 Northrop Grumman Business Overview
- 11.4.3 Northrop Grumman Medium and Heavy Weapons Products and Services
- 11.4.4 Northrop Grumman Revenue in Medium and Heavy Weapons Business (2017-2022)
- 11.5 General Dynamics
- 11.5.1 General Dynamics Company Details
- 11.5.2 General Dynamics Business Overview
- 11.5.3 General Dynamics Medium and Heavy Weapons Products and Services
- 11.5.4 General Dynamics Revenue in Medium and Heavy Weapons Business (2017-2022)
- 11.6 BAE Systems
- 11.6.1 BAE Systems Company Details
- 11.6.2 BAE Systems Business Overview
- 11.6.3 BAE Systems Medium and Heavy Weapons Products and Services
- 11.6.4 BAE Systems Revenue in Medium and Heavy Weapons Business (2017-2022)
- 11.7 NORINCO Group
- 11.7.1 NORINCO Group Company Details
- 11.7.2 NORINCO Group Business Overview
- 11.7.3 NORINCO Group Medium and Heavy Weapons Products and Services
- 11.7.4 NORINCO Group Revenue in Medium and Heavy Weapons Business (2017-2022)
- 11.8 L3Harris Technologies
- 11.8.1 L3Harris Technologies Company Details
- 11.8.2 L3Harris Technologies Business Overview
- 11.8.3 L3Harris Technologies Medium and Heavy Weapons Products and Services
- 11.8.4 L3Harris Technologies Revenue in Medium and Heavy Weapons Business (2017-2022)
- 11.9 Airbus
- 11.9.1 Airbus Company Details
- 11.9.2 Airbus Business Overview
- 11.9.3 Airbus Medium and Heavy Weapons Products and Services
- 11.9.4 Airbus Revenue in Medium and Heavy Weapons Business (2017-2022)
- 11.10 Leonardo
- 11.10.1 Leonardo Company Details
- 11.10.2 Leonardo Business Overview
- 11.10.3 Leonardo Medium and Heavy Weapons Products and Services
- 11.10.4 Leonardo Revenue in Medium and Heavy Weapons Business (2017-2022)
- 11.11 Thales
- 11.11.1 Thales Company Details
- 11.11.2 Thales Business Overview
- 11.11.3 Thales Medium and Heavy Weapons Products and Services
- 11.11.4 Thales Revenue in Medium and Heavy Weapons Business (2017-2022)
- 11.12 Almaz-Antey
- 11.12.1 Almaz-Antey Company Details
- 11.12.2 Almaz-Antey Business Overview
- 11.12.3 Almaz-Antey Medium and Heavy Weapons Products and Services
- 11.12.4 Almaz-Antey Revenue in Medium and Heavy Weapons Business (2017-2022)
- 11.13 Rheinmetall
- 11.13.1 Rheinmetall Company Details
- 11.13.2 Rheinmetall Business Overview
- 11.13.3 Rheinmetall Medium and Heavy Weapons Products and Services
- 11.13.4 Rheinmetall Revenue in Medium and Heavy Weapons Business (2017-2022)
- 11.14 Elbit Systems
- 11.14.1 Elbit Systems Company Details
- 11.14.2 Elbit Systems Business Overview
- 11.14.3 Elbit Systems Medium and Heavy Weapons Products and Services
- 11.14.4 Elbit Systems Revenue in Medium and Heavy Weapons Business (2017-2022)
- 11.15 Saab
- 11.15.1 Saab Company Details
- 11.15.2 Saab Business Overview
- 11.15.3 Saab Medium and Heavy Weapons Products and Services
- 11.15.4 Saab Revenue in Medium and Heavy Weapons Business (2017-2022)
- 11.16 Indian Ordnance Factories
- 11.16.1 Indian Ordnance Factories Company Details
- 11.16.2 Indian Ordnance Factories Business Overview
- 11.16.3 Indian Ordnance Factories Medium and Heavy Weapons Products and Services
- 11.16.4 Indian Ordnance Factories Revenue in Medium and Heavy Weapons Business (2017-2022)
12 Medium and Heavy Weapons Market Dynamics
- 12.1 Medium and Heavy Weapons Industry Trends
- 12.2 Medium and Heavy Weapons Market Drivers
- 12.3 Medium and Heavy Weapons Market Challenges and Restraints
13 Research Findings and Conclusion
14 Appendix
- 14.1 Research Methodology
- 14.1.1 Methodology/Research Approach
- 14.1.2 Data Source
- 14.2 Disclaimer
- 14.3 Author Details