|
|
市場調査レポート
商品コード
1073215
ポータブル圧力洗浄機の世界市場(2022年)Global Portable Pressure Washer Market Research Report 2022 |
||||||
|
|
|||||||
|
● お客様のご希望に応じて、既存データの加工や未掲載情報(例:国別セグメント)の追加などの対応が可能です。 詳細はお問い合わせください。 |
|||||||


| ポータブル圧力洗浄機の世界市場(2022年) |
|
出版日: 2022年05月07日
発行: QYResearch
ページ情報: 英文 174 Pages
納期: 2~3営業日
|
- 全表示
- 概要
- 図表
- 目次
世界のポータブル圧力洗浄機の市場規模は、2017年の22億9,879万米ドルから、2021年には26億7,512万米ドルに増加しました。
同市場は、2022年から2028年の間に3.30%のCAGRで推移し、2028年までに33億6,830万米ドルに達すると予測されています。
当レポートでは、世界のポータブル圧力洗浄機市場について調査し、市場規模や予測、タイプ・用途・企業・地域別の市場分析、市場力学、競合情勢、主要企業のプロファイルなどの情報を提供しています。
タイプ別セグメント
- 電気モーター
- ガソリンエンジン
- ディーゼルエンジン
用途別セグメント
- 家庭用
- 商用
- 産業用
目次
第1章 ポータブル圧力洗浄機の市場概要
- ポータブル圧力洗浄機の製品概要と範囲
- タイプ別セグメント
- 市場規模分析
- セグメント
- 用途別セグメント
- 消費比較
- セグメント
- 地域別:世界市場規模
- 地域別:市場規模推計・予測
- 北米の推計・予測(2017-2028)
- 欧州の推計・予測(2017-2028)
- アジア太平洋の推計・予測(2017-2028)
- 南米の推計・予測(2017-2028)
- 中東・アフリカの推計・予測(2017-2028)
- 世界市場の成長見通し
- 収益の推計・予測(2017-2028)
- 販売の推計・予測(2017-2028)
第2章 メーカー別:市場競争
- メーカー別:販売市場シェア(2020-2021)
- メーカー別:収益市場シェア(2020-2021)
- メーカー別:平均価格(2020-2021)
- メーカー情報
- 市場の競争状況と動向
第3章 地域別:ポータブル圧力洗浄機の消費
- 地域別:世界の消費
- 北米
- 国別:消費
- 国別:収益
- 米国
- カナダ
- メキシコ
- 欧州
- 国別:消費
- 国別:収益
- ドイツ
- フランス
- 英国
- イタリア
- ロシア
- アジア太平洋
- 地域別:消費
- 地域別:収益
- 中国
- 日本
- 韓国
- 東南アジア
- インド
- 南米
- 国別:消費
- 国別:収益
- アルゼンチン
- ブラジル
- 中東・アフリカ
- 国別:消費
- 国別:収益
- アフリカ
- 中東
第4章 タイプ別:売上、収益、価格動向
- タイプ別:販売市場シェア(2017-2022)
- タイプ別:収益市場シェア(2017-2022)
- タイプ別:価格(2017-2022)
第5章 用途別:消費分析
第6章 ポータブル圧力洗浄機の主要メーカーの分析
- Karcher
- Nilfisk
- Stihl
- Briggs&Stratton
- BOSCH
- TTI
- Generac
- Annovi Reverberi (AR)
- SUMEC
- Stanley Black & Decker
- Makita
- Shanghai Panda
- FNA Group
- Lavorwash
- Zhejiang Anlu
- Himore
- Alkota
- Jiangmen Zhongtianyizheng
- EHRLE
- Zhejiang Yili
- Taizhou Bounche
- Ousen
- Sun Joe
- Realm
第7章 ポータブル圧力洗浄機の製造コスト分析
- 主要原材料分析
- 製造コスト構造比
- 製造プロセス分析
第8章 マーケティングチャネル、ディストリビューター、顧客
- マーケティングチャネル
- ディストリビューター
第9章 市場力学
- 市場動向
- 課題
- 市場の有利・不利な要因
- 市場リスク
- 業界の障壁
- ポーターのファイブフォース分析
第10章 消費と需要予測
- 世界の予測と消費分析
- 北米:国別消費予測
- 欧州:国別消費予測
- アジア太平洋:地域別消費予測
- 南米:国別消費予測
- 中東・アフリカ:国別消費予測
第11章 タイプ・用途別:予測(2022-2028)
- タイプ別:世界の販売、収益、価格予測(2022-2028)
- 用途別:世界の消費予測(2022-2028)
第12章 調査結果と結論
第13章 調査手法と情報源
LIST OF TABLES
- Table 1. Global Portable Pressure Washer Market Size by Type (K Units) & (US$ Million)
- Table 2. Portable Pressure Washer Segment by Type
- Table 3. Electric Motor Portable Pressure Washer Segment by Type
- Table 4. Global Portable Pressure Washer Consumption (K Units) Comparison by Application
- Table 5. Portable Pressure Washer Segment by Application
- Table 6. Portable Pressure Washer Market Size Comparison by Region (K Units) (Million USD)
- Table 7. Global Portable Pressure Washer Sales (K Units) by Manufacturers (2020-2021)
- Table 8. Global Portable Pressure Washer Sales Market Share by Manufacturers (2020-2021)
- Table 9. Global Portable Pressure Washer Revenue (US$ Million) by Manufacturers (2020-2021)
- Table 10. Global Portable Pressure Washer Revenue Share by Manufacturers (2020-2021)
- Table 11. Global Market Portable Pressure Washer Average Price (USD/Unit) of Key Manufacturers (2020-2021)
- Table 12. Portable Pressure Washer Manufacturer Information
- Table 13. Global Portable Pressure Washer Manufacturers Market Concentration Ratio (CR5)
- Table 14. Global Portable Pressure Washer Consumption by Region (2017-2022) (K Units)
- Table 15. Global Portable Pressure Washer Consumption Market Share by Region (2017-2022)
- Table 16. Global Portable Pressure Washer Revenue by Region (2017-2022) (M USD)
- Table 17. Global Portable Pressure Washer Revenue Market Share by Region (2017-2022)
- Table 18. North America Portable Pressure Washer Consumption by Countries (2017-2022) (K Units)
- Table 19. North America Portable Pressure Washer Revenue by Countries (2017-2022) (M USD)
- Table 20. Europe Portable Pressure Washer Consumption by Countries (2017-2022) (K Units)
- Table 21. Europe Portable Pressure Washer Revenue by Countries (2017-2022) (M USD)
- Table 22. Asia Pacific Portable Pressure Washer Consumption by Region (2017-2022) (K Units)
- Table 23. Asia Pacific Portable Pressure Washer Revenue by Region (2017-2022) (M USD)
- Table 24. South America Portable Pressure Washer Consumption by Countries (2017-2022) (K Units)
- Table 25. South America Portable Pressure Washer Revenue by Countries (2017-2022) (M USD)
- Table 26. Mideast & Africa Portable Pressure Washer Consumption by Countries (2017-2022) (K Units)
- Table 27. Mideast & Africa Portable Pressure Washer Revenue by Countries (2017-2022) (M USD)
- Table 28. Global Portable Pressure Washer Sales (K Units) by Type (2017-2022)
- Table 29. Global Portable Pressure Washer Sales Market Share by Type (2017-2022)
- Table 30. Global Portable Pressure Washer Revenue (US$ Million) by Type (2017-2022)
- Table 31. Global Portable Pressure Washer Revenue Share by Type (2017-2022)
- Table 32. Global Portable Pressure Washer Price (USD/Unit) by Type (2017-2022)
- Table 33. Global Portable Pressure Washer Consumption (K Units) by Application (2017-2022)
- Table 34. Global Portable Pressure Washer Consumption Market Share by Application (2017-2022)
- Table 35. Table Karcher Information List
- Table 36. Figure Portable Pressure Washer Information of Karcher
- Table 37. Table Portable Pressure Washer Sales (K Units), Price (USD/Unit), Revenue (M USD) and Gross Margin of Karcher 2020-2021
- Table 38. Table Nilfisk Information List
- Table 39. Figure Portable Pressure Washer Information of Nilfisk
- Table 40. Table Portable Pressure Washer Sales (K Units), Price (USD/Unit), Revenue (M USD) and Gross Margin of Nilfisk 2020-2021
- Table 41. Table Stihl Information List
- Table 42. Figure Portable Pressure Washer Information of Stihl
- Table 43. Table Portable Pressure Washer Sales (K Units), Price (USD/Unit), Revenue (M USD) and Gross Margin of Stihl 2020-2021
- Table 44. Table Briggs&Stratton Information List
- Table 45. Figure Portable Pressure Washer Information of Briggs&Stratton
- Table 46. Table Portable Pressure Washer Sales (K Units), Price (USD/Unit), Revenue (M USD) and Gross Margin of Briggs&Stratton 2020-2021
- Table 47. Table BOSCH Information List
- Table 48. Figure Portable Pressure Washer Information of BOSCH
- Table 49. Table Portable Pressure Washer Sales (K Units), Price (USD/Unit), Revenue (M USD) and Gross Margin of BOSCH 2020-2021
- Table 50. Table TTI Information List
- Table 51. Figure Portable Pressure Washer Information of TTI
- Table 52. Table Portable Pressure Washer Sales (K Units), Price (USD/Unit), Revenue (M USD) and Gross Margin of TTI 2020-2021
- Table 53. Table Generac Information List
- Table 54. Figure Portable Pressure Washer Information of Generac
- Table 55. Table Portable Pressure Washer Sales (K Units), Price (USD/Unit), Revenue (M USD) and Gross Margin of Generac 2020-2021
- Table 56. Table Annovi Reverberi (AR) Information List
- Table 57. Figure Portable Pressure Washer Information of Annovi Reverberi (AR)
- Table 58. Table Portable Pressure Washer Sales (K Units), Price (USD/Unit), Revenue (M USD) and Gross Margin of Annovi Reverberi (AR) 2020-2021
- Table 59. Table SUMEC Information List
- Table 60. Figure Portable Pressure Washer Information of SUMEC
- Table 61. Table Portable Pressure Washer Sales (K Units), Price (USD/Unit), Revenue (M USD) and Gross Margin of SUMEC 2020-2021
- Table 62. Table Stanley Black & Decker Information List
- Table 63. Figure Portable Pressure Washer Information of Stanley Black & Decker
- Table 64. Table Portable Pressure Washer Sales (K Units), Price (USD/Unit), Revenue (M USD) and Gross Margin of Stanley Black & Decker 2020-2021
- Table 65. Table Makita Information List
- Table 66. Figure Portable Pressure Washer Information of Makita
- Table 67. Table Portable Pressure Washer Sales (K Units), Price (USD/Unit), Revenue (M USD) and Gross Margin of Makita 2020-2021
- Table 68. Table Shanghai Panda Information List
- Table 69. Figure Portable Pressure Washer Information of Shanghai Panda
- Table 70. Table Portable Pressure Washer Sales (K Units), Price (USD/Unit), Revenue (M USD) and Gross Margin of Shanghai Panda 2020-2021
- Table 71. Table FNA Group Information List
- Table 72. Figure Portable Pressure Washer Information of FNA Group
- Table 73. Table Portable Pressure Washer Sales (K Units), Price (USD/Unit), Revenue (M USD) and Gross Margin of FNA Group 2020-2021
- Table 74. Table Lavorwash Information List
- Table 75. Figure Portable Pressure Washer Information of Lavorwash
- Table 76. Table Portable Pressure Washer Sales (K Units), Price (USD/Unit), Revenue (M USD) and Gross Margin of Lavorwash 2020-2021
- Table 77. Table Zhejiang Anlu Information List
- Table 78. Figure Portable Pressure Washer Information of Zhejiang Anlu
- Table 79. Table Portable Pressure Washer Sales (K Units), Price (USD/Unit), Revenue (M USD) and Gross Margin of Zhejiang Anlu 2020-2021
- Table 80. Table Himore Information List
- Table 81. Figure Portable Pressure Washer Information of Himore
- Table 82. Table Portable Pressure Washer Sales (K Units), Price (USD/Unit), Revenue (M USD) and Gross Margin of Himore 2020-2021
- Table 83. Table Alkota Information List
- Table 84. Figure Portable Pressure Washer Information of Alkota
- Table 85. Table Portable Pressure Washer Sales (K Units), Price (USD/Unit), Revenue (M USD) and Gross Margin of Alkota 2020-2021
- Table 86. Table Jiangmen Zhongtianyizheng Information List
- Table 87. Figure Portable Pressure Washer Information of Jiangmen Zhongtianyizheng
- Table 88. Table Portable Pressure Washer Sales (K Units), Price (USD/Unit), Revenue (M USD) and Gross Margin of Jiangmen Zhongtianyizheng 2020-2021
- Table 89. Table EHRLE Information List
- Table 90. Figure Portable Pressure Washer Information of EHRLE
- Table 91. Table Portable Pressure Washer Sales (K Units), Price (USD/Unit), Revenue (M USD) and Gross Margin of EHRLE 2020-2021
- Table 92. Table Zhejiang Yili Information List
- Table 93. Figure Portable Pressure Washer Information of Zhejiang Yili
- Table 94. Table Portable Pressure Washer Sales (K Units), Price (USD/Unit), Revenue (M USD) and Gross Margin of Zhejiang Yili 2020-2021
- Table 95. Table Taizhou Bounche Information List
- Table 96. Figure Portable Pressure Washer Information of Taizhou Bounche
- Table 97. Table Portable Pressure Washer Sales (K Units), Price (USD/Unit), Revenue (M USD) and Gross Margin of Taizhou Bounche 2020-2021
- Table 98. Table Ousen Information List
- Table 99. Figure Portable Pressure Washer Information of Ousen
- Table 100. Table Portable Pressure Washer Sales (K Units), Price (USD/Unit), Revenue (M USD) and Gross Margin of Ousen 2020-2021
- Table 101. Table Sun Joe Information List
- Table 102. Figure Portable Pressure Washer Information of Sun Joe
- Table 103. Table Portable Pressure Washer Sales (K Units), Price (USD/Unit), Revenue (M USD) and Gross Margin of Sun Joe 2020-2021
- Table 104. Table Realm Information List
- Table 105. Figure Portable Pressure Washer Information of Realm
- Table 106. Table Portable Pressure Washer Sales (K Units), Price (USD/Unit), Revenue (M USD) and Gross Margin of Realm 2020-2021
- Table 107. Key Raw Materials
- Table 108. Market Key Trends
- Table 109. Key Challenges
- Table 110. Market Favorable Factors and Unfavorable Factors
- Table 111. Market Risks
- Table 112. Industry Enters Major Barriers
- Table 113. North America Portable Pressure Washer Consumption Forecast 2022-2028 (K Units) by Country
- Table 114. Europe Portable Pressure Washer Consumption Forecast 2022-2028 (K Units) by Country
- Table 115. Asia Pacific Portable Pressure Washer Consumption Forecast 2022-2028 (K Units) by Country
- Table 116. South America Portable Pressure Washer Consumption Forecast 2022-2028 (K Units) by Country
- Table 117. Mideast & Africa Portable Pressure Washer Consumption Forecast 2022-2028 (K Units) by Country
- Table 118. Global Portable Pressure Washer Sales (K Units) Forecast by Type (2022-2028)
- Table 119. Global Portable Pressure Washer Revenue (US$ Million) Forecast by Type (2022-2028)
- Table 120. Global Portable Pressure Washer Price (USD/Unit) Forecast by Type (2022-2028)
- Table 121. Global Portable Pressure Washer Consumption (K Units) Forecast by Application (2022-2028)
- Table 122. Research Programs/Design for This Report
- Table 123. Key Data Information from Secondary Sources
- Table 124. Key Data Information from Primary Sources
List of Figures
- Figure 1. Product Picture of Portable Pressure Washer
- Figure 2. Global Portable Pressure Washer Market Volume Share by Type: 2021
- Figure 3. Global Portable Pressure Washer Market Share by Application: 2021
- Figure 4. North America Portable Pressure Washer Revenue (US$ Million) Growth Rate (2017-2028)
- Figure 5. Europe Portable Pressure Washer Revenue (US$ Million) Growth Rate (2017-2028)
- Figure 6. Asia-Pacific Portable Pressure Washer Revenue (US$ Million) Growth Rate (2017-2028)
- Figure 7. South America Portable Pressure Washer Revenue (US$ Million) Growth Rate (2017-2028)
- Figure 8. Mideast & Africa Portable Pressure Washer Revenue (US$ Million) Growth Rate (2017-2028)
- Figure 9. Global Portable Pressure Washer Revenue (US$ Million) (2017-2028)
- Figure 10. Global Portable Pressure Washer Sales (K Units) (2017-2028)
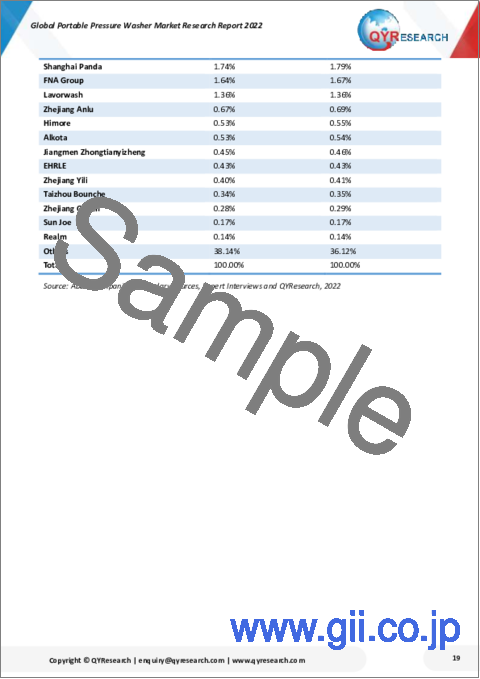
- Figure 11. Portable Pressure Washer Sales Share by Manufacturers in 2021
- Figure 12. Global Portable Pressure Washer Revenue Share by Manufacturers in 2021
- Figure 13. The Global 5 Largest Players: Market Share by Portable Pressure Washer Revenue in 2021
- Figure 14. Global Portable Pressure Washer Consumption Market Share by Region in 2021
- Figure 15. Global Portable Pressure Washer Revenue Market Share by Region in 2021
- Figure 16. North America Portable Pressure Washer Consumption and Growth Rate (2017-2022) (K Units)
- Figure 17. North America Portable Pressure Washer Revenue and Growth Rate (2017-2022) (M USD)
- Figure 18. North America Portable Pressure Washer Consumption Market Share by Countries in 2021
- Figure 19. North America Portable Pressure Washer Revenue Market Share by Countries in 2021
- Figure 20. U.S. Portable Pressure Washer Consumption and Growth Rate (2017-2022) (K Units)
- Figure 21. Canada Portable Pressure Washer Consumption (K Units) and Growth Rate (2017-2022)
- Figure 22. Mexico Portable Pressure Washer Consumption (K Units) and Growth Rate (2017-2022)
- Figure 23. Europe Portable Pressure Washer Consumption and Growth Rate (2017-2022) (K Units)
- Figure 24. Europe Portable Pressure Washer Revenue and Growth Rate (2017-2022) (M USD)
- Figure 25. Europe Portable Pressure Washer Consumption Market Share by Countries in 2021
- Figure 26. Europe Portable Pressure Washer Revenue Market Share by Countries in 2021
- Figure 27. Germany Portable Pressure Washer Consumption and Growth Rate (2017-2022) (K Units)
- Figure 28. France Portable Pressure Washer Consumption and Growth Rate (2017-2022) (K Units)
- Figure 29. U.K. Portable Pressure Washer Consumption and Growth Rate (2017-2022) (K Units)
- Figure 30. Italy Portable Pressure Washer Consumption and Growth Rate (2017-2022) (K Units)
- Figure 31. Russia Portable Pressure Washer Consumption and Growth Rate (2017-2022) (K Units)
- Figure 32. Asia Pacific Portable Pressure Washer Consumption and Growth Rate (K Units)
- Figure 33. Asia Pacific Portable Pressure Washer Revenue and Growth Rate (2017-2022) (M USD)
- Figure 34. Asia Pacific Portable Pressure Washer Consumption Market Share by Region in 2021
- Figure 35. Asia Pacific Portable Pressure Washer Revenue Market Share by Region in 2021
- Figure 36. China Portable Pressure Washer Consumption and Growth Rate (2017-2022) (K Units)
- Figure 37. Japan Portable Pressure Washer Consumption and Growth Rate (2017-2022) (K Units)
- Figure 38. South Korea Portable Pressure Washer Consumption and Growth Rate (2017-2022) (K Units)
- Figure 39. Southeast Asia Portable Pressure Washer Consumption and Growth Rate (2017-2022) (K Units)
- Figure 40. India Portable Pressure Washer Consumption and Growth Rate (2017-2022) (K Units)
- Figure 41. South America Portable Pressure Washer Consumption and Growth Rate (K Units)
- Figure 42. South America Portable Pressure Washer Revenue and Growth Rate (2017-2022) (M USD)
- Figure 43. South America Portable Pressure Washer Consumption Market Share by Countries in 2021
- Figure 44. South America Portable Pressure Washer Revenue Market Share by Countries in 2021
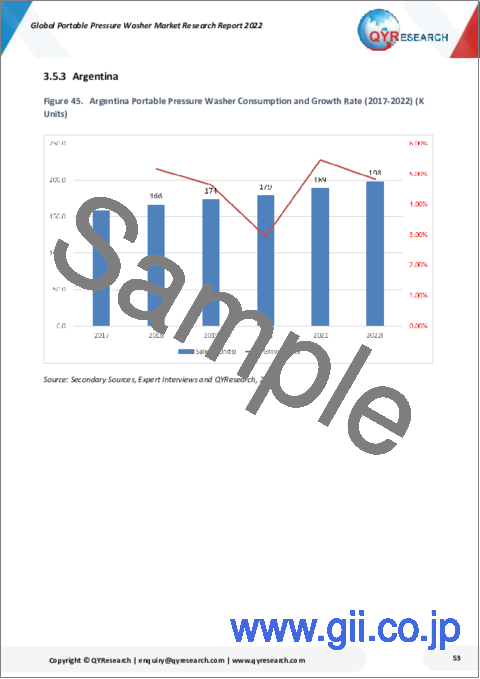
- Figure 45. Argentina Portable Pressure Washer Consumption and Growth Rate (2017-2022) (K Units)
- Figure 46. Brazil Portable Pressure Washer Consumption and Growth Rate (2017-2022) (K Units)
- Figure 47. Mideast & Africa Portable Pressure Washer Consumption and Growth Rate (K Units)
- Figure 48. Mideast & Africa Portable Pressure Washer Revenue and Growth Rate (2017-2022) (M USD)
- Figure 49. Mideast & Africa Portable Pressure Washer Consumption Market Share by Countries in 2021
- Figure 50. Mideast & Africa Portable Pressure Washer Revenue Market Share by Countries in 2021
- Figure 51. Africa Portable Pressure Washer Consumption and Growth Rate (2017-2022) (K Units)
- Figure 52. Middle East Portable Pressure Washer Consumption and Growth Rate (2017-2022) (K Units)
- Figure 53. Sales Market Share of Portable Pressure Washer by Type in 2021
- Figure 54. Revenue Market Share of Portable Pressure Washer by Type in 2021
- Figure 55. Global Portable Pressure Washer Consumption Market Share by Application in 2021
- Figure 56. Key Raw Materials Steel Price Trend (Yuan/MT)
- Figure 57. Key Raw Materials Aluminum Price Trend (USD/Tonne)
- Figure 58. Key Raw Materials Copper Price Trend (USD/LB)
- Figure 59. Manufacturing Cost Structure of Portable Pressure Washer
- Figure 60. Manufacturing Process Analysis of Portable Pressure Washer
- Figure 61. Channels of Distribution
- Figure 62. Distributors Profiles
- Figure 63. Porter's Five Forces Analysis
- Figure 64. Global Forecasted and Consumption Analysis of Portable Pressure Washer
- Figure 65. North America Portable Pressure Washer Consumption Forecast 2022-2028 (K Units)
- Figure 66. Europe Portable Pressure Washer Consumption Forecast 2022-2028 (K Units)
- Figure 67. Asia Pacific Portable Pressure Washer Consumption Forecast 2022-2028 (K Units)
- Figure 68. South America Portable Pressure Washer Consumption Forecast 2022-2028 (K Units)
- Figure 69. Mideast & Africa Portable Pressure Washer Consumption Forecast 2022-2028 (K Units)
- Figure 70. Global Portable Pressure Washer Sales Market Share Forecast by Type 2028
- Figure 71. Global Portable Pressure Washer Revenue Market Share Forecast by Type 2028
- Figure 72. Global Portable Pressure Washer Consumption Share by Application 2028
- Figure 73. Bottom-up and Top-down Approaches for This Report
- Figure 74. Data Triangulation
Market Analysis and Insights:
In 2021, the global Portable Pressure Washer market size was increased to 2675.12 million US$ from 2298.79 million US$ in 2017, and it will reach 3368.30 million US$ in 2028, growing at CAGR of 3.30% between 2022 and 2028.
Drivers and Restrains:
The research report has incorporated the analysis of different factors that augment the market's growth. It constitutes trends, restraints, and drivers that transform the market in either a positive or negative manner. This section also provides the scope of different segments and applications that can potentially influence the market in the future. The detailed information is based on current trends and historic milestones. This section also provides an analysis of the volume of production about the global market and also about each type from 2017 to 2028. Pricing analysis is included in the report according to each type from the year 2017 to 2028, manufacturer from 2018 to 2021, region from 2017 to 2028, and global price from 2017 to 2028.
A thorough evaluation of the restrains included in the report portrays the contrast to drivers and gives room for strategic planning. Factors that overshadow the market growth are pivotal as they can be understood to devise different bends for getting hold of the lucrative opportunities that are present in the ever-growing market. Additionally, insights into market expert's opinions have been taken to understand the market better.
Segment Analysis:
The research report includes specific segments by region (country), by manufacturers, by Type and by Application. Each type provides information about the production during the forecast period of 2017 to 2028. by Application segment also provides consumption during the forecast period of 2017 to 2028. Understanding the segments helps in identifying the importance of different factors that aid the market growth.
By Company
- Karcher
- Nilfisk
- Stihl
- Briggs&Stratton
- BOSCH
- TTI
- Generac
- Annovi Reverberi (AR)
- SUMEC
- Stanley Black & Decker
- Makita
- Shanghai Panda
- FNA Group
- Lavorwash
- Zhejiang Anlu
- Himore
- Alkota
- Jiangmen Zhongtianyizheng
- EHRLE
- Zhejiang Yili
- Taizhou Bounche
- Zhejiang Ousen
- Sun Joe
- Realm
Segment by Type
- Electric Motor
- Petrol Engine
- Diesel Engine
Segment by Application
- Residential
- Commercial
- Industrial
Consumption by Region
- North America
- United States
- Canada
- Mexico
- Asia-Pacific
- China
- Japan
- South Korea
- India
- Southeast Asia
- Europe
- Germany
- United Kingdom
- France
- Italy
- Russia
- South America
- Brazil
- Argentina
- Mideast & Africa
TABLE OF CONTENTS
1 PORTABLE PRESSURE WASHER MARKET OVERVIEW
- 1.1 Product Overview and Scope of Portable Pressure Washer
- 1.2 Portable Pressure Washer Segment by Type
- 1.2.1 Global Portable Pressure Washer Market Size Analysis by Type
- 1.2.2 Portable Pressure Washer Segment by Type
- 1.3 Portable Pressure Washer Segment by Application
- 1.3.1 Global Portable Pressure Washer Consumption Comparison by Application
- 1.3.2 Portable Pressure Washer Segment by Application
- 1.4 Global Market Size by Region
- 1.4.1 Global Portable Pressure Washer Market Size Estimates and Forecasts by Region
- 1.4.2 North America Portable Pressure Washer Estimates and Forecasts (2017-2028)
- 1.4.3 Europe Portable Pressure Washer Estimates and Forecasts (2017-2028)
- 1.4.4 Asia-Pacific Portable Pressure Washer Estimates and Forecasts (2017-2028)
- 1.4.5 South America Portable Pressure Washer Estimates and Forecasts (2017-2028)
- 1.4.6 Mideast & Africa Portable Pressure Washer Estimates and Forecasts (2017-2028)
- 1.5 Global Market Growth Prospects
- 1.5.1 Global Portable Pressure Washer Revenue Estimates and Forecasts (2017-2028)
- 1.5.2 Global Portable Pressure Washer Sales Estimates and Forecasts (2017-2028)
2 MARKET COMPETITION BY MANUFACTURERS
- 2.1 Global Portable Pressure Washer Sales Market Share by Manufacturers (2020-2021)
- 2.2 Global Portable Pressure Washer Revenue Market Share by Manufacturers (2020-2021)
- 2.3 Global Portable Pressure Washer Average Price by Manufacturers (2020-2021)
- 2.4 Portable Pressure Washer Manufacturer Information
- 2.5 Portable Pressure Washer Market Competitive Situation and Trends
- 2.5.1 Portable Pressure Washer Market Concentration Rate
- 2.5.2 Global 5 Largest Portable Pressure Washer Players Market Share by Revenue
3 PORTABLE PRESSURE WASHER CONSUMPTION BY REGION
- 3.1 Global Portable Pressure Washer Consumption by Region
- 3.1.1 Global Portable Pressure Washer Consumption by Region
- 3.1.2 Global Portable Pressure Washer Consumption Market Share by Region
- 3.1.3 Global Portable Pressure Washer Revenue by Region
- 3.1.4 Global Portable Pressure Washer Revenue Market Share by Region
- 3.2 North America
- 3.2.1 North America Portable Pressure Washer Consumption by Countries
- 3.2.2 North America Portable Pressure Washer Revenue by Countries
- 3.2.3 U.S.
- 3.2.4 Canada
- 3.2.5 Mexico
- 3.3 Europe
- 3.3.1 Europe Portable Pressure Washer Consumption by Countries
- 3.3.2 Europe Portable Pressure Washer Revenue by Countries
- 3.3.3 Germany
- 3.3.4 France
- 3.3.5 U.K.
- 3.3.6 Italy
- 3.3.7 Russia
- 3.4 Asia Pacific
- 3.4.1 Asia Pacific Portable Pressure Washer Consumption by Region
- 3.4.2 Asia Pacific Portable Pressure Washer Revenue by Region
- 3.4.3 China
- 3.4.4 Japan
- 3.4.5 South Korea
- 3.4.6 Southeast Asia
- 3.4.7 India
- 3.5 South America
- 3.5.1 South America Portable Pressure Washer Consumption by Countries
- 3.5.2 South America Portable Pressure Washer Revenue by Countries
- 3.5.3 Argentina
- 3.5.4 Brazil
- 3.6 Mideast & Africa
- 3.6.1 Mideast & Africa Portable Pressure Washer Consumption by Countries
- 3.6.2 Mideast & Africa Portable Pressure Washer Revenue by Countries
- 3.6.3 Africa
- 3.6.4 Middle East
4 SALES, REVENUE, PRICE TREND BY TYPE
- 4.1 Global Portable Pressure Washer Sales Market Share by Type (2017-2022)
- 4.2 Global Portable Pressure Washer Revenue Market Share by Type (2017-2022)
- 4.3 Global Portable Pressure Washer Price by Type (2017-2022)
5 CONSUMPTION ANALYSIS BY APPLICATION
6 MAJOR MANUFACTURERS ANALYSIS OF PORTABLE PRESSURE WASHER
- 6.1 Karcher
- 6.1.1 Company Profile
- 6.1.2 Product Information
- 6.1.3 Sales, Price, Gross Margin and Revenue
- 6.1.4 Contact Information
- 6.2 Nilfisk
- 6.2.1 Company Profile
- 6.2.2 Product Information
- 6.2.3 Sales, Price, Gross Margin and Revenue
- 6.2.4 Contact Information
- 6.3 Stihl
- 6.3.1 Company Profile
- 6.3.2 Product Information
- 6.3.3 Sales, Price, Gross Margin and Revenue
- 6.3.4 Contact Information
- 6.4 Briggs&Stratton
- 6.4.1 Company Profile
- 6.4.2 Product Information
- 6.4.3 Sales, Price, Gross Margin and Revenue
- 6.4.4 Contact Information
- 6.5 BOSCH
- 6.5.1 Company Profile
- 6.5.2 Product Information
- 6.5.3 Sales, Price, Gross Margin and Revenue
- 6.5.4 Contact Information
- 6.6 TTI
- 6.6.1 Company Profile
- 6.6.2 Product Information
- 6.6.3 Sales, Price, Gross Margin and Revenue
- 6.6.4 Contact Information
- 6.7 Generac
- 6.7.1 Company Profile
- 6.7.2 Product Information
- 6.7.3 Sales, Price, Gross Margin and Revenue
- 6.7.4 Contact Information
- 6.8 Annovi Reverberi (AR)
- 6.8.1 Company Profile
- 6.8.2 Product Information
- 6.8.3 Sales, Price, Gross Margin and Revenue
- 6.8.4 Contact Information
- 6.9 SUMEC
- 6.9.1 Company Profile
- 6.9.2 Product Information
- 6.9.3 Sales, Price, Gross Margin and Revenue
- 6.9.4 Contact Information
- 6.10 Stanley Black & Decker
- 6.10.1 Company Profile
- 6.10.2 Product Information
- 6.10.3 Sales, Price, Gross Margin and Revenue
- 6.10.4 Contact Information
- 6.11 Makita
- 6.11.1 Company Profile
- 6.11.2 Product Information
- 6.11.3 Sales, Price, Gross Margin and Revenue
- 6.11.4 Contact Information
- 6.12 Shanghai Panda
- 6.12.1 Company Profile
- 6.12.2 Product Information
- 6.12.3 Sales, Price, Gross Margin and Revenue
- 6.12.4 Contact Information
- 6.13 FNA Group
- 6.13.1 Company Profile
- 6.13.2 Product Information
- 6.13.3 Sales, Price, Gross Margin and Revenue
- 6.13.4 Contact Information
- 6.14 Lavorwash
- 6.14.1 Company Profile
- 6.14.2 Product Information
- 6.14.3 Sales, Price, Gross Margin and Revenue
- 6.14.4 Contact Information
- 6.15 Zhejiang Anlu
- 6.15.1 Company Profile
- 6.15.2 Product Information
- 6.15.3 Sales, Price, Gross Margin and Revenue
- 6.15.4 Contact Information
- 6.16 Himore
- 6.16.1 Company Profile
- 6.16.2 Product Information
- 6.16.3 Sales, Price, Gross Margin and Revenue
- 6.16.4 Contact Information
- 6.17 Alkota
- 6.17.1 Company Profile
- 6.17.2 Product Information
- 6.17.3 Sales, Price, Gross Margin and Revenue
- 6.17.4 Contact Information
- 6.18 Jiangmen Zhongtianyizheng
- 6.18.1 Company Profile
- 6.18.2 Product Information
- 6.18.3 Sales, Price, Gross Margin and Revenue
- 6.18.4 Contact Information
- 6.19 EHRLE
- 6.19.1 Company Profile
- 6.19.2 Product Information
- 6.19.3 Sales, Price, Gross Margin and Revenue
- 6.19.4 Contact Information
- 6.20 Zhejiang Yili
- 6.20.1 Company Profile
- 6.20.2 Product Information
- 6.20.3 Sales, Price, Gross Margin and Revenue
- 6.20.4 Contact Information
- 6.21 Taizhou Bounche
- 6.21.1 Company Profile
- 6.21.2 Product Information
- 6.21.3 Sales, Price, Gross Margin and Revenue
- 6.21.4 Contact Information
- 6.22 Ousen
- 6.22.1 Company Profile
- 6.22.2 Product Information
- 6.22.3 Sales, Price, Gross Margin and Revenue
- 6.22.4 Contact Information
- 6.23 Sun Joe
- 6.23.1 Company Profile
- 6.23.2 Product Information
- 6.23.3 Sales, Price, Gross Margin and Revenue
- 6.23.4 Contact Information
- 6.24 Realm
- 6.24.1 Company Profile
- 6.24.2 Product Information
- 6.24.3 Sales, Price, Gross Margin and Revenue
- 6.24.4 Contact Information
7 PORTABLE PRESSURE WASHER MANUFACTURING COST ANALYSIS
- 7.1 Portable Pressure Washer Key Raw Materials Analysis
- 7.1.1 Key Raw Materials
- 7.1.2 Key Raw Materials Price Trend
- 7.2 Proportion of Manufacturing Cost Structure
- 7.3 Manufacturing Process Analysis of Portable Pressure Washer
8 MARKETING CHANNEL, DISTRIBUTORS AND CUSTOMERS
- 8.1 Marketing Channel
- 8.2 Portable Pressure Washer Distributors
9 MARKET DYNAMICS
- 9.1 Market Trends
- 9.2 Challenges
- 9.3 Market Favorable Factors and Unfavorable Factors
- 9.4 Market Risks
- 9.5 Industry Enters Major Barriers
- 9.6 Porter's Five Forces Analysis
10 CONSUMPTION AND DEMAND FORECAST
- 10.1 Global Forecasted and Consumption Analysis of Portable Pressure Washer
- 10.2 North America Forecasted Consumption of Portable Pressure Washer by Country
- 10.3 Europe Market Forecasted Consumption of Portable Pressure Washer by Country
- 10.4 Asia Pacific Market Forecasted Consumption of Portable Pressure Washer by Regions
- 10.5 South America Forecasted Consumption of Portable Pressure Washer
- 10.6 Mideast & Africa Forecasted Consumption of Portable Pressure Washer
11 FORECAST BY TYPE AND BY APPLICATION (2022-2028)
- 11.1 Global Sales, Revenue and Price Forecast by Type (2022-2028)
- 11.1.1 Global Forecasted Sales of Portable Pressure Washer by Type (2022-2028)
- 11.1.2 Global Forecasted Revenue of Portable Pressure Washer by Type (2022-2028)
- 11.1.3 Global Forecasted Price of Portable Pressure Washer by Type (2022-2028)
- 11.2 Global Forecasted Consumption of Portable Pressure Washer by Application (2022-2028)
12 RESEARCH FINDINGS AND CONCLUSION
13 METHODOLOGY AND DATA SOURCE
- 13.1 Methodology/Research Approach
- 13.1.1 Research Programs/Design
- 13.1.2 Market Size Estimation
- 13.1.3 Market Breakdown and Data Triangulation
- 13.2 Data Source
- 13.2.1 Secondary Sources
- 13.2.2 Primary Sources
- 13.3 Author List
- 13.4 Disclaimer 156