|
|
市場調査レポート
商品コード
1070474
半導体向け静電チャック (ESC) の世界市場 (2022年)Global Electrostatic Chucks (ESCs) In Semiconductor Market Research Report 2022 |
||||||
|
|
|||||||
|
● お客様のご希望に応じて、既存データの加工や未掲載情報(例:国別セグメント)の追加などの対応が可能です。 詳細はお問い合わせください。 |
|||||||


| 半導体向け静電チャック (ESC) の世界市場 (2022年) |
|
出版日: 2022年07月21日
発行: QYResearch
ページ情報: 英文 139 Pages
納期: 2~3営業日
|
- 全表示
- 概要
- 図表
- 目次
世界の半導体向け静電チャック (ESC) の市場規模は、新型コロナウイルス感染症 (COVID-19) 感染拡大による再調整を経て、2022年に18億米ドル、2028年までに24億1,000万米ドルに達すると予測されています。
また、予測期間中 (2022年~2028年) に5.06%のCAGRで成長する見通しです。
種類別では、クローンタイプが2021年に世界市場の68.55%を占め、2022年から2028年にかけて5.10%のCAGRで成長すると予測されています。用途別では、300mmウェーハのセグメントが予測期間中に6.17%のCAGRで成長する見通しです。
地域別に見ると、北米が2021年に世界市場の78.07%、日本が19.02%のシェアを占めています。
当レポートでは、世界の半導体向け静電チャック (ESC) の市場について分析し、種類別・用途別・最終消費者別・地域別 (国別) の市場動向の見通し (2017年~2028年)、主要企業のプロファイルなどについて調査しております。
目次
第1章 半導体向け静電チャック (ESC) :市場概要
- 半導体向け静電チャック (ESC) :製品の概要と範囲
- 種類別のセグメント
- 市場規模・成長率の分析:種類別 (2022年・2028年)
- クーロンタイプ
- JR (Johnsen-Rahbek) タイプ
- 用途別のセグメント
- 市場規模・成長率の分析:用途別 (2022年・2028年)
- 300mmウェーハ
- 200mmウェーハ
- その他
- 世界市場の成長見通し
- 世界の半導体向け静電チャック (ESC) の収益:推定・予測 (2017年~2028年)
- 世界の半導体向け静電チャック (ESC) の生産:推定・予測 (2017年~2028年)
- 地域別の市場規模
- 世界の半導体向け静電チャック (ESC) の市場規模:推定・予測、地域別 (2017年・2022年・2028年)
- 北米:推定・予測 (2017年~2028年)
- 日本:推定・予測 (2017年~2028年)
第2章 メーカー別の市場競争
- 世界の半導体向け静電チャック (ESC) の生産:メーカー別 (2018年~2022年)
- 世界の半導体向け静電チャック (ESC) の収益・市場シェア:メーカー別 (2018年~2022年)
- 市場シェア:企業の種類別 (ティア1、ティア2、ティア3)
- 世界の半導体向け静電チャック (ESC) の平均価格:メーカー別 (2018年~2022年)
- 世界の半導体向け静電チャック (ESC) の粗利益:メーカー別 (2018年~2022年)
- 半導体向け静電チャック (ESC) メーカーの製造拠点・提供エリア・製品種類
- 半導体向け静電チャック (ESC) 市場の競争状況と動向
第3章 地域別の生産
- 世界の半導体向け静電チャック (ESC) の生産:地域別 (2017年~2022年)
- 世界の半導体向け静電チャック (ESC) の収益・市場シェア:地域別 (2017年~2022年)
- 世界の半導体向け静電チャック (ESC) の生産・収益・価格・粗利益 (2017年~2022年)
- 北米の半導体向け静電チャック (ESC) の生産
- 日本の半導体向け静電チャック (ESC) の生産
第4章 半導体向け静電チャック (ESC) :地域別の消費
- 世界の半導体向け静電チャック (ESC) の消費:地域別
- 消費:地域別
- 消費・市場シェア:地域別
- 北米
- 欧州
- アジア太平洋
- ラテンアメリカ
- 中東・アフリカ
第5章 種類別のセグメント
- 半導体向け静電チャック (ESC) の生産・市場シェア:種類別 (2017年~2022年)
- 半導体向け静電チャック (ESC) の収益・市場シェア:種類別 (2017年~2022年)
- 半導体向け静電チャック (ESC) の価格:種類別 (2017年~2022年)
第6章 用途別のセグメント
- 半導体向け静電チャック (ESC) の生産・市場シェア:用途別 (2017年~2022年)
- 半導体向け静電チャック (ESC) の収益・市場シェア:用途別 (2017年~2022年)
- 半導体向け静電チャック (ESC) の価格:用途別 (2017年~2022年)
第7章 最終消費者別のセグメント
- 半導体向け静電チャック (ESC) の生産・市場シェア:最終消費者別 (2017年~2022年)
- 半導体向け静電チャック (ESC) の収益・市場シェア:最終消費者別 (2017年~2022年)
- 半導体向け静電チャック (ESC) の価格:最終消費者別 (2017年~2022年)
第8章 主要企業のプロファイル
- APPLIED MATERIALS
- 企業情報
- 企業概略・事業概要
- 主要製品
- 販売・収益・粗利益 (2018年~2022年)
- LAM RESEARCH
- SHINKO
- TOTO
- CREATIVE TECHNOLOGY CORPORATION
- KYOCERA
- NGK INSULATORS, LTD.
- NTK CERATEC
- TSUKUBA SEIKO
- II-VI M CUBED
第9章 半導体向け静電チャック (ESC) の製造コストの分析
- 半導体向け静電チャック (ESC) の主要原材料の分析
- 製造コストの構造比率
- 半導体向け静電チャック (ESC) の製造プロセスの分析
- 半導体向け静電チャック (ESC) の産業チェーンの分析
第10章 マーケティングチャネル・流通業者・顧客
- マーケティングチャネル
- 半導体向け静電チャック (ESC) の流通業者の一覧
- 半導体向け静電チャック (ESC) の顧客
第11章 半導体向け静電チャック (ESC) 市場:市場力学
- 半導体向け静電チャック (ESC) 業界の動向
- 半導体向け静電チャック (ESC) 市場の促進要因
- 半導体向け静電チャック (ESC) 市場の課題
- 半導体向け静電チャック (ESC) 市場の抑制要因
第12章 生産・供給予測
- 世界の半導体向け静電チャック (ESC) の生産予測:地域別 (2023年~2028年)
- 北米:生産・収益予測 (2023年~2028年)
- 日本:生産・収益予測 (2023年~2028年)
第13章 消費・需要予測
- 世界の半導体向け静電チャック (ESC) の予測・需要分析
- 北米:消費予測、国別
- 欧州:消費予測、国別
- アジア太平洋:消費予測、地域別
- ラテンアメリカ:消費予測、国別
- 中東・アフリカ:消費予測、国別
第14章 種類別・用途別・最終消費者別の予測
- 世界の生産・収益・価格予測:種類別 (2023年~2028年)
- 世界の生産・収益・価格予測:用途別 (2023年~2028年)
- 世界の生産・収益・価格予測:最終消費者別 (2023年~2028年)
第15章 調査結果と結論
第16章 調査手法とデータソース
LIST OF TABLES
- Table 1. Global Electrostatic Chucks (ESCs) in Semiconductor Market Size by Type (Units) & (US$ Million) & (2022 VS 2028)
- Table 2. Global Electrostatic Chucks (ESCs) in Semiconductor Market Size by Application (Units) & (US$ Million) & (2022 VS 2028)
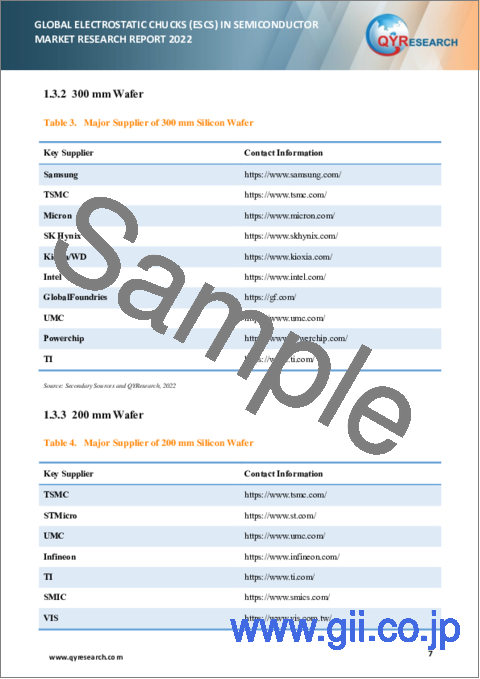
- Table 3. Major Supplier of 300 mm Silicon Wafer
- Table 4. Major Supplier of 200 mm Silicon Wafer
- Table 5. Major Supplier of ≤150 mm Silicon Wafer
- Table 6. Electrostatic Chucks (ESCs) in Semiconductor Market Size Comparison by Consumption Region: 2017 VS 2022 VS 2028 (US$ Million)
- Table 7. Global Electrostatic Chucks (ESCs) in Semiconductor Sales by Manufacturers (2018-2022) & (Units)
- Table 8. Global Electrostatic Chucks (ESCs) in Semiconductor Sales Market Share by Manufacturers (2018-2022)
- Table 9. Global Electrostatic Chucks (ESCs) in Semiconductor Revenue by Manufacturers (2018-2022) & (US$ Million)
- Table 10. Global Electrostatic Chucks (ESCs) in Semiconductor Revenue Share by Manufacturers (2018-2022)
- Table 11. Company Type (Tier 1, Tier 2, and Tier 3) & (based on the Revenue in Electrostatic Chucks (ESCs) in Semiconductor as of 2021)
- Table 12. Global Market Electrostatic Chucks (ESCs) in Semiconductor Average Price (K USD/Unit) of Key Manufacturers (2018-2022)
- Table 13. Manufacturers Electrostatic Chucks (ESCs) in Semiconductor Production Sites and Area Served
- Table 14. Manufacturers Electrostatic Chucks (ESCs) in Semiconductor Product Type
- Table 15. Global Electrostatic Chucks (ESCs) in Semiconductor Manufacturers Market Concentration Ratio (CR5 and HHI)
- Table 16. Global Electrostatic Chucks (ESCs) in Semiconductor Production (Units) by Region (2017-2022)
- Table 17. Global Electrostatic Chucks (ESCs) in Semiconductor Production (Units), Revenue (US$ Million), Price (K USD/Unit) and Gross Margin (2017-2022)
- Table 18. Global Electrostatic Chucks (ESCs) in Semiconductor Consumption (Volume) by Region (2017-2022) & (Units)
- Table 19. Global Electrostatic Chucks (ESCs) in Semiconductor Consumption (Volume) Market Share by Region (2017-2022)
- Table 20. Global Electrostatic Chucks (ESCs) in Semiconductor Consumption (Value) by Region (2017-2022) & (US$ Million)
- Table 21. Global Electrostatic Chucks (ESCs) in Semiconductor Consumption (Value) Market Share by Region (2017-2022)
- Table 22. North America Electrostatic Chucks (ESCs) in Semiconductor Consumption (Volume) by Country (2017-2022) & (Units)
- Table 23. North America Electrostatic Chucks (ESCs) in Semiconductor Consumption (Volume) Share by Country (2017-2022)
- Table 24. North America Electrostatic Chucks (ESCs) in Semiconductor Consumption (Value) by Country (2017-2022) & (US$ Million)
- Table 25. North America Electrostatic Chucks (ESCs) in Semiconductor Consumption (Volume) Share by Country (2017-2022)
- Table 26. North America Electrostatic Chucks (ESCs) in Semiconductor Consumption (Volume) by Type (2017-2022) & (Units)
- Table 27. North America Electrostatic Chucks (ESCs) in Semiconductor Consumption (Volume) Share by Type (2017-2022)
- Table 28. North America Electrostatic Chucks (ESCs) in Semiconductor Consumption (Volume) by Application (2017-2022) & (Units)
- Table 29. North America Electrostatic Chucks (ESCs) in Semiconductor Consumption (Volume) Share by Application (2017-2022)
- Table 30. Europe Electrostatic Chucks (ESCs) in Semiconductor Consumption (Volume) by Country (2017-2022) & (Units)
- Table 31. Europe Electrostatic Chucks (ESCs) in Semiconductor Consumption (Volume) Share by Country (2017-2022)
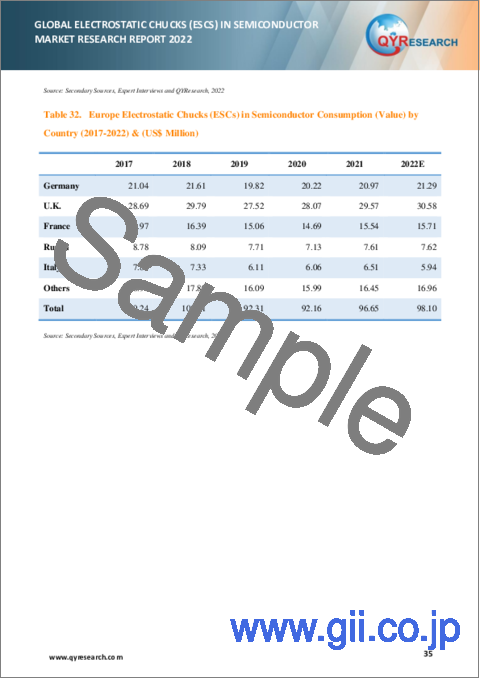
- Table 32. Europe Electrostatic Chucks (ESCs) in Semiconductor Consumption (Value) by Country (2017-2022) & (US$ Million)
- Table 33. Europe Electrostatic Chucks (ESCs) in Semiconductor Consumption (Volume) Share by Country (2017-2022)
- Table 34. Europe Electrostatic Chucks (ESCs) in Semiconductor Consumption (Volume) by Type (2017-2022) & (Units)
- Table 35. Europe Electrostatic Chucks (ESCs) in Semiconductor Consumption (Volume) Share by Type (2017-2022)
- Table 36. Europe Electrostatic Chucks (ESCs) in Semiconductor Consumption (Volume) by Application (2017-2022) & (Units)
- Table 37. Europe Electrostatic Chucks (ESCs) in Semiconductor Consumption (Volume) Share by Application (2017-2022)
- Table 38. Asia Pacific Electrostatic Chucks (ESCs) in Semiconductor Consumption (Volume) by Country (2017-2022) & (Units)
- Table 39. Asia Pacific Electrostatic Chucks (ESCs) in Semiconductor Consumption (Volume) Share by Country (2017-2022)
- Table 40. Asia Pacific Electrostatic Chucks (ESCs) in Semiconductor Consumption (Value) by Country (2017-2022) & (US$ Million)
- Table 41. Asia Pacific Electrostatic Chucks (ESCs) in Semiconductor Consumption (Volume) Share by Country (2017-2022)
- Table 42. Asia Pacific Electrostatic Chucks (ESCs) in Semiconductor Consumption (Volume) by Type (2017-2022) & (Units)
- Table 43. Asia Pacific Electrostatic Chucks (ESCs) in Semiconductor Consumption (Volume) Share by Type (2017-2022)
- Table 44. Asia Pacific Electrostatic Chucks (ESCs) in Semiconductor Consumption (Volume) by Application (2017-2022) & (Units)
- Table 45. Asia Pacific Electrostatic Chucks (ESCs) in Semiconductor Consumption (Volume) Share by Application (2017-2022)
- Table 46. Latin America Electrostatic Chucks (ESCs) in Semiconductor Consumption (Volume) by Country (2017-2022) & (Units)
- Table 47. Latin America Electrostatic Chucks (ESCs) in Semiconductor Consumption (Volume) Share by Country (2017-2022)
- Table 48. Latin America Electrostatic Chucks (ESCs) in Semiconductor Consumption (Value) by Country (2017-2022) & (US$ Million)
- Table 49. Latin America Electrostatic Chucks (ESCs) in Semiconductor Consumption (Volume) Share by Country (2017-2022)
- Table 50. Latin America Electrostatic Chucks (ESCs) in Semiconductor Consumption (Volume) by Type (2017-2022) & (Units)
- Table 51. Latin America Electrostatic Chucks (ESCs) in Semiconductor Consumption (Volume) Share by Type (2017-2022)
- Table 52. Latin America Electrostatic Chucks (ESCs) in Semiconductor Consumption (Volume) by Application (2017-2022) & (Units)
- Table 53. Latin America Electrostatic Chucks (ESCs) in Semiconductor Consumption (Volume) Share by Application (2017-2022)
- Table 54. Middle East and Africa Electrostatic Chucks (ESCs) in Semiconductor Consumption (Volume) by Country (2017-2022) & (Units)
- Table 55. Middle East and Africa Electrostatic Chucks (ESCs) in Semiconductor Consumption (Volume) Share by Country (2017-2022)
- Table 56. Middle East and Africa Electrostatic Chucks (ESCs) in Semiconductor Consumption (Value) by Country (2017-2022) & (US$ Million)
- Table 57. Middle East and Africa Electrostatic Chucks (ESCs) in Semiconductor Consumption (Volume) Share by Country (2017-2022)
- Table 58. Middle East and Africa Electrostatic Chucks (ESCs) in Semiconductor Consumption (Volume) by Type (2017-2022) & (Units)
- Table 59. Middle East and Africa Electrostatic Chucks (ESCs) in Semiconductor Consumption (Volume) Share by Type (2017-2022)
- Table 60. Middle East and Africa Electrostatic Chucks (ESCs) in Semiconductor Consumption (Volume) by Application (2017-2022) & (Units)
- Table 61. Middle East and Africa Electrostatic Chucks (ESCs) in Semiconductor Consumption (Volume) Share by Application (2017-2022)
- Table 62. Global Electrostatic Chucks (ESCs) in Semiconductor Sales (Units) by Type (2017-2022)
- Table 63. Global Electrostatic Chucks (ESCs) in Semiconductor Sales Market Share by Type (2017-2022)
- Table 64. Global Electrostatic Chucks (ESCs) in Semiconductor Revenue (US$ Million) by Type (2017-2022)
- Table 65. Global Electrostatic Chucks (ESCs) in Semiconductor Revenue Share by Type (2017-2022)
- Table 66. Global Electrostatic Chucks (ESCs) in Semiconductor Price (K USD/Unit) by Type (2017-2022)
- Table 67. Global Electrostatic Chucks (ESCs) in Semiconductor Sales (Units) by Application (2017-2022)
- Table 68. Global Electrostatic Chucks (ESCs) in Semiconductor Sales Market Share by Application (2017-2022)
- Table 69. Global Electrostatic Chucks (ESCs) in Semiconductor Revenue (US$ Million) by Application (2017-2022)
- Table 70. Global Electrostatic Chucks (ESCs) in Semiconductor Revenue Share by Application (2017-2022)
- Table 71. Global Electrostatic Chucks (ESCs) in Semiconductor Price (K USD/Unit) by Application (2017-2022)
- Table 72. Applied Materials Corporation Information
- Table 73. Applied Materials Electrostatic Chucks (ESCs) Sales (Units), Revenue (US$ Million), Price (K USD/Unit) and Gross Margin (2018-2022)
- Table 74. Lam Research Corporation Information
- Table 75. Lam Research Electrostatic Chucks (ESCs) Sales (Units), Revenue (US$ Million), Price (K USD/Unit) and Gross Margin (2018-2022)
- Table 76. SHINKO Corporation Information
- Table 77. SHINKO Electrostatic Chucks (ESCs) Product
- Table 78. SHINKO Electrostatic Chucks (ESCs) Sales (Units), Revenue (US$ Million), Price (K USD/Unit) and Gross Margin (2018-2022)
- Table 79. TOTO Corporation Information
- Table 80. TOTO Electrostatic Chucks (ESCs) Product
- Table 81. TOTO Electrostatic Chucks (ESCs) Sales (Units), Revenue (US$ Million), Price (K USD/Unit) and Gross Margin (2018-2022)
- Table 82. Creative Technology Corporation Information
- Table 83. Creative Technology Corporation Electrostatic Chucks (ESCs) Sales (Units), Revenue (US$ Million), Price (K USD/Unit) and Gross Margin (2018-2022)
- Table 84. Kyocera Corporation Information
- Table 85. Business Segment
- Table 86. Kyocera Electrostatic Chucks (ESCs) Product
- Table 87. Kyocera Electrostatic Chucks (ESCs) Sales (Units), Revenue (US$ Million), Price (K USD/Unit) and Gross Margin (2018-2022)
- Table 88. NGK Insulators, Ltd. Corporation Information
- Table 89. NGK Insulators, Ltd. Electrostatic Chucks (ESCs) Product
- Table 90. NGK Insulators, Ltd. Electrostatic Chucks (ESCs) Sales (Units), Revenue (US$ Million), Price (K USD/Unit) and Gross Margin (2018-2022)
- Table 91. NTK CERATEC Corporation Information
- Table 92. NTK CERATEC Description and Business Overview
- Table 93. NTK CERATEC Electrostatic Chucks (ESCs) Product
- Table 94. NTK CERATEC Electrostatic Chucks (ESCs) Sales (Units), Revenue (US$ Million), Price (K USD/Unit) and Gross Margin (2018-2022)
- Table 95. Tsukuba Seiko Corporation Information
- Table 96. Corporate History
- Table 97. Tsukuba Seiko Electrostatic Chucks (ESCs) Product
- Table 98. Tsukuba Seiko Electrostatic Chucks (ESCs) Sales (Units), Revenue (US$ Million), Price (K USD/Unit) and Gross Margin (2018-2022)
- Table 99. II-VI M Cubed Corporation Information
- Table 100. II-VI M Cubed Electrostatic Chucks (ESCs) Product
- Table 101. II-VI Incorporated Electrostatic Chucks (ESCs) Sales (Units), Revenue (US$ Million), Price (K USD/Unit) and Gross Margin (2018-2022)
- Table 102. Market Concentration Rate of Raw Material
- Table 103. Key Suppliers of Raw Materials
- Table 104. Global Electrostatic Chucks (ESCs) in SemiconductorSales (Units) by Downstream Consumers (2017-2022)
- Table 105. Global Electrostatic Chucks (ESCs) in Semiconductor Sales Market by Downstream Consumers (2023-2028)
- Table 106. Global Electrostatic Chucks (ESCs) in Semiconductor Revenue (US$ Million) by Downstream Consumers (2017-2022)
- Table 107. Global Electrostatic Chucks (ESCs) in Semiconductor Revenue by Downstream Consumers (2023-2028)
- Table 108. Electrostatic Chucks (ESCs) in Semiconductor Distributors List
- Table 109. Major Supplier of Silicon Wafer
- Table 110. Major Semiconductor Equipment Manufactures
- Table 111. Electrostatic Chucks (ESCs) in Semiconductor Market Drivers
- Table 112. Electrostatic Chucks (ESCs) in Semiconductor Market Challenges
- Table 113. Electrostatic Chucks (ESCs) in Semiconductor Market Restraints
- Table 114. Global Electrostatic Chucks (ESCs) in Semiconductor Production (Units) Forecast by Region (2023-2028)
- Table 115. Global Electrostatic Chucks (ESCs) in Semiconductor Production Market Share Forecast by Region (2023-2028)
- Table 116. Global Electrostatic Chucks (ESCs) in Semiconductor Consumption (Volume) by Region (2023-2028) & (Units)
- Table 117. Global Electrostatic Chucks (ESCs) in Semiconductor Consumption (Value) Market by Region (2023-2028) & (US$ Million)
- Table 118. North America Electrostatic Chucks (ESCs) in Semiconductor Consumption Forecast by Country (2023-2028) & (Units)
- Table 119. North America Electrostatic Chucks (ESCs) in Semiconductor Consumption Forecast by Country (2023-2028) & (US$ Million)
- Table 120. North America Electrostatic Chucks (ESCs) in Semiconductor Consumption (Volume) by Type (2023-2028) & (Units)
- Table 121. North America Electrostatic Chucks (ESCs) in Semiconductor Consumption (Volume) by Application (2023-2028) & (Units)
- Table 122. Europe Electrostatic Chucks (ESCs) in Semiconductor Consumption Forecast by Country (2023-2028) & (Units)
- Table 123. Europe Electrostatic Chucks (ESCs) in Semiconductor Consumption Forecast by Country (2023-2028) & (US$ Million)
- Table 124. Europe Electrostatic Chucks (ESCs) in Semiconductor Consumption (Volume) by Type (2023-2028) & (Units)
- Table 125. Europe Electrostatic Chucks (ESCs) in Semiconductor Consumption (Volume) by Application (2023-2028) & (Units)
- Table 126. Asia Pacific Electrostatic Chucks (ESCs) in Semiconductor Consumption Forecast by Country (2023-2028) & (Units)
- Table 127. Asia Pacific Electrostatic Chucks (ESCs) in Semiconductor Consumption Forecast by Country (2023-2028) & (US$ Million)
- Table 128. Asia Pacific Electrostatic Chucks (ESCs) in Semiconductor Consumption (Volume) by Type (2023-2028) & (Units)
- Table 129. Asia Pacific Electrostatic Chucks (ESCs) in Semiconductor Consumption (Volume) by Application (2023-2028) & (Units)
- Table 130. Latin America Electrostatic Chucks (ESCs) in Semiconductor Consumption Forecast by Country (2023-2028) & (Units)
- Table 131. Latin America Electrostatic Chucks (ESCs) in Semiconductor Consumption Forecast by Country (2023-2028) & (US$ Million)
- Table 132. Latin America Electrostatic Chucks (ESCs) in Semiconductor Consumption (Volume) by Type (2023-2028) & (Units)
- Table 133. Latin America Electrostatic Chucks (ESCs) in Semiconductor Consumption (Volume) by Application (2023-2028) & (Units)
- Table 134. Middle East and Africa Electrostatic Chucks (ESCs) in Semiconductor Consumption Forecast by Country (2023-2028) & (Units)
- Table 135. Middle East and Africa Electrostatic Chucks (ESCs) in Semiconductor Consumption Forecast by Country (2023-2028) & (US$ Million)
- Table 136. Middle East and Africa Electrostatic Chucks (ESCs) in Semiconductor Consumption (Volume) by Type (2023-2028) & (Units)
- Table 137. Middle East and Africa Electrostatic Chucks (ESCs) in Semiconductor Consumption (Volume) by Application (2023-2028) & (Units)
- Table 138. Global Electrostatic Chucks (ESCs) in Semiconductor Sales Forecast by Type (2023-2028) & (Units)
- Table 139. Global Electrostatic Chucks (ESCs) in Semiconductor Sales Market Share Forecast by Type (2023-2028)
- Table 140. Global Electrostatic Chucks (ESCs) in Semiconductor Revenue Forecast by Type (2023-2028) & (US$ Million)
- Table 141. Global Electrostatic Chucks (ESCs) in Semiconductor Revenue Market Share Forecast by Type (2023-2028)
- Table 142. Global Electrostatic Chucks (ESCs) in Semiconductor Price Forecast by Type (2023-2028) & (K USD/Unit)
- Table 143. Global Electrostatic Chucks (ESCs) in Semiconductor Sales Forecast by Application (2023-2028) & (Units)
- Table 144. Global Electrostatic Chucks (ESCs) in Semiconductor Sales Market Share Forecast by Application (2023-2028)
- Table 145. Global Electrostatic Chucks (ESCs) in Semiconductor Revenue Forecast by Application (2023-2028) & (US$ Million)
- Table 146. Global Electrostatic Chucks (ESCs) in Semiconductor Revenue Market Share Forecast by Application (2023-2028)
- Table 147. Global Electrostatic Chucks (ESCs) in Semiconductor Price Forecast by Application (2023-2028) & (K USD/Unit)
- Table 148. Research Programs/Design for This Report
- Table 149. Key Data Information from Secondary Sources
- Table 150. Key Data Information from Primary Sources
List of Figures
- Figure 1. Product Picture of Electrostatic Chucks (ESCs) in Semiconductor
- Figure 2. Global Electrostatic Chucks (ESCs) in Semiconductor Market Share by Type: 2022 VS 2028
- Figure 3. Coulomb Type Principles of Adsorption Power
- Figure 4. Johnsen-Rahbek (JR) Type Principles of Adsorption Power
- Figure 5. Global Electrostatic Chucks (ESCs) in Semiconductor Market Share by Application: 2022 VS 2028
- Figure 6. Global Electrostatic Chucks (ESCs) in Semiconductor Revenue (US$ Million), 2017 VS 2022 VS 2028
- Figure 7. Global Electrostatic Chucks (ESCs) in Semiconductor Revenue (US$ Million) (2017-2028)
- Figure 8. Global Electrostatic Chucks (ESCs) in Semiconductor Production (Units) & (2017-2028)
- Figure 9. North America Electrostatic Chucks (ESCs) in Semiconductor Revenue (US$ Million) Growth Rate (2017-2028)
- Figure 10. Europe Electrostatic Chucks (ESCs) in Semiconductor Revenue (US$ Million) Growth Rate (2017-2028)
- Figure 11. Asia Pacific Electrostatic Chucks (ESCs) in Semiconductor Revenue (US$ Million) Growth Rate (2017-2028)
- Figure 12. Japan Electrostatic Chucks (ESCs) in Semiconductor Revenue (US$ Million) Growth Rate (2017-2028)
- Figure 13. Japan Electrostatic Chucks (ESCs) in Semiconductor Revenue (US$ Million) Growth Rate (2017-2028)
- Figure 14. Electrostatic Chucks (ESCs) in Semiconductor Market Share by Company Type (Tier 1, Tier 2, and Tier 3): 2018 VS 2021
- Figure 15. The Global 3 and 5 Largest Players: Market Share by Electrostatic Chucks (ESCs) in Semiconductor Revenue in 2021
- Figure 16. Global Electrostatic Chucks (ESCs) in Semiconductor Production Market Share by Region (2017-2022)
- Figure 17. Applied Materials Electrostatic Chucks (ESCs) Product
- Figure 18. Lam Research Electrostatic Chucks (ESCs) Product
- Figure 19. Creative Technology Corporation Electrostatic Chucks (ESCs) Product
- Figure 20. Global Manufacturing Cost Structure of Electrostatic Chucks (ESCs) in Semiconductor in 2021
- Figure 21. Manufacturing Process Analysis of Electrostatic Chucks (ESCs) in Semiconductor
- Figure 22. Electrostatic Chucks (ESCs) in Semiconductor Industrial Chain Analysis
- Figure 23. Japan Electrostatic Chucks (ESCs) in Semiconductor Production (Units) Growth Rate Forecast (2023-2028)
- Figure 24. Bottom-up and Top-down Approaches for This Report
- Figure 25. Data Triangulation 113
Due to the COVID-19 pandemic, the global Electrostatic Chucks (ESCs) In Semiconductor market size is estimated to be worth US$ 1.79 billion in 2022 and is forecast to a readjusted size of US$ 2.41 billion by 2028 with a CAGR of 5.06% during the forecast period 2022-2028. Fully considering the economic change by this health crisis, Coulomb Type accounting for 68.55% of the Electrostatic Chucks (ESCs) in Semiconductor global market in 2021, is projected to value US$ 1.64 billion by 2028, growing at a revised 5.10% CAGR from 2022 to 2028.
The global major manufacturers of Electrostatic Chucks (ESCs) in Semiconductor include Applied Materials, Lam Research, SHINKO, TOTO, Creative Technology Corporation, Kyocera, NGK Insulators, Ltd., NTK CERATEC, and Tsukuba Seiko, etc. In terms of revenue, the global three largest players hold 86.64% market share of Electrostatic Chucks (ESCs) in Semiconductor in 2021.
Drivers and Restrains:
The research report has incorporated the analysis of different factors that augment the market's growth. It constitutes trends, restraints, and drivers that transform the market in either a positive or negative manner. This section also provides the scope of different segments and applications that can potentially influence the market in the future. The detailed information is based on current trends and historic milestones. This section also provides an analysis of the volume of production about the global market and about each type from 2017 to 2028. This section mentions the volume of production by region from 2017 to 2028. Pricing analysis is included in the report according to each type from the year 2017 to 2028, manufacturer from 2018 to 2022, region from 2017 to 2022, and global price from 2017 to 2028.
A thorough evaluation of the restrains included in the report portrays the contrast to drivers and gives room for strategic planning. Factors that overshadow the market growth are pivotal as they can be understood to devise different bends for getting hold of the lucrative opportunities that are present in the ever-growing market. Additionally, insights into market expert's opinions have been taken to understand the market better.
Segment Analysis:
The research report includes specific segments by region (country), by manufacturers, by Type and by Application. Each type provides information about the production during the forecast period of 2017 to 2028. by Application segment also provides consumption during the forecast period of 2017 to 2028. Understanding the segments helps in identifying the importance of different factors that aid the market growth.
By Company
- Applied Materials
- Lam Research
- SHINKO
- TOTO
- Creative Technology Corporation
- Kyocera
- NGK Insulators, Ltd.
- NTK CERATEC
- Tsukuba Seiko
- II-VI Incorporated
Segment by Type
- Coulomb Type
- Johnsen-Rahbek (JR) Type
Segment by Application
- 300 mm Wafer
- 200 mm Wafer
- Others
Production by Region
- Japan
- Others
Consumption by Region
- North America
- United States
- Canada
- Asia-Pacific
- Taiwan (China)
- China (Ex. Taiwan)
- Japan
- South Korea
- Others
- Europe
- Germany
- U.K.
- France
- Russia
- Italy
- Others
- South America
- Brazil
TABLE OF CONTENTS
1 ELECTROSTATIC CHUCKS (ESCS) IN SEMICONDUCTOR MARKET OVERVIEW
- 1.1 PRODUCT OVERVIEW AND SCOPE OF ELECTROSTATIC CHUCKS (ESCS) IN SEMICONDUCTOR
- 1.2 ELECTROSTATIC CHUCKS (ESCS) IN SEMICONDUCTOR SEGMENT BY TYPE
- 1.2.1 GLOBAL ELECTROSTATIC CHUCKS (ESCS) IN SEMICONDUCTOR MARKET SIZE GROWTH RATE ANALYSIS BY TYPE: 2022 VS 2028
- 1.2.2 COULOMB TYPE
- 1.2.3 JOHNSEN-RAHBEK (JR) TYPE
- 1.3 ELECTROSTATIC CHUCKS (ESCS) IN SEMICONDUCTOR SEGMENT BY APPLICATION
- 1.3.1 GLOBAL ELECTROSTATIC CHUCKS (ESCS) IN SEMICONDUCTOR MARKET SIZE GROWTH RATE ANALYSIS BY APPLICATION: 2022 VS 2028
- 1.3.2 300 MM WAFER
- 1.3.3 200 MM WAFER
- 1.3.4 OTHERS
- 1.4 GLOBAL MARKET GROWTH PROSPECTS
- 1.4.1 GLOBAL ELECTROSTATIC CHUCKS (ESCS) IN SEMICONDUCTOR REVENUE ESTIMATES AND FORECASTS (2017-2028)
- 1.4.2 GLOBAL ELECTROSTATIC CHUCKS (ESCS) IN SEMICONDUCTOR PRODUCTION ESTIMATES AND FORECASTS (2017-2028)
- 1.5 GLOBAL MARKET SIZE BY REGION
- 1.5.1 GLOBAL ELECTROSTATIC CHUCKS (ESCS) IN SEMICONDUCTOR MARKET SIZE ESTIMATES AND FORECASTS BY CONSUMPTION REGION: 2017 VS 2022 VS 2028
- 1.5.2 NORTH AMERICA ELECTROSTATIC CHUCKS (ESCS) IN SEMICONDUCTOR ESTIMATES AND FORECASTS (2017-2028)
- 1.5.3 EUROPE ELECTROSTATIC CHUCKS (ESCS) IN SEMICONDUCTOR ESTIMATES AND FORECASTS (2017-2028)
- 1.5.4 ASIA PACIFIC ELECTROSTATIC CHUCKS (ESCS) IN SEMICONDUCTOR ESTIMATES AND FORECASTS (2017-2028)
- 1.5.5 LATIN AMERICA ELECTROSTATIC CHUCKS (ESCS) IN SEMICONDUCTOR ESTIMATES AND FORECASTS (2017-2028)
- 1.5.6 MIDDLE EAST AND AFRICA ELECTROSTATIC CHUCKS (ESCS) IN SEMICONDUCTOR ESTIMATES AND FORECASTS (2017-2028)
2 MARKET COMPETITION BY MANUFACTURERS
- 2.1 GLOBAL ELECTROSTATIC CHUCKS (ESCS) IN SEMICONDUCTOR SALES MARKET SHARE BY MANUFACTURERS (2018-2022)
- 2.2 GLOBAL ELECTROSTATIC CHUCKS (ESCS) IN SEMICONDUCTOR REVENUE MARKET SHARE BY MANUFACTURERS (2018-2022)
- 2.3 ELECTROSTATIC CHUCKS (ESCS) IN SEMICONDUCTOR MARKET SHARE BY COMPANY TYPE (TIER 1, TIER 2, AND TIER 3)
- 2.4 GLOBAL ELECTROSTATIC CHUCKS (ESCS) IN SEMICONDUCTOR AVERAGE PRICE BY MANUFACTURERS (2018-2022)
- 2.5 MANUFACTURERS ELECTROSTATIC CHUCKS (ESCS) IN SEMICONDUCTOR PRODUCTION SITES, AREA SERVED, PRODUCT TYPE
- 2.6 ELECTROSTATIC CHUCKS (ESCS) IN SEMICONDUCTOR MARKET COMPETITIVE SITUATION AND TRENDS
- 2.6.1 ELECTROSTATIC CHUCKS (ESCS) IN SEMICONDUCTOR MARKET CONCENTRATION RATE
- 2.6.2 GLOBAL 3 AND 5 LARGEST ELECTROSTATIC CHUCKS (ESCS) IN SEMICONDUCTOR PLAYERS MARKET SHARE BY REVENUE
3 PRODUCTION BY REGION
- 3.1 GLOBAL PRODUCTION OF ELECTROSTATIC CHUCKS (ESCS) IN SEMICONDUCTOR MARKET SHARE BY REGION (2017-2022)
- 3.2 GLOBAL ELECTROSTATIC CHUCKS (ESCS) IN SEMICONDUCTOR PRODUCTION, REVENUE, PRICE AND GROSS MARGIN (2017-2022)
4 ELECTROSTATIC CHUCKS (ESCS) IN SEMICONDUCTOR CONSUMPTION BY REGION
- 4.1 GLOBAL ELECTROSTATIC CHUCKS (ESCS) IN SEMICONDUCTOR CONSUMPTION BY REGION
- 4.1.1 GLOBAL ELECTROSTATIC CHUCKS (ESCS) IN SEMICONDUCTOR CONSUMPTION (VOLUME) BY REGION
- 4.1.2 GLOBAL ELECTROSTATIC CHUCKS (ESCS) IN SEMICONDUCTOR CONSUMPTION (VALUE) MARKET BY REGION
- 4.2 NORTH AMERICA
- 4.2.1 NORTH AMERICA ELECTROSTATIC CHUCKS (ESCS) IN SEMICONDUCTOR CONSUMPTION BY COUNTRY
- 4.2.2 NORTH AMERICA ELECTROSTATIC CHUCKS (ESCS) IN SEMICONDUCTOR CONSUMPTION BY TYPE
- 4.2.3 NORTH AMERICA ELECTROSTATIC CHUCKS (ESCS) IN SEMICONDUCTOR CONSUMPTION BY APPLICATION
- 4.3 EUROPE
- 4.3.1 EUROPE ELECTROSTATIC CHUCKS (ESCS) IN SEMICONDUCTOR CONSUMPTION BY COUNTRY
- 4.3.2 EUROPE ELECTROSTATIC CHUCKS (ESCS) IN SEMICONDUCTOR CONSUMPTION BY TYPE
- 4.3.3 EUROPE ELECTROSTATIC CHUCKS (ESCS) IN SEMICONDUCTOR CONSUMPTION BY APPLICATION
- 4.4 ASIA PACIFIC
- 4.4.1 ASIA PACIFIC ELECTROSTATIC CHUCKS (ESCS) IN SEMICONDUCTOR CONSUMPTION BY COUNTRY
- 4.4.2 ASIA PACIFIC ELECTROSTATIC CHUCKS (ESCS) IN SEMICONDUCTOR CONSUMPTION BY TYPE
- 4.4.3 ASIA PACIFIC ELECTROSTATIC CHUCKS (ESCS) IN SEMICONDUCTOR CONSUMPTION BY APPLICATION
- 4.5 LATIN AMERICA
- 4.5.1 LATIN AMERICA ELECTROSTATIC CHUCKS (ESCS) IN SEMICONDUCTOR CONSUMPTION BY COUNTRY
- 4.5.2 LATIN AMERICA ELECTROSTATIC CHUCKS (ESCS) IN SEMICONDUCTOR CONSUMPTION BY TYPE
- 4.5.3 LATIN AMERICA ELECTROSTATIC CHUCKS (ESCS) IN SEMICONDUCTOR CONSUMPTION BY APPLICATION
- 4.6 MIDDLE EAST AND AFRICA
- 4.6.1 MIDDLE EAST AND AFRICA ELECTROSTATIC CHUCKS (ESCS) IN SEMICONDUCTOR CONSUMPTION BY COUNTRY
- 4.6.2 MIDDLE EAST AND AFRICA ELECTROSTATIC CHUCKS (ESCS) IN SEMICONDUCTOR CONSUMPTION BY TYPE
- 4.6.3 MIDDLE EAST AND AFRICA ELECTROSTATIC CHUCKS (ESCS) IN SEMICONDUCTOR CONSUMPTION BY APPLICATION
5 SEGMENT BY TYPE
- 5.1 GLOBAL ELECTROSTATIC CHUCKS (ESCS) IN SEMICONDUCTOR SALES MARKET SHARE BY TYPE (2017-2022)
- 5.2 GLOBAL ELECTROSTATIC CHUCKS (ESCS) IN SEMICONDUCTOR REVENUE MARKET SHARE BY TYPE (2017-2022)
- 5.3 GLOBAL ELECTROSTATIC CHUCKS (ESCS) IN SEMICONDUCTOR PRICE BY TYPE (2017-2022)
6 SEGMENT BY APPLICATION
- 6.1 GLOBAL ELECTROSTATIC CHUCKS (ESCS) IN SEMICONDUCTOR SALES MARKET SHARE BY APPLICATION (2017-2022)
- 6.2 GLOBAL ELECTROSTATIC CHUCKS (ESCS) IN SEMICONDUCTOR REVENUE MARKET SHARE BY APPLICATION (2017-2022)
- 6.3 GLOBAL ELECTROSTATIC CHUCKS (ESCS) IN SEMICONDUCTOR PRICE BY APPLICATION (2017-2022)
7 KEY COMPANIES PROFILED
- 7.1 APPLIED MATERIALS
- 7.1.1 APPLIED MATERIALS CORPORATION INFORMATION
- 7.1.2 APPLIED MATERIALS DESCRIPTION, BUSINESS OVERVIEW
- 7.1.3 APPLIED MATERIALS ELECTROSTATIC CHUCKS (ESCS) PRODUCTS OFFERED
- 7.1.4 APPLIED MATERIALS ELECTROSTATIC CHUCKS (ESCS) SALES, REVENUE AND GROSS MARGIN (2018-2022)
- 7.2 LAM RESEARCH
- 7.2.1 LAM RESEARCH CORPORATION INFORMATION
- 7.2.2 LAM RESEARCH DESCRIPTION, BUSINESS OVERVIEW
- 7.2.3 LAM RESEARCH ELECTROSTATIC CHUCKS (ESCS) PRODUCTS OFFERED
- 7.2.4 LAM RESEARCH ELECTROSTATIC CHUCKS (ESCS) SALES, REVENUE AND GROSS MARGIN (2018-2022)
- 7.3 SHINKO
- 7.3.1 SHINKO CORPORATION INFORMATION
- 7.3.2 SHINKO DESCRIPTION, BUSINESS OVERVIEW
- 7.3.3 SHINKO ELECTROSTATIC CHUCKS (ESCS) PRODUCTS OFFERED
- 7.3.4 SHINKO ELECTROSTATIC CHUCKS (ESCS) SALES, REVENUE AND GROSS MARGIN (2018-2022)
- 7.4 TOTO
- 7.4.1 TOTO CORPORATION INFORMATION
- 7.4.2 TOTO DESCRIPTION, BUSINESS OVERVIEW
- 7.4.3 TOTO ELECTROSTATIC CHUCKS (ESCS) PRODUCTS OFFERED
- 7.4.4 TOTO ELECTROSTATIC CHUCKS (ESCS) SALES, REVENUE AND GROSS MARGIN (2018-2022)
- 7.5 CREATIVE TECHNOLOGY CORPORATION
- 7.5.1 CREATIVE TECHNOLOGY CORPORATION INFORMATION
- 7.5.2 CREATIVE TECHNOLOGY CORPORATION DESCRIPTION, BUSINESS OVERVIEW
- 7.5.3 CREATIVE TECHNOLOGY CORPORATION ELECTROSTATIC CHUCKS (ESCS) PRODUCTS OFFERED
- 7.5.4 CREATIVE TECHNOLOGY CORPORATION ELECTROSTATIC CHUCKS (ESCS) SALES, REVENUE AND GROSS MARGIN (2018-2022)
- 7.6 KYOCERA
- 7.6.1 KYOCERA CORPORATION INFORMATION
- 7.6.2 KYOCERA DESCRIPTION, BUSINESS OVERVIEW
- 7.6.3 KYOCERA ELECTROSTATIC CHUCKS (ESCS) PRODUCTS OFFERED
- 7.6.4 KYOCERA ELECTROSTATIC CHUCKS (ESCS) SALES, REVENUE AND GROSS MARGIN (2018-2022)
- 7.7 NGK INSULATORS, LTD.
- 7.7.1 NGK INSULATORS, LTD. CORPORATION INFORMATION
- 7.7.2 NGK INSULATORS, LTD. DESCRIPTION, BUSINESS OVERVIEW
- 7.7.3 NGK INSULATORS, LTD. ELECTROSTATIC CHUCKS (ESCS) PRODUCTS OFFERED
- 7.7.4 NGK INSULATORS, LTD. ELECTROSTATIC CHUCKS (ESCS) SALES, REVENUE AND GROSS MARGIN (2018-2022)
- 7.8 NTK CERATEC
- 7.8.1 NTK CERATEC CORPORATION INFORMATION
- 7.8.2 NTK CERATEC DESCRIPTION, BUSINESS OVERVIEW
- 7.8.3 NTK CERATEC ELECTROSTATIC CHUCKS (ESCS) PRODUCTS OFFERED
- 7.8.4 NTK CERATEC ELECTROSTATIC CHUCKS (ESCS) SALES, REVENUE AND GROSS MARGIN (2018-2022)
- 7.9 TSUKUBA SEIKO
- 7.9.1 TSUKUBA SEIKO CORPORATION INFORMATION
- 7.9.2 TSUKUBA SEIKO DESCRIPTION, BUSINESS OVERVIEW
- 7.9.3 TSUKUBA SEIKO ELECTROSTATIC CHUCKS (ESCS) PRODUCTS OFFERED
- 7.9.4 TSUKUBA SEIKO ELECTROSTATIC CHUCKS (ESCS) SALES, REVENUE AND GROSS MARGIN (2018-2022)
- 7.10 II-VI M CUBED
- 7.10.1 II-VI M CUBED CORPORATION INFORMATION
- 7.10.2 II-VI M CUBED DESCRIPTION, BUSINESS OVERVIEW
- 7.10.3 II-VI M CUBED ELECTROSTATIC CHUCKS (ESCS) PRODUCTS OFFERED
- 7.10.4 II-VI INCORPORATED ELECTROSTATIC CHUCKS (ESCS) SALES, REVENUE AND GROSS MARGIN (2018-2022)
8 ELECTROSTATIC CHUCKS (ESCS) IN SEMICONDUCTOR MANUFACTURING COST ANALYSIS
- 8.1 ELECTROSTATIC CHUCKS (ESCS) IN SEMICONDUCTOR KEY RAW MATERIALS ANALYSIS
- 8.1.1 KEY RAW MATERIALS
- 8.1.2 KEY SUPPLIERS OF RAW MATERIALS
- 8.2 PROPORTION OF MANUFACTURING COST STRUCTURE
- 8.3 MANUFACTURING PROCESS ANALYSIS OF ELECTROSTATIC CHUCKS (ESCS) IN SEMICONDUCTOR
- 8.4 ELECTROSTATIC CHUCKS (ESCS) IN SEMICONDUCTOR INDUSTRIAL CHAIN ANALYSIS
- 8.5 GLOBAL ELECTROSTATIC CHUCKS (ESCS) IN SEMICONDUCTOR MARKET SHARE BY DOWNSTREAM CONSUMERS (2017-2022)
9 MARKETING CHANNEL, DISTRIBUTORS AND CUSTOMERS
- 9.1 MARKETING CHANNEL
- 9.2 ELECTROSTATIC CHUCKS (ESCS) IN SEMICONDUCTOR DISTRIBUTORS LIST
- 9.3 ELECTROSTATIC CHUCKS (ESCS) IN SEMICONDUCTOR CUSTOMERS
10 ELECTROSTATIC CHUCKS (ESCS) IN SEMICONDUCTOR MARKET DYNAMICS
- 10.1 ELECTROSTATIC CHUCKS (ESCS) IN SEMICONDUCTOR INDUSTRY TRENDS
- 10.2 ELECTROSTATIC CHUCKS (ESCS) IN SEMICONDUCTOR MARKET DRIVERS
- 10.3 ELECTROSTATIC CHUCKS (ESCS) IN SEMICONDUCTOR MARKET CHALLENGES
- 10.4 ELECTROSTATIC CHUCKS (ESCS) IN SEMICONDUCTOR MARKET RESTRAINTS
11 PRODUCTION AND SUPPLY FORECAST
- 11.1 GLOBAL FORECASTED PRODUCTION OF ELECTROSTATIC CHUCKS (ESCS) IN SEMICONDUCTOR BY REGION (2023-2028)
- 11.2 JAPAN ELECTROSTATIC CHUCKS (ESCS) IN SEMICONDUCTOR PRODUCTION, REVENUE FORECAST (2023-2028)
12 CONSUMPTION AND DEMAND FORECAST
- 12.1 GLOBAL FORECASTED DEMAND ANALYSIS OF ELECTROSTATIC CHUCKS (ESCS) IN SEMICONDUCTOR
- 12.2 NORTH AMERICA FORECASTED CONSUMPTION OF ELECTROSTATIC CHUCKS (ESCS) IN SEMICONDUCTOR
- 12.2.1 NORTH AMERICA FORECASTED CONSUMPTION OF ELECTROSTATIC CHUCKS (ESCS) IN SEMICONDUCTOR BY COUNTRY
- 12.2.2 NORTH AMERICA FORECASTED CONSUMPTION OF ELECTROSTATIC CHUCKS (ESCS) IN SEMICONDUCTOR BY TYPE
- 12.2.3 NORTH AMERICA FORECASTED CONSUMPTION OF ELECTROSTATIC CHUCKS (ESCS) IN SEMICONDUCTOR BY APPLICATION
- 12.3 EUROPE FORECASTED CONSUMPTION OF ELECTROSTATIC CHUCKS (ESCS) IN SEMICONDUCTOR
- 12.3.1 EUROPE FORECASTED CONSUMPTION OF ELECTROSTATIC CHUCKS (ESCS) IN SEMICONDUCTOR BY COUNTRY
- 12.3.2 EUROPE FORECASTED CONSUMPTION OF ELECTROSTATIC CHUCKS (ESCS) IN SEMICONDUCTOR BY TYPE
- 12.3.3 EUROPE FORECASTED CONSUMPTION OF ELECTROSTATIC CHUCKS (ESCS) IN SEMICONDUCTOR BY APPLICATION
- 12.4 ASIA PACIFIC FORECASTED CONSUMPTION OF ELECTROSTATIC CHUCKS (ESCS) IN SEMICONDUCTOR
- 12.4.1 ASIA PACIFIC FORECASTED CONSUMPTION OF ELECTROSTATIC CHUCKS (ESCS) IN SEMICONDUCTOR BY COUNTRY
- 12.4.2 ASIA PACIFIC FORECASTED CONSUMPTION OF ELECTROSTATIC CHUCKS (ESCS) IN SEMICONDUCTOR BY TYPE
- 12.4.3 ASIA PACIFIC FORECASTED CONSUMPTION OF ELECTROSTATIC CHUCKS (ESCS) IN SEMICONDUCTOR BY APPLICATION
- 12.5 LATIN AMERICA FORECASTED CONSUMPTION OF ELECTROSTATIC CHUCKS (ESCS) IN SEMICONDUCTOR
- 12.5.1 LATIN AMERICA FORECASTED CONSUMPTION OF ELECTROSTATIC CHUCKS (ESCS) IN SEMICONDUCTOR BY COUNTRY
- 12.5.2 LATIN AMERICA FORECASTED CONSUMPTION OF ELECTROSTATIC CHUCKS (ESCS) IN SEMICONDUCTOR BY TYPE
- 12.5.3 LATIN AMERICA FORECASTED CONSUMPTION OF ELECTROSTATIC CHUCKS (ESCS) IN SEMICONDUCTOR BY APPLICATION
- 12.6 MIDDLE EAST AND AFRICA FORECASTED CONSUMPTION OF ELECTROSTATIC CHUCKS (ESCS) IN SEMICONDUCTOR
- 12.6.1 MIDDLE EAST AND AFRICA FORECASTED CONSUMPTION OF ELECTROSTATIC CHUCKS (ESCS) IN SEMICONDUCTOR BY COUNTRY
- 12.6.2 MIDDLE EAST AND AFRICA FORECASTED CONSUMPTION OF ELECTROSTATIC CHUCKS (ESCS) IN SEMICONDUCTOR BY TYPE
- 12.6.3 MIDDLE EAST AND AFRICA FORECASTED CONSUMPTION OF ELECTROSTATIC CHUCKS (ESCS) IN SEMICONDUCTOR BY APPLICATION
13 FORECAST BY TYPE AND BY APPLICATION
- 13.1 GLOBAL SALES, REVENUE AND PRICE FORECAST BY TYPE (2023-2028)
- 13.1.1 GLOBAL FORECASTED SALES OF ELECTROSTATIC CHUCKS (ESCS) IN SEMICONDUCTOR BY TYPE (2023-2028)
- 13.1.2 GLOBAL FORECASTED REVENUE OF ELECTROSTATIC CHUCKS (ESCS) IN SEMICONDUCTOR BY TYPE (2023-2028)
- 13.1.3 GLOBAL FORECASTED PRICE OF ELECTROSTATIC CHUCKS (ESCS) IN SEMICONDUCTOR BY TYPE (2023-2028)
- 13.2 GLOBAL SALES, REVENUE AND PRICE FORECAST BY APPLICATION (2023-2028)
- 13.2.1 GLOBAL FORECASTED SALES OF ELECTROSTATIC CHUCKS (ESCS) IN SEMICONDUCTOR BY APPLICATION (2023-2028)
- 13.2.2 GLOBAL FORECASTED REVENUE OF ELECTROSTATIC CHUCKS (ESCS) IN SEMICONDUCTOR BY APPLICATION (2023-2028)
- 13.2.3 GLOBAL FORECASTED PRICE OF ELECTROSTATIC CHUCKS (ESCS) IN SEMICONDUCTOR BY APPLICATION (2023-2028)
14 RESEARCH FINDINGS AND CONCLUSION
15 METHODOLOGY AND DATA SOURCE
- 15.1 METHODOLOGY/RESEARCH APPROACH
- 15.1.1 RESEARCH PROGRAMS/DESIGN
- 15.1.2 MARKET SIZE ESTIMATION
- 15.1.3 MARKET BREAKDOWN AND DATA TRIANGULATION
- 15.2 DATA SOURCE
- 15.2.1 SECONDARY SOURCES
- 15.2.2 PRIMARY SOURCES
- 15.3 AUTHOR LIST
- 15.4 DISCLAIMER