|
|
市場調査レポート
商品コード
1068399
フラクトオリゴ糖(FOS)の世界市場の洞察、2028年までの予測Global Fructooligosaccharide (FOS) Market Insights, Forecast to 2028 |
||||||
|
|
|||||||
|
● お客様のご希望に応じて、既存データの加工や未掲載情報(例:国別セグメント)の追加などの対応が可能です。 詳細はお問い合わせください。 |
|||||||


| フラクトオリゴ糖(FOS)の世界市場の洞察、2028年までの予測 |
|
出版日: 2022年04月05日
発行: QYResearch
ページ情報: 英文 161 Pages
納期: 2~3営業日
|
- 全表示
- 概要
- 図表
- 目次
世界のフラクトオリゴ糖(FOS)の市場規模は、2021年に4億1,672万米ドルとなりました。
同市場は、2021年から2028年の間に3.77%のCAGRで成長する見通しで、2028年までに5億4,722万米ドルに達すると予測されています。また、販売量では、2017年の11万3,953MTから、2021年には12万4,970MTに増加しています。
当レポートでは、世界のフラクトオリゴ糖(FOS)市場について調査し、市場規模や予測、タイプ・用途・企業・地域別の市場分析、市場力学、競合情勢、主要企業のプロファイルなどの情報を提供しています。
目次
第1章 調査範囲
- フラクトオリゴ糖(FOS)の製品イントロダクション
- タイプ別市場
- 市場規模の成長率(2017 VS 2021 VS 2028)
- 液体FOS
- 固体FOS
- 用途別市場
- 市場規模の成長率(2017 VS 2021 VS 2028)
- 食品
- ベビー栄養製品
- 健康製品
- 調査目的
- 考察年
第2章 エグゼクティブサマリー
- 販売推計・予測(2017-2028)
- 収益推計・予測(2017-2028)
- 地域別:収益(2017 VS 2021 VS 2028)
- 地域別:販売
- 地域別:収益
- 北米
- 欧州
- アジア太平洋
- ラテンアメリカ
- 中東・アフリカ
第3章 メーカー別:競争
- メーカー別:販売
- メーカー別:収益
- メーカー別:販売価格(2017-2022)
- 競合情勢の分析
第4章 タイプ別の市場規模
- タイプ別:販売
- タイプ別:収益
- タイプ別:価格
第5章 用途別:市場規模
- 用途別:販売
- 用途別:収益
- 用途別:価格
第6章 北米
- タイプ別:市場規模
- 用途別:市場規模
- 国別:販売
- 販売(2017-2028)
- 収益(2017-2028)
- 米国
- カナダ
第7章 欧州
- タイプ別:市場規模
- 用途別:市場規模
- 国別:市場規模
- 販売(2017-2028)
- 収益(2017-2028)
- ドイツ
- フランス
- 英国
- イタリア
- オランダ
第8章 アジア太平洋
- タイプ別:市場規模
- 用途別:市場規模
- 地域別:市場規模
- 販売(2017-2028)
- 収益(2017-2028)
- 中国
- 日本
- 韓国
- オーストラリア
- 東南アジア
第9章 ラテンアメリカ
- タイプ別:市場規模
- 用途別:市場規模
- 国別:市場規模
- 販売(2017-2028)
- 収益(2017-2028)
- メキシコ
- ブラジル
第10章 中東とアフリカ
- タイプ別:市場規模
- 用途別:市場規模
- 国別:市場規模
- 販売(2017-2028)
- 収益(2017-2028)
- 中東
- アフリカ
第11章 企業概要
- Meiji
- QHT
- Beneo-Orafti
- Baolingbao Biology
- BMI
- Ingredion
- Sensus
- Bailong
- Cosucra
第12章 産業チェーンと販売チャネルの分析
- 産業チェーン分析
- 主要原材料
- 製造コスト構造比
- 製造プロセス分析
- 販売およびマーケティング
- 顧客
第13章 フラクトオリゴ糖(FOS)の市場力学
- 業界の動向
- 市場の促進要因
- 市場の課題
- 市場の抑制要因
第14章 世界のフラクトオリゴ糖(FOS)の主な調査結果
第15章 付録
LIST OF TABLES
- Table 1. Global Fructooligosaccharide (FOS) Market Size Growth Rate by Type, 2017 VS 2021 VS 2028 (US$ Million)
- Table 2. Global Fructooligosaccharide (FOS) Market Size Growth Rate by Application, 2017 VS 2021 VS 2028 (US$ Million)
- Table 3. Key Downstream Customer in Food
- Table 4. Key Downstream Customer
- Table 5. Key Downstream Customer
- Table 6. Global Fructooligosaccharide (FOS) Revenue by Region: 2017 VS 2021 VS 2028 (US$ Million)
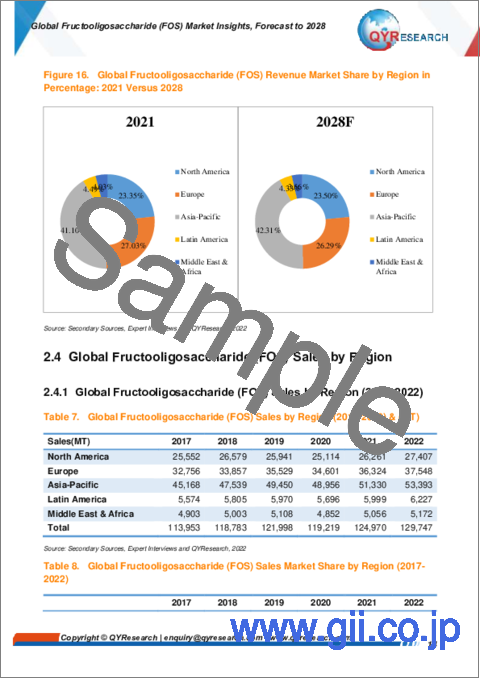
- Table 7. Global Fructooligosaccharide (FOS) Sales by Region (2017-2022) & (MT)
- Table 8. Global Fructooligosaccharide (FOS) Sales Market Share by Region (2017-2022)
- Table 9. Global Fructooligosaccharide (FOS) Sales by Region (2023-2028) & (MT)
- Table 10. Global Fructooligosaccharide (FOS) Sales Market Share by Region (2023-2028)
- Table 11. Global Fructooligosaccharide (FOS) Revenue by Region (2017-2022) & (US$ Million)
- Table 12. Global Fructooligosaccharide (FOS) Revenue Market Share by Region (2017-2022)
- Table 13. Global Fructooligosaccharide (FOS) Revenue by Region (2023-2028) & (US$ Million)
- Table 14. Global Fructooligosaccharide (FOS) Revenue Market Share by Region (2023-2028)
- Table 15. Global Fructooligosaccharide (FOS) Sales by Manufacturers (2017-2022) & (MT)
- Table 16. Global Fructooligosaccharide (FOS) Sales Share by Manufacturers (2017-2022)
- Table 17. Global Fructooligosaccharide (FOS) Revenue by Manufacturers (2017-2022) & (US$ Million)
- Table 18. Global Fructooligosaccharide (FOS) Revenue Market Share by Manufacturers (2017-2022)
- Table 19. Fructooligosaccharide (FOS) Price by Manufacturers (2017-2022) & (USD/MT)
- Table 20. Global Fructooligosaccharide (FOS) Manufacturers Market Concentration Ratio (CR5 and HHI)
- Table 21. Global Fructooligosaccharide (FOS) by Company Type (Tier 1, Tier 2, and Tier 3) & (based on the Revenue in Fructooligosaccharide (FOS) as of 2021)
- Table 22. Fructooligosaccharide (FOS) Manufacturing Base Distribution and Headquarters
- Table 23. Date of Manufacturers Enter into Fructooligosaccharide (FOS) Market
- Table 24. Global Fructooligosaccharide (FOS) Sales by Type (2017-2022) & (MT)
- Table 25. Global Fructooligosaccharide (FOS) Sales by Type (2023-2028) & (MT)
- Table 26. Global Fructooligosaccharide (FOS) Sales Share by Type (2017-2022)
- Table 27. Global Fructooligosaccharide (FOS) Sales Share by Type (2023-2028)
- Table 28. Global Fructooligosaccharide (FOS) Revenue by Type (2017-2022) & (US$ Million)
- Table 29. Global Fructooligosaccharide (FOS) Revenue by Type (2023-2028) & (US$ Million)
- Table 30. Global Fructooligosaccharide (FOS) Revenue Share by Type (2017-2022)
- Table 31. Global Fructooligosaccharide (FOS) Revenue Share by Type (2023-2028)
- Table 32. Fructooligosaccharide (FOS) Price by Type (2017-2022) & (USD/MT)
- Table 33. Global Fructooligosaccharide (FOS) Price Forecast by Type (2023-2028) & (USD/MT)
- Table 34. Global Fructooligosaccharide (FOS) Sales by Application (2017-2022) & (MT)
- Table 35. Global Fructooligosaccharide (FOS) Sales by Application (2023-2028) & (MT)
- Table 36. Global Fructooligosaccharide (FOS) Sales Share by Application (2017-2022)
- Table 37. Global Fructooligosaccharide (FOS) Sales Share by Application (2023-2028)
- Table 38. Global Fructooligosaccharide (FOS) Revenue by Application (2017-2022) & (US$ Million)
- Table 39. Global Fructooligosaccharide (FOS) Revenue by Application (2023-2028) & (US$ Million)
- Table 40. Global Fructooligosaccharide (FOS) Revenue Share by Application (2017-2022)
- Table 41. Global Fructooligosaccharide (FOS) Revenue Share by Application (2023-2028)
- Table 42. Fructooligosaccharide (FOS) Price by Application (2017-2022) & (USD/MT)
- Table 43. Global Fructooligosaccharide (FOS) Price Forecast by Application (2023-2028) & (USD/MT)
- Table 44. North America Fructooligosaccharide (FOS) Sales by Type (2017-2022) & (MT)
- Table 45. North America Fructooligosaccharide (FOS) Sales by Type (2023-2028) & (MT)
- Table 46. North America Fructooligosaccharide (FOS) Revenue by Type (2017-2022) & (US$ Million)
- Table 47. North America Fructooligosaccharide (FOS) Revenue by Type (2023-2028) & (US$ Million)
- Table 48. North America Fructooligosaccharide (FOS) Sales by Application (2017-2022) & (MT)
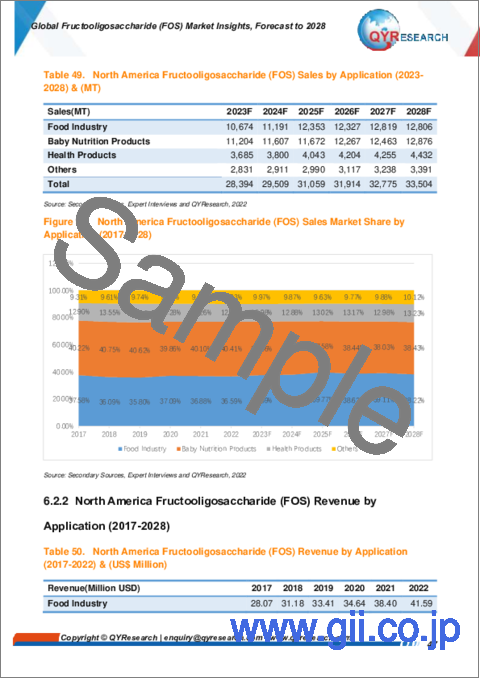
- Table 49. North America Fructooligosaccharide (FOS) Sales by Application (2023-2028) & (MT)
- Table 50. North America Fructooligosaccharide (FOS) Revenue by Application (2017-2022) & (US$ Million)
- Table 51. North America Fructooligosaccharide (FOS) Revenue by Application (2023-2028) & (US$ Million)
- Table 52. North America Fructooligosaccharide (FOS) Sales by Country (2017-2022) & (MT)
- Table 53. North America Fructooligosaccharide (FOS) Sales by Country (2023-2028) & (MT)
- Table 54. North America Fructooligosaccharide (FOS) Revenue by Country (2017-2022) & (US$ Million)
- Table 55. North America Fructooligosaccharide (FOS) Revenue by Country (2023-2028) & (US$ Million)
- Table 56. Europe Fructooligosaccharide (FOS) Sales by Type (2017-2022) & (MT)
- Table 57. Europe Fructooligosaccharide (FOS) Sales by Type (2023-2028) & (MT)
- Table 58. Europe Fructooligosaccharide (FOS) Revenue by Type (2017-2022) & (US$ Million)
- Table 59. Europe Fructooligosaccharide (FOS) Revenue by Type (2023-2028) & (US$ Million)
- Table 60. Europe Fructooligosaccharide (FOS) Sales by Application (2017-2022) & (MT)
- Table 61. Europe Fructooligosaccharide (FOS) Sales by Application (2023-2028) & (MT)
- Table 62. Europe Fructooligosaccharide (FOS) Revenue by Application (2017-2022) & (US$ Million)
- Table 63. Europe Fructooligosaccharide (FOS) Revenue by Application (2023-2028) & (US$ Million)
- Table 64. Europe Fructooligosaccharide (FOS) Sales by Country (2017-2022) & (MT)
- Table 65. Europe Fructooligosaccharide (FOS) Sales by Country (2023-2028) & (MT)
- Table 66. Europe Fructooligosaccharide (FOS) Revenue by Country (2017-2022) & (US$ Million)
- Table 67. Europe Fructooligosaccharide (FOS) Revenue by Country (2023-2028) & (US$ Million)
- Table 68. Asia Pacific Fructooligosaccharide (FOS) Sales by Type (2017-2022) & (MT)
- Table 69. Asia Pacific Fructooligosaccharide (FOS) Sales by Type (2023-2028) & (MT)
- Table 70. Asia Pacific Fructooligosaccharide (FOS) Revenue by Type (2017-2022) & (US$ Million)
- Table 71. Asia Pacific Fructooligosaccharide (FOS) Revenue by Type (2023-2028) & (US$ Million)
- Table 72. Asia Pacific Fructooligosaccharide (FOS) Sales by Application (2017-2022) & (MT)
- Table 73. Asia Pacific Fructooligosaccharide (FOS) Sales by Application (2023-2028) & (MT)
- Table 74. Asia Pacific Fructooligosaccharide (FOS) Revenue by Application (2017-2022) & (US$ Million)
- Table 75. Asia Pacific Fructooligosaccharide (FOS) Revenue by Application (2023-2028) & (US$ Million)
- Table 76. Asia Pacific Fructooligosaccharide (FOS) Sales by Region (2017-2022) & (MT)
- Table 77. Asia Pacific Fructooligosaccharide (FOS) Sales by Region (2023-2028) & (MT)
- Table 78. Asia Pacific Fructooligosaccharide (FOS) Revenue by Region (2017-2022) & (US$ Million)
- Table 79. Asia Pacific Fructooligosaccharide (FOS) Revenue by Region (2023-2028) & (US$ Million)
- Table 80. Latin America Fructooligosaccharide (FOS) Sales by Type (2017-2022) & (MT)
- Table 81. Latin America Fructooligosaccharide (FOS) Sales by Type (2023-2028) & (MT)
- Table 82. Latin America Fructooligosaccharide (FOS) Revenue by Type (2017-2022) & (US$ Million)
- Table 83. Latin America Fructooligosaccharide (FOS) Revenue by Type (2023-2028) & (US$ Million)
- Table 84. Latin America Fructooligosaccharide (FOS) Sales by Application (2017-2022) & (MT)
- Table 85. Latin America Fructooligosaccharide (FOS) Sales by Application (2023-2028) & (MT)
- Table 86. Latin America Fructooligosaccharide (FOS) Revenue by Application (2017-2022) & (US$ Million)
- Table 87. Latin America Fructooligosaccharide (FOS) Revenue by Application (2023-2028) & (US$ Million)
- Table 88. Latin America Fructooligosaccharide (FOS) Sales by Country (2017-2022) & (MT)
- Table 89. Latin America Fructooligosaccharide (FOS) Sales by Country (2023-2028) & (MT)
- Table 90. Latin America Fructooligosaccharide (FOS) Revenue by Country (2017-2022) & (US$ Million)
- Table 91. Latin America Fructooligosaccharide (FOS) Revenue by Country (2023-2028) & (US$ Million)
- Table 92. Middle East and Africa Fructooligosaccharide (FOS) Sales by Type (2017-2022) & (MT)
- Table 93. Middle East and Africa Fructooligosaccharide (FOS) Sales by Type (2023-2028) & (MT)
- Table 94. Middle East and Africa Fructooligosaccharide (FOS) Revenue by Type (2017-2022) & (US$ Million)
- Table 95. Middle East and Africa Fructooligosaccharide (FOS) Revenue by Type (2023-2028) & (US$ Million)
- Table 96. Middle East and Africa Fructooligosaccharide (FOS) Sales by Application (2017-2022) & (MT)
- Table 97. Middle East and Africa Fructooligosaccharide (FOS) Sales by Application (2023-2028) & (MT)
- Table 98. Middle East and Africa Fructooligosaccharide (FOS) Revenue by Application (2017-2022) & (US$ Million)
- Table 99. Middle East and Africa Fructooligosaccharide (FOS) Revenue by Application (2023-2028) & (US$ Million)
- Table 100. Middle East and Africa Fructooligosaccharide (FOS) Sales by Country (2017-2022) & (MT)
- Table 101. Middle East and Africa Fructooligosaccharide (FOS) Sales by Country (2023-2028) & (MT)
- Table 102. Middle East and Africa Fructooligosaccharide (FOS) Revenue by Country (2017-2022) & (US$ Million)
- Table 103. Middle East and Africa Fructooligosaccharide (FOS) Revenue by Country (2023-2028) & (US$ Million)
- Table 104. Meiji Corporation Information
- Table 105. Meiji Description and Major Businesses
- Table 106. Meiji Fructooligosaccharide (FOS) Sales (MT), Revenue (US$ Million), Price (USD/MT) and Gross Margin (2017-2022)
- Table 107. QHT Corporation Information
- Table 108. QHT Description and Major Businesses
- Table 109. QHT Fructooligosaccharide (FOS) Sales (MT), Revenue (US$ Million), Price (USD/MT) and Gross Margin (2017-2022)
- Table 110. QHT Fructooligosaccharide (FOS) Product Model Numbers, Pictures, Descriptions and Specifications
- Table 111. Beneo-Orafti Corporation Information
- Table 112. Beneo-Orafti Description and Major Businesses
- Table 113. Beneo-Orafti Fructooligosaccharide (FOS) Sales (MT), Revenue (US$ Million), Price (USD/MT) and Gross Margin (2017-2022)
- Table 114. Beneo-Orafti Fructooligosaccharide (FOS) Product
- Table 115. Baolingbao Biology Corporation Information
- Table 116. Baolingbao Biology Description and Major Businesses
- Table 117. Baolingbao Biology Fructooligosaccharide (FOS) Sales (MT), Revenue (US$ Million), Price (USD/MT) and Gross Margin (2017-2022)
- Table 118. Baolingbao Biology Fructooligosaccharide (FOS) Product Model Numbers, Pictures, Descriptions and Specifications
- Table 119. BMI Corporation Information
- Table 120. BMI Description and Major Businesses
- Table 121. BMI Fructooligosaccharide (FOS) Sales (MT), Revenue (US$ Million), Price (USD/MT) and Gross Margin (2017-2022)
- Table 122. BMI Fructooligosaccharide (FOS) Product Model Numbers, Pictures, Descriptions and Specifications
- Table 123. Ingredion Corporation Information
- Table 124. Ingredion Description and Major Businesses
- Table 125. Ingredion Fructooligosaccharide (FOS) Sales (MT), Revenue (US$ Million), Price (USD/MT) and Gross Margin (2017-2022)
- Table 126. Sensus Corporation Information
- Table 127. Sensus Description and Major Businesses
- Table 128. Sensus Fructooligosaccharide (FOS) Sales (MT), Revenue (US$ Million), Price (USD/MT) and Gross Margin (2017-2022)
- Table 129. Bailong Corporation Information
- Table 130. Bailong Description and Major Businesses
- Table 131. Bailong Fructooligosaccharide (FOS) Sales (MT), Revenue (US$ Million), Price (USD/MT) and Gross Margin (2017-2022)
- Table 132. Bailong Fructooligosaccharide (FOS) Product Model Numbers, Pictures, Descriptions and Specifications
- Table 133. Cosucra Corporation Information
- Table 134. Cosucra Description and Major Businesses
- Table 135. Cosucra Fructooligosaccharide (FOS) Sales (MT), Revenue (US$ Million), Price (USD/MT) and Gross Margin (2017-2022)
- Table 136. Cosucra Fructooligosaccharide (FOS) Product Model Numbers, Pictures, Descriptions and Specifications
- Table 137. Cosucra Recent Developments
- Table 138. Key Raw Materials Lists
- Table 139. Chicory Capacity and Planting Area of Beneo, Sensus and Cosucra
- Table 140. Average Chicory Production of Beneo, Sensus and Cosucra
- Table 141. Income of Farmer of Beneo, Sensus and Cosucra
- Table 142. Raw Materials Cost Analysis of Three Companies
- Table 143. Key Suppliers of Raw Materials
- Table 144. Fructooligosaccharide (FOS) Distributors List
- Table 145. Fructooligosaccharide (FOS) Customers List
- Table 146. Fructooligosaccharide (FOS) Market Trends
- Table 147. Fructooligosaccharide (FOS) Market Drivers
- Table 148. Fructooligosaccharide (FOS) Market Challenges
- Table 149. Fructooligosaccharide (FOS) Market Restraints
- Table 150. Research Programs/Design for This Report
- Table 151. Key Data Information from Secondary Sources
- Table 152. Key Data Information from Primary Sources
List of Figures
- Figure 1. Fructooligosaccharide (FOS) Product Picture
- Figure 2. Chemical Composition of Inulin and Fructooligosaccharide
- Figure 3. Global Fructooligosaccharide (FOS) Market Size Growth Rate by Type, 2017 VS 2021 VS 2028 (US$ Million)
- Figure 4. Global Fructooligosaccharide (FOS) Market Share by Type: 2021 & 2028
- Figure 5. Liquid FOS Product Picture
- Figure 6. Solid FOS Product Picture
- Figure 7. Global Fructooligosaccharide (FOS) Market Size Growth Rate by Application, 2017 VS 2021 VS 2028 (US$ Million)
- Figure 8. Global Fructooligosaccharide (FOS) Market Share by Application: 2021 & 2028
- Figure 9. Food
- Figure 10. Baby Nutrition Products
- Figure 11. Health Products
- Figure 12. Fructooligosaccharide (FOS) Report Years Considered
- Figure 13. Global Fructooligosaccharide (FOS) Sales 2017-2028 (MT)
- Figure 14. Global Fructooligosaccharide (FOS) Revenue, (US$ Million), 2017 VS 2021 VS 2028
- Figure 15. Global Fructooligosaccharide (FOS) Revenue 2017-2028 (US$ Million)
- Figure 16. Global Fructooligosaccharide (FOS) Revenue Market Share by Region in Percentage: 2021 Versus 2028
- Figure 17. Global Fructooligosaccharide (FOS) Sales Market Share by Region (2017-2022)
- Figure 18. Global Fructooligosaccharide (FOS) Sales Market Share by Region (2023-2028)
- Figure 19. North America Fructooligosaccharide (FOS) Sales YoY (2017-2028) & (MT)
- Figure 20. North America Fructooligosaccharide (FOS) Revenue YoY (2017-2028) & (US$ Million)
- Figure 21. Europe Fructooligosaccharide (FOS) Sales YoY (2017-2028) & (MT)
- Figure 22. Europe Fructooligosaccharide (FOS) Revenue YoY (2017-2028) & (US$ Million)
- Figure 23. Asia-Pacific Fructooligosaccharide (FOS) Sales YoY (2017-2028) & (MT)
- Figure 24. Asia-Pacific Fructooligosaccharide (FOS) Revenue YoY (2017-2028) & (US$ Million)
- Figure 25. Latin America Fructooligosaccharide (FOS) Sales YoY (2017-2028) & (MT)
- Figure 26. Latin America Fructooligosaccharide (FOS) Revenue YoY (2017-2028) & (US$ Million)
- Figure 27. Middle East & Africa Fructooligosaccharide (FOS) Sales YoY (2017-2028) & (MT)
- Figure 28. Middle East & Africa Fructooligosaccharide (FOS) Revenue YoY (2017-2028) & (US$ Million)
- Figure 29. The Fructooligosaccharide (FOS) Market Share of Top 3 and Top 5 Largest Manufacturers Around the World in 2021
- Figure 30. The Top 5 and 3 Largest Manufacturers of Fructooligosaccharide (FOS) in the World: Market Share by Fructooligosaccharide (FOS) Revenue in 2021
- Figure 31. Global Fructooligosaccharide (FOS) Sales Market Share by Type (2017-2028)
- Figure 32. Global Fructooligosaccharide (FOS) Revenue Market Share by Type (2017-2028)
- Figure 33. Global Fructooligosaccharide (FOS) Sales Market Share by Application (2017-2028)
- Figure 34. Global Fructooligosaccharide (FOS) Revenue Market Share by Application (2017-2028)
- Figure 35. North America Fructooligosaccharide (FOS) Sales Market Share by Type (2017-2028)
- Figure 36. North America Fructooligosaccharide (FOS) Revenue Market Share by Type (2017-2028)
- Figure 37. North America Fructooligosaccharide (FOS) Sales Market Share by Application (2017-2028)
- Figure 38. North America Fructooligosaccharide (FOS) Revenue Market Share by Application (2017-2028)
- Figure 39. North America Fructooligosaccharide (FOS) Sales Share by Country (2017-2028)
- Figure 40. North America Fructooligosaccharide (FOS) Revenue Share by Country (2017-2028)
- Figure 41. U.S. Fructooligosaccharide (FOS) Revenue (2017-2028) & (US$ Million)
- Figure 42. Canada Fructooligosaccharide (FOS) Revenue (2017-2028) & (US$ Million)
- Figure 43. Europe Fructooligosaccharide (FOS) Sales Market Share by Type (2017-2028)
- Figure 44. Europe Fructooligosaccharide (FOS) Revenue Market Share by Type (2017-2028)
- Figure 45. Europe Fructooligosaccharide (FOS) Sales Market Share by Application (2017-2028)
- Figure 46. Europe Fructooligosaccharide (FOS) Revenue Market Share by Application (2017-2028)
- Figure 47. Europe Fructooligosaccharide (FOS) Sales Share by Country (2017-2028)
- Figure 48. Europe Fructooligosaccharide (FOS) Revenue Share by Country (2017-2028)
- Figure 49. Germany Fructooligosaccharide (FOS) Revenue (2017-2028) & (US$ Million)
- Figure 50. France Fructooligosaccharide (FOS) Revenue (2017-2028) & (US$ Million)
- Figure 51. U.K. Fructooligosaccharide (FOS) Revenue (2017-2028) & (US$ Million)
- Figure 52. Italy Fructooligosaccharide (FOS) Revenue (2017-2028) & (US$ Million)
- Figure 53. Netherlands Fructooligosaccharide (FOS) Revenue (2017-2028) & (US$ Million)
- Figure 54. Asia Pacific Fructooligosaccharide (FOS) Sales Market Share by Type (2017-2028)
- Figure 55. Asia Pacific Fructooligosaccharide (FOS) Revenue Market Share by Type (2017-2028)
- Figure 56. Asia Pacific Fructooligosaccharide (FOS) Sales Market Share by Application (2017-2028)
- Figure 57. Asia Pacific Fructooligosaccharide (FOS) Revenue Market Share by Application (2017-2028)
- Figure 58. Asia Pacific Fructooligosaccharide (FOS) Sales Share by Region (2017-2028)
- Figure 59. Asia Pacific Fructooligosaccharide (FOS) Revenue Share by Region (2017-2028)
- Figure 60. China Fructooligosaccharide (FOS) Revenue (2017-2028) & (US$ Million)
- Figure 61. Japan Fructooligosaccharide (FOS) Revenue (2017-2028) & (US$ Million)
- Figure 62. South Korea Fructooligosaccharide (FOS) Revenue (2017-2028) & (US$ Million)
- Figure 63. Australia Fructooligosaccharide (FOS) Revenue (2017-2028) & (US$ Million)
- Figure 64. Southeast Asia Taiwan Fructooligosaccharide (FOS) Revenue (2017-2028) & (US$ Million)
- Figure 65. Latin America Fructooligosaccharide (FOS) Sales Market Share by Type (2017-2028)
- Figure 66. Latin America Fructooligosaccharide (FOS) Revenue Market Share by Type (2017-2028)
- Figure 67. Latin America Fructooligosaccharide (FOS) Sales Market Share by Application (2017-2028)
- Figure 68. Latin America Fructooligosaccharide (FOS) Revenue Market Share by Application (2017-2028)
- Figure 69. Latin America Fructooligosaccharide (FOS) Sales Share by Country (2017-2028)
- Figure 70. Latin America Fructooligosaccharide (FOS) Revenue Share by Country (2017-2028)
- Figure 71. Mexico Fructooligosaccharide (FOS) Revenue (2017-2028) & (US$ Million)
- Figure 72. Brazil Fructooligosaccharide (FOS) Revenue (2017-2028) & (US$ Million)
- Figure 73. Middle East and Africa Fructooligosaccharide (FOS) Sales Market Share by Type (2017-2028)
- Figure 74. Middle East and Africa Fructooligosaccharide (FOS) Revenue Market Share by Type (2017-2028)
- Figure 75. Middle East and Africa Fructooligosaccharide (FOS) Sales Market Share by Application (2017-2028)
- Figure 76. Middle East and Africa Fructooligosaccharide (FOS) Revenue Market Share by Application (2017-2028)
- Figure 77. Middle East and Africa Fructooligosaccharide (FOS) Sales Share by Country (2017-2028)
- Figure 78. Middle East and Africa Fructooligosaccharide (FOS) Revenue Share by Country (2017-2028)
- Figure 79. Middle East Fructooligosaccharide (FOS) Revenue (2017-2028) & (US$ Million)
- Figure 80. Africa Fructooligosaccharide (FOS) Revenue (2017-2028) & (US$ Million)
- Figure 81. Meiji Fructooligosaccharide (FOS) Product
- Figure 82. Sensus Fructooligosaccharide (FOS) Product
- Figure 83. Fructooligosaccharide (FOS) Value Chain
- Figure 84. Plant and Harvest of Chicory
- Figure 85. Production Process of Orafti HP lc-inulin
- Figure 86. Industrial Chain Cosucra
- Figure 87. Manufacturing Cost Structure of Fructooligosaccharide (FOS)
- Figure 88. Manufacturing Process Analysis of 50% Fructooligosaccharide (FOS) from Sucrose
- Figure 89. Manufacturing Process Analysis of 50% Fructooligosaccharide (FOS) from Artichoke
- Figure 90. Channels of Distribution (Direct Vs Distribution)
- Figure 91. Distributors Profiles
- Figure 92. Bottom-up and Top-down Approaches for This Report
- Figure 93. Data Triangulation
- Figure 94. Key Executives Interviewed
Market Analysis and Insights:
The global sales of Fructooligosaccharide (FOS) increased from 113,953 MT in 2017 to 124,970 MT. In 2021, the global Fructooligosaccharide (FOS) market size was US$ 416.72 million and it will reach US$ 547.22 million in 2028, growing at CAGR of 3.77% between 2021 and 2028.
Scope and Segment:
Fructooligosaccharide (FOS) market is segmented by Type, and by Application. Players, stakeholders, and other participants in the global Fructooligosaccharide (FOS) market will be able to gain the upper hand as they use the report as a powerful resource. The segmental analysis focuses on sales, revenue and forecast by Type, and by Application for the period 2017-2028.
By Company
- Meiji
- QHT
- Beneo-Orafti
- Baolingbao Biology
- BMI
- Ingredion
- Sensus
- Bailong
- Cosucra
Segment by Type
- Liquid FOS
- Solid FOS
Segment by Application
- Food
- Baby Nutrition Products
- Health Products
- Others
Segment by Region
- North America
- U.S.
- Canada
- Asia-Pacific
- China
- Japan
- Korea
- Australia
- Southeast Asia
- Europe
- Germany
- France
- U.K.
- Italy
- Netherlands
- Latin America
- Mexico
- Brazil
- Middle East & Africa
TABLE OF CONTENTS
1 STUDY COVERAGE
- 1.1 Fructooligosaccharide (FOS) Product Introduction
- 1.2 Market by Type
- 1.2.1 Global Fructooligosaccharide (FOS) Market Size Growth Rate by Type, 2017 VS 2021 VS 2028
- 1.2.2 Liquid FOS
- 1.2.3 Solid FOS
- 1.3 Market by Application
- 1.3.1 Global Fructooligosaccharide (FOS) Market Size Growth Rate by Application, 2017 VS 2021 VS 2028
- 1.3.2 Food
- 1.3.3 Baby Nutrition Products
- 1.3.4 Health Products
- 1.4 Study Objectives
- 1.5 Years Considered
2 EXECUTIVE SUMMARY
- 2.1 Global Fructooligosaccharide (FOS) Sales Estimates and Forecasts 2017-2028
- 2.2 Global Fructooligosaccharide (FOS) Revenue Estimates and Forecasts 2017-2028
- 2.3 Global Fructooligosaccharide (FOS) Revenue by Region: 2017 VS 2021 VS 2028
- 2.4 Global Fructooligosaccharide (FOS) Sales by Region
- 2.4.1 Global Fructooligosaccharide (FOS) Sales by Region (2017-2022)
- 2.4.2 Global Sales Fructooligosaccharide (FOS) by Region (2023-2028)
- 2.5 Global Fructooligosaccharide (FOS) Revenue by Region
- 2.5.1 Global Fructooligosaccharide (FOS) Revenue by Region (2017-2022)
- 2.5.2 Global Fructooligosaccharide (FOS) Revenue by Region (2023-2028)
- 2.6 North America
- 2.7 Europe
- 2.8 Asia-Pacific
- 2.9 Latin America
- 2.10 Middle East & Africa
3 COMPETITION BY MANUFACTURERS
- 3.1 Global Fructooligosaccharide (FOS) Sales by Manufacturers
- 3.1.1 Global Fructooligosaccharide (FOS) Sales by Manufacturers (2017-2022)
- 3.1.2 Global Fructooligosaccharide (FOS) Sales Market Share by Manufacturers (2017-2022)
- 3.1.3 Global Top 3 and Top 5 Largest Manufacturers of Fructooligosaccharide (FOS) in 2021
- 3.2 Global Fructooligosaccharide (FOS) Revenue by Manufacturers
- 3.2.1 Global Fructooligosaccharide (FOS) Revenue by Manufacturers (2017-2022)
- 3.2.2 Global Fructooligosaccharide (FOS) Revenue Market Share by Manufacturers (2017-2022)
- 3.2.3 Global Top 3 and Top 5 Companies by Fructooligosaccharide (FOS) Revenue in 2021
- 3.3 Global Fructooligosaccharide (FOS) Sales Price by Manufacturers (2017-2022)
- 3.4 Analysis of Competitive Landscape
- 3.4.1 Manufacturers Market Concentration Ratio (CR5 and HHI)
- 3.4.2 Global Fructooligosaccharide (FOS) Market Share by Company Type (Tier 1, Tier 2, and Tier 3)
- 3.4.3 Global Fructooligosaccharide (FOS) Manufacturers Geographical Distribution
4 MARKET SIZE BY TYPE
- 4.1 Global Fructooligosaccharide (FOS) Sales by Type
- 4.1.1 Global Fructooligosaccharide (FOS) Historical Sales by Type (2017-2022)
- 4.1.2 Global Fructooligosaccharide (FOS) Forecasted Sales by Type (2023-2028)
- 4.1.3 Global Fructooligosaccharide (FOS) Sales Market Share by Type (2017-2028)
- 4.2 Global Fructooligosaccharide (FOS) Revenue by Type
- 4.2.1 Global Fructooligosaccharide (FOS) Historical Revenue by Type (2017-2022)
- 4.2.2 Global Fructooligosaccharide (FOS) Forecasted Revenue by Type (2023-2028)
- 4.2.3 Global Fructooligosaccharide (FOS) Revenue Market Share by Type (2017-2028)
- 4.3 Global Fructooligosaccharide (FOS) Price by Type
- 4.3.1 Global Fructooligosaccharide (FOS) Price by Type (2017-2022)
- 4.3.2 Global Fructooligosaccharide (FOS) Price Forecast by Type (2023-2028)
5 MARKET SIZE BY APPLICATION
- 5.1 Global Fructooligosaccharide (FOS) Sales by Application
- 5.1.1 Global Fructooligosaccharide (FOS) Historical Sales by Application (2017-2022)
- 5.1.2 Global Fructooligosaccharide (FOS) Forecasted Sales by Application (2023-2028)
- 5.1.3 Global Fructooligosaccharide (FOS) Sales Market Share by Application (2017-2028)
- 5.2 Global Fructooligosaccharide (FOS) Revenue by Application
- 5.2.1 Global Fructooligosaccharide (FOS) Historical Revenue by Application (2017-2022)
- 5.2.2 Global Fructooligosaccharide (FOS) Forecasted Revenue by Application (2023-2028)
- 5.2.3 Global Fructooligosaccharide (FOS) Revenue Market Share by Application (2017-2028)
- 5.3 Global Fructooligosaccharide (FOS) Price by Application
- 5.3.1 Global Fructooligosaccharide (FOS) Price by Application (2017-2022)
- 5.3.2 Global Fructooligosaccharide (FOS) Price Forecast by Application (2023-2028)
6 NORTH AMERICA
- 6.1 North America Fructooligosaccharide (FOS) Market Size by Type
- 6.1.1 North America Fructooligosaccharide (FOS) Sales by Type (2017-2028)
- 6.1.2 North America Fructooligosaccharide (FOS) Revenue by Type (2017-2028)
- 6.2 North America Fructooligosaccharide (FOS) Market Size by Application
- 6.2.1 North America Fructooligosaccharide (FOS) Sales by Application (2017-2028)
- 6.2.2 North America Fructooligosaccharide (FOS) Revenue by Application (2017-2028)
- 6.3 North America Fructooligosaccharide (FOS) Sales by Country
- 6.3.1 North America Fructooligosaccharide (FOS) Sales by Country (2017-2028)
- 6.3.2 North America Fructooligosaccharide (FOS) Revenue by Country (2017-2028)
- 6.3.3 U.S.
- 6.3.4 Canada
7 EUROPE
- 7.1 Europe Fructooligosaccharide (FOS) Market Size by Type
- 7.1.1 Europe Fructooligosaccharide (FOS) Sales by Type (2017-2028)
- 7.1.2 Europe Fructooligosaccharide (FOS) Revenue by Type (2017-2028)
- 7.2 Europe Fructooligosaccharide (FOS) Market Size by Application
- 7.2.1 Europe Fructooligosaccharide (FOS) Sales by Application (2017-2028)
- 7.2.2 Europe Fructooligosaccharide (FOS) Revenue by Application (2017-2028)
- 7.3 Europe Fructooligosaccharide (FOS) Market Size by Country
- 7.3.1 Europe Fructooligosaccharide (FOS) Sales by Country (2017-2028)
- 7.3.2 Europe Fructooligosaccharide (FOS) Revenue by Country (2017-2028)
- 7.3.3 Germany
- 7.3.4 France
- 7.3.5 U.K.
- 7.3.6 Italy
- 7.3.7 Netherlands
8 ASIA PACIFIC
- 8.1 Asia Pacific Fructooligosaccharide (FOS) Market Size by Type
- 8.1.1 Asia Pacific Fructooligosaccharide (FOS) Sales by Type (2017-2028)
- 8.1.2 Asia Pacific Fructooligosaccharide (FOS) Revenue by Type (2017-2028)
- 8.2 Asia Pacific Fructooligosaccharide (FOS) Market Size by Application
- 8.2.1 Asia Pacific Fructooligosaccharide (FOS) Sales by Application (2017-2028)
- 8.2.2 Asia Pacific Fructooligosaccharide (FOS) Revenue by Application (2017-2028)
- 8.3 Asia Pacific Fructooligosaccharide (FOS) Market Size by Region
- 8.3.1 Asia Pacific Fructooligosaccharide (FOS) Sales by Region (2017-2028)
- 8.3.2 Asia Pacific Fructooligosaccharide (FOS) Revenue by Region (2017-2028)
- 8.3.3 China
- 8.3.4 Japan
- 8.3.5 South Korea
- 8.3.6 Australia
- 8.3.7 Southeast Asia
9 LATIN AMERICA
- 9.1 Latin America Fructooligosaccharide (FOS) Market Size by Type
- 9.1.1 Latin America Fructooligosaccharide (FOS) Sales by Type (2017-2028)
- 9.1.2 Latin America Fructooligosaccharide (FOS) Revenue by Type (2017-2028)
- 9.2 Latin America Fructooligosaccharide (FOS) Market Size by Application
- 9.2.1 Latin America Fructooligosaccharide (FOS) Sales by Application (2017-2028)
- 9.2.2 Latin America Fructooligosaccharide (FOS) Revenue by Application (2017-2028)
- 9.3 Latin America Fructooligosaccharide (FOS) Market Size by Country
- 9.3.1 Latin America Fructooligosaccharide (FOS) Sales by Country (2017-2028)
- 9.3.2 Latin America Fructooligosaccharide (FOS) Revenue by Country (2017-2028)
- 9.3.3 Mexico
- 9.3.4 Brazil
10 MIDDLE EAST AND AFRICA
- 10.1 Middle East and Africa Fructooligosaccharide (FOS) Market Size by Type
- 10.1.1 Middle East and Africa Fructooligosaccharide (FOS) Sales by Type (2017-2028)
- 10.1.2 Middle East and Africa Fructooligosaccharide (FOS) Revenue by Type (2017-2028)
- 10.2 Middle East and Africa Fructooligosaccharide (FOS) Market Size by Application
- 10.2.1 Middle East and Africa Fructooligosaccharide (FOS) Sales by Application (2017-2028)
- 10.2.2 Middle East and Africa Fructooligosaccharide (FOS) Revenue by Application (2017-2028)
- 10.3 Middle East and Africa Fructooligosaccharide (FOS) Market Size by Country
- 10.3.1 Middle East and Africa Fructooligosaccharide (FOS) Sales by Country (2017-2028)
- 10.3.2 Middle East and Africa Fructooligosaccharide (FOS) Revenue by Country (2017-2028)
- 10.3.3 Middle East
- 10.3.4 Africa
11 CORPORATE PROFILE
- 11.1 Meiji
- 11.1.1 Meiji Corporation Information
- 11.1.2 Meiji Overview
- 11.1.3 Meiji Fructooligosaccharide (FOS) Sales, Price, Revenue and Gross Margin (2017-2022)
- 11.1.4 Meiji Fructooligosaccharide (FOS) Product Model Numbers, Pictures, Descriptions and Specifications
- 11.2 QHT
- 11.2.1 QHT Corporation Information
- 11.2.2 QHT Overview
- 11.2.3 QHT Fructooligosaccharide (FOS) Sales, Price, Revenue and Gross Margin (2017-2022)
- 11.2.4 QHT Fructooligosaccharide (FOS) Product Model Numbers, Pictures, Descriptions and Specifications
- 11.3 Beneo-Orafti
- 11.3.1 Beneo-Orafti Corporation Information
- 11.3.2 Beneo-Orafti Overview
- 11.3.3 Beneo-Orafti Fructooligosaccharide (FOS) Sales, Price, Revenue and Gross Margin (2017-2022)
- 11.3.4 Beneo-Orafti Fructooligosaccharide (FOS) Product Model Numbers, Pictures, Descriptions and Specifications
- 11.4 Baolingbao Biology
- 11.4.1 Baolingbao Biology Corporation Information
- 11.4.2 Baolingbao Biology Overview
- 11.4.3 Baolingbao Biology Fructooligosaccharide (FOS) Sales, Price, Revenue and Gross Margin (2017-2022)
- 11.4.4 Baolingbao Biology Fructooligosaccharide (FOS) Product Model Numbers, Pictures, Descriptions and Specifications
- 11.5 BMI
- 11.5.1 BMI Corporation Information
- 11.5.2 BMI Overview
- 11.5.3 BMI Fructooligosaccharide (FOS) Sales, Price, Revenue and Gross Margin (2017-2022)
- 11.5.4 BMI Fructooligosaccharide (FOS) Product Model Numbers, Pictures, Descriptions and Specifications
- 11.6 Ingredion
- 11.6.1 Ingredion Corporation Information
- 11.6.2 Ingredion Overview
- 11.6.3 Ingredion Fructooligosaccharide (FOS) Sales, Price, Revenue and Gross Margin (2017-2022)
- 11.6.4 Ingredion Fructooligosaccharide (FOS) Product Model Numbers, Pictures, Descriptions and Specifications
- 11.7 Sensus
- 11.7.1 Sensus Corporation Information
- 11.7.2 Sensus Overview
- 11.7.3 Sensus Fructooligosaccharide (FOS) Sales, Price, Revenue and Gross Margin (2017-2022)
- 11.7.4 Sensus Fructooligosaccharide (FOS) Product Model Numbers, Pictures, Descriptions and Specifications
- 11.8 Bailong
- 11.8.1 Bailong Corporation Information
- 11.8.2 Bailong Overview
- 11.8.3 Bailong Fructooligosaccharide (FOS) Sales, Price, Revenue and Gross Margin (2017-2022)
- 11.8.4 Bailong Fructooligosaccharide (FOS) Product Model Numbers, Pictures, Descriptions and Specifications
- 11.9 Cosucra
- 11.9.1 Cosucra Corporation Information
- 11.9.2 Cosucra Overview
- 11.9.3 Cosucra Fructooligosaccharide (FOS) Sales, Price, Revenue and Gross Margin (2017-2022)
- 11.9.4 Cosucra Fructooligosaccharide (FOS) Product Model Numbers, Pictures, Descriptions and Specifications
- 11.9.5 Cosucra Recent Developments
12 INDUSTRY CHAIN AND SALES CHANNELS ANALYSIS
- 12.1 Fructooligosaccharide (FOS) Industry Chain Analysis
- 12.2 Fructooligosaccharide (FOS) Key Raw Materials
- 12.2.1 Key Raw Materials
- 12.2.2 Key Raw Material Chicory Market
- 12.2.3 Key Suppliers of Raw Materials
- 12.3 Proportion of Manufacturing Cost Structure
- 12.4 Manufacturing Process Analysis of Fructooligosaccharide (FOS)
- 12.5 Fructooligosaccharide (FOS) Sales and Marketing
- 12.5.1 Fructooligosaccharide (FOS) Sales Channels
- 12.5.2 Fructooligosaccharide (FOS) Distributors
- 12.6 Fructooligosaccharide (FOS) Customers
13 FRUCTOOLIGOSACCHARIDE (FOS) MARKET DYNAMICS
- 13.1.1 Fructooligosaccharide (FOS) Industry Trends
- 13.1.2 Fructooligosaccharide (FOS) Market Drivers
- 13.1.3 Fructooligosaccharide (FOS) Market Challenges
- 13.1.4 Fructooligosaccharide (FOS) Market Restraints
14 KEY FINDINGS IN THE GLOBAL FRUCTOOLIGOSACCHARIDE (FOS) STUDY
15 APPENDIX
- 15.1 Research Methodology
- 15.1.1 Methodology/Research Approach
- 15.1.2 Data Source
- 15.2 Author Details
- 15.3 Disclaimer