|
|
市場調査レポート
商品コード
1463763
研究用抗体・試薬の世界市場:市場規模・シェア分析 (製品別・種類別・業種別・原料別・形状別・技術別・用途別・エンドユーザー別)、産業需要の予測 (~2030年)Research Antibodies and Reagents Market Size and Share Report by Product, Type, Vertical, Source, Form, Technology, Application, End User - Global Industry Demand Forecast to 2030 |
||||||

|
|||||||
|
|||||||

| 研究用抗体・試薬の世界市場:市場規模・シェア分析 (製品別・種類別・業種別・原料別・形状別・技術別・用途別・エンドユーザー別)、産業需要の予測 (~2030年) |
|
出版日: 2024年04月01日
発行: Prescient & Strategic Intelligence
ページ情報: 英文 330 Pages
納期: 2~3営業日
|

全表示
- 概要
- 目次
主なハイライト
世界の研究用抗体・試薬市場は、2023年に120億米ドル、2030年には187億米ドルの規模に達し、6.7%のCAGRで成長する見通しです。
臨床診断・キャリアスクリーニング・新薬に対するニーズの高まりと遺伝性疾患の急増が、業界の成長を後押ししています。
主な洞察
試薬カテゴリーは、2023年に約60%と最大のシェアを占めており、この10年間はこの傾向が続く見込みです。
一次抗体は2023年に約70%のシェアで業界をリードし、今後もリードし続ける見通しです。
がん領域は2023年時点で約35%と最大のシェアを占め、主要地域でのがん罹患率が増加していることから、この10年間も最大であり続ける見通しです。
北米は、2023年に約55%のシェアで業界をリードしており、バイオテクノロジーと医薬品の研究開発活動が盛んであることから、今後数年間は堅調な伸びを示す見通しです。
アジア太平洋は、この10年間に最も速い速度で推進する見通しです。これは、この地域の国内外の医療・バイオテクノロジー企業からの資金調達が増加しているためです。
当レポートでは、世界の研究用抗体・試薬の市場について分析し、市場の基本構造・最新情勢や主な促進・抑制要因、世界全体および地域別・主要国の市場規模の動向見通し (金額ベース、2017~2030年)、製品別・種類別・業種別・原料別・形状別・技術別・用途別・エンドユーザー別の詳細動向、現在の市場競争の状況、主要企業のプロファイルなどを調査しております。
目次
第1章 調査範囲
第2章 調査手法
第3章 エグゼクティブサマリー
第4章 市場指標
第5章 業界の展望
- 市場力学
- 動向
- 促進要因
- 抑制要因/課題
- 促進要因/抑制要因の影響分析
- 新型コロナウイルス感染症 (COVID-19) の影響
- ポーターのファイブフォース分析
第6章 世界市場
- 概要
- 市場収益:製品別 (2017~2030年)
- 試薬市場の収益:種類別 (2017~2030年)
- 市場収益:種類別 (2017~2030年)
- 市場収益:業種別 (2017~2030年)
- 市場収益:原料別 (2017~2030年)
- 市場収益:形状別 (2017~2030年)
- 市場収益:技術別 (2017~2030年)
- 市場収益:用途別 (2017~2030年)
- 市場収益:エンドユーザー別 (2017~2030年)
- 市場収益:地域別 (2017~2030年)
第7章 北米市場
- 概要
- 市場収益:製品別 (2017~2030年)
- 試薬市場の収益:種類別 (2017~2030年)
- 市場収益:種類別 (2017~2030年)
- 市場収益:業種別 (2017~2030年)
- 市場収益:原料別 (2017~2030年)
- 市場収益:形状別 (2017~2030年)
- 市場収益:技術別 (2017~2030年)
- 市場収益:用途別 (2017~2030年)
- 市場収益:エンドユーザー別 (2017~2030年)
- 市場収益:国別 (2017~2030年)
第8章 欧州市場
第9章 アジア太平洋市場
第10章 ラテンアメリカ市場
第11章 中東・アフリカ市場
第12章 米国市場
- 概要
- 市場収益:製品別 (2017~2030年)
- 試薬市場の収益:種類別 (2017~2030年)
- 市場収益:種類別 (2017~2030年)
- 市場収益:業種別 (2017~2030年)
- 市場収益:原料別 (2017~2030年)
- 市場収益:形状別 (2017~2030年)
- 市場収益:技術別 (2017~2030年)
- 市場収益:用途別 (2017~2030年)
- 市場収益:エンドユーザー別 (2017~2030年)
第13章 カナダ市場
第14章 ドイツ市場
第15章 フランス市場
第16章 英国市場
第17章 イタリア市場
第18章 スペイン市場
第19章 日本市場
第20章 中国市場
第21章 インド市場
第22章 オーストラリア市場
第23章 韓国市場
第24章 ブラジル市場
第25章 メキシコ市場
第26章 サウジアラビア市場
第27章 南アフリカ市場
第28章 アラブ首長国連邦 (UAE) 市場
第29章 競合情勢
- 市場参入企業とその提供製品/サービスの一覧
- 主要企業の競合ベンチマーク
- 主要企業の製品ベンチマーク
- 最近の戦略展開状況
第30章 企業プロファイル
- Thermo Fisher Scientific Inc.
- Merck KGaA
- Abcam plc
- Becton, Dickinson and Company
- F. Hoffmann-La Roche Ltd.
- PerkinElmer Inc.
- Bio-Rad Laboratories Inc.
- Teva Pharmaceutical Industries Limited
- Eli Lilly and Company
- Agilent Technologies Inc.
第31章 付録
Key Highlights
The research antibodies & reagents market generated USD 12.0 billion in 2023, and it will touch USD 18.7 billion, with a 6.7% CAGR, by 2030.
The rising need for clinical diagnostics, carrier screening, and new drugs, along with the surging incidence of genetic disorders is aiding the industry's growth.
The swift technological improvement in pharmaceutical platforms, the substantial application of antibodies & reagents in biotechnology & pharmaceutical analyses, and growing funding and initiatives from private and government bodies for large-scale biotechnology projects resulted in the industry expansion.
The rising research activities to produce new medicines, get them into trials and have them approved boost this industry.
Governments are funding in such activities because of the increasing incidence of chronic and infectious ailments, for discovering effective treatments.
Therefore, life sciences research activities have shattered some records in terms of scientific advancements, funding, and the variety and quantity of new medicines that are accessible to patients across the globe.
The market made some ground-breaking contributions during the pandemic of COVID-19 in the form of vaccines and therapeutics, assisted by the effective application of various research antibodies & reagents.
Key Insights
The reagents category accounted for the largest share of the industry in 2023, of approximately 60%, and it will continue this trend throughout this decade.
The growing application of biotechnology and biosciences in the pharmaceutical and healthcare sectors and the increasing biotechnical and pharmaceutical research for finding more effective, new drugs are driving the reagents category.
Primary antibodies led the industry in 2023, with approximately 70% share, and it will remain leading in the coming years.
The growth in the primary antibodies is because of the extensive variety of utilities offered by these antibodies in the R&D space; and the increasing availability of primary antibodies using goats, mice, rabbits, and various other species as hosts.
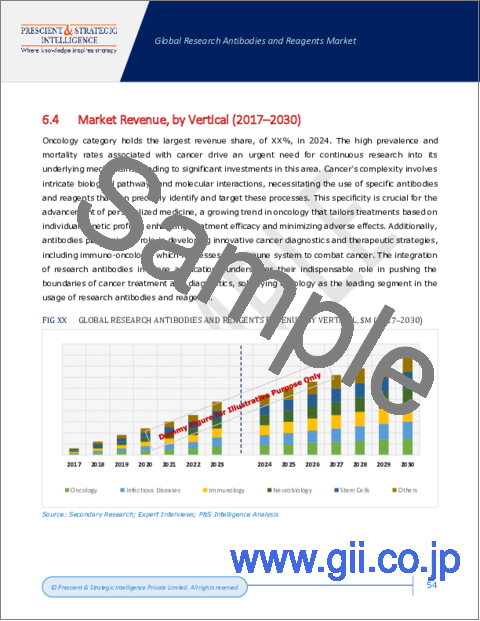
The oncology category was the largest contributor to the industry in 2023, with approximately 35% share, and it will remain the largest during this decade, because of the increasing incidence of cancer in key geographies.
The mice category led the industry because of the smaller size and high reproduction rate of the antibodies & reagents produced using mouse tissue.
The western blotting category is leading the market because of the extensive accessibility and acceptance of this method in healthcare R&D.
Monoclonal antibodies led the industry, due to the rising count of cancer research projects, which require antibodies with high specificity.
Proteomics was the largest contributor in 2023, with approximately 40% share, and it will further propel at a robust rate in the coming years.
The demand for greater effectiveness when mapping drug-protein and protein-protein interactions is boosting the proteomics category.
North America led the industry in 2023, with a share of approximately 55%, and it will advance at a robust rate in the coming years, owing to the substantial biotechnology and pharmaceutical R&D activities.
APAC will propel at the fastest rate during this decade, owing to the increasing funding from both foreign and domestic healthcare and biotechnology firms in this region.
The research antibodies & reagents industry is dynamic and competitive. Competition is powered by technological improvements, the specific demands of different research areas, and product innovation.
Table of Contents
Chapter 1. Research Scope
- 1.1. Research Objectives
- 1.2. Market Definition
- 1.3. Analysis Period
- 1.4. Market Size Breakdown by Segments
- 1.4.1. Market size breakdown, by product
- 1.4.2. Market size breakdown, by type
- 1.4.3. Market size breakdown, by vertical
- 1.4.4. Market size breakdown, by source
- 1.4.5. Market size breakdown, by form
- 1.4.6. Market size breakdown, by technology
- 1.4.7. Market size breakdown, by application
- 1.4.8. Market size breakdown, by end user
- 1.4.9. Market size breakdown, by region
- 1.4.10. Market size breakdown, by country
- 1.5. Market Data Reporting Unit
- 1.5.1. Value
- 1.6. Key Stakeholders
Chapter 2. Research Methodology
- 2.1. Secondary Research
- 2.1.1. Paid
- 2.1.2. Unpaid
- 2.1.3. P&S Intelligence database
- 2.2. Primary Research
- 2.3. Market Size Estimation
- 2.4. Data Triangulation
- 2.5. Currency Conversion Rates
- 2.6. Assumptions for the Study
- 2.7. Notes and Caveats
Chapter 3. Executive Summary
Chapter 4. Market Indicators
Chapter 5. Industry Outlook
- 5.1. Market Dynamics
- 5.1.1. Trends
- 5.1.2. Drivers
- 5.1.3. Restraints/challenges
- 5.1.4. Impact analysis of drivers/restraints
- 5.2. Impact of COVID-19
- 5.3. Porter's Five Forces Analysis
- 5.3.1. Bargaining power of buyers
- 5.3.2. Bargaining power of suppliers
- 5.3.3. Threat of new entrants
- 5.3.4. Intensity of rivalry
- 5.3.5. Threat of substitutes
Chapter 6. Global Market
- 6.1. Overview
- 6.2. Market Revenue, by Product (2017-2030)
- 6.2.1. Reagents market revenue, by type (2017-2030)
- 6.3. Market Revenue, by Type (2017-2030)
- 6.4. Market Revenue, by Vertical (2017-2030)
- 6.5. Market Revenue, by Source (2017-2030)
- 6.6. Market Revenue, by Form (2017-2030)
- 6.7. Market Revenue, by Technology (2017-2030)
- 6.8. Market Revenue, by Application (2017-2030)
- 6.9. Market Revenue, by End User (2017-2030)
- 6.10. Market Revenue, by Region (2017-2030)
Chapter 7. North America Market
- 7.1. Overview
- 7.2. Market Revenue, by Product (2017-2030)
- 7.2.1. Reagents market revenue, by type (2017-2030)
- 7.3. Market Revenue, by Type (2017-2030)
- 7.4. Market Revenue, by Vertical (2017-2030)
- 7.5. Market Revenue, by Source (2017-2030)
- 7.6. Market Revenue, by Form (2017-2030)
- 7.7. Market Revenue, by Technology (2017-2030)
- 7.8. Market Revenue, by Application (2017-2030)
- 7.9. Market Revenue, by End User (2017-2030)
- 7.10. Market Revenue, by Country (2017-2030)
Chapter 8. Europe Market
- 8.1. Overview
- 8.2. Market Revenue, by Product (2017-2030)
- 8.2.1. Reagents market revenue, by type (2017-2030)
- 8.3. Market Revenue, by Type (2017-2030)
- 8.4. Market Revenue, by Vertical (2017-2030)
- 8.5. Market Revenue, by Source (2017-2030)
- 8.6. Market Revenue, by Form (2017-2030)
- 8.7. Market Revenue, by Technology (2017-2030)
- 8.8. Market Revenue, by Application (2017-2030)
- 8.9. Market Revenue, by End User (2017-2030)
- 8.10. Market Revenue, by Country (2017-2030)
Chapter 9. APAC Market
- 9.1. Overview
- 9.2. Market Revenue, by Product (2017-2030)
- 9.2.1. Reagents market revenue, by type (2017-2030)
- 9.3. Market Revenue, by Type (2017-2030)
- 9.4. Market Revenue, by Vertical (2017-2030)
- 9.5. Market Revenue, by Source (2017-2030)
- 9.6. Market Revenue, by Form (2017-2030)
- 9.7. Market Revenue, by Technology (2017-2030)
- 9.8. Market Revenue, by Application (2017-2030)
- 9.9. Market Revenue, by End User (2017-2030)
- 9.10. Market Revenue, by Country (2017-2030)
Chapter 10. LATAM Market
- 10.1. Overview
- 10.2. Market Revenue, by Product (2017-2030)
- 10.2.1. Reagents market revenue, by type (2017-2030)
- 10.3. Market Revenue, by Type (2017-2030)
- 10.4. Market Revenue, by Vertical (2017-2030)
- 10.5. Market Revenue, by Source (2017-2030)
- 10.6. Market Revenue, by Form (2017-2030)
- 10.7. Market Revenue, by Technology (2017-2030)
- 10.8. Market Revenue, by Application (2017-2030)
- 10.9. Market Revenue, by End User (2017-2030)
- 10.10. Market Revenue, by Country (2017-2030)
Chapter 11. MEA Market
- 11.1. Overview
- 11.2. Market Revenue, by Product (2017-2030)
- 11.2.1. Reagents market revenue, by type (2017-2030)
- 11.3. Market Revenue, by Type (2017-2030)
- 11.4. Market Revenue, by Vertical (2017-2030)
- 11.5. Market Revenue, by Source (2017-2030)
- 11.6. Market Revenue, by Form (2017-2030)
- 11.7. Market Revenue, by Technology (2017-2030)
- 11.8. Market Revenue, by Application (2017-2030)
- 11.9. Market Revenue, by End User (2017-2030)
- 11.10. Market Revenue, by Country (2017-2030)
Chapter 12. U.S. Market
- 12.1. Overview
- 12.2. Market Revenue, by Product (2017-2030)
- 12.2.1. Reagents market revenue, by type (2017-2030)
- 12.3. Market Revenue, by Type (2017-2030)
- 12.4. Market Revenue, by Vertical (2017-2030)
- 12.5. Market Revenue, by Source (2017-2030)
- 12.6. Market Revenue, by Form (2017-2030)
- 12.7. Market Revenue, by Technology (2017-2030)
- 12.8. Market Revenue, by Application (2017-2030)
- 12.9. Market Revenue, by End User (2017-2030)
Chapter 13. Canada Market
- 13.1. Overview
- 13.2. Market Revenue, by Product (2017-2030)
- 13.2.1. Reagents market revenue, by type (2017-2030)
- 13.3. Market Revenue, by Type (2017-2030)
- 13.4. Market Revenue, by Vertical (2017-2030)
- 13.5. Market Revenue, by Source (2017-2030)
- 13.6. Market Revenue, by Form (2017-2030)
- 13.7. Market Revenue, by Technology (2017-2030)
- 13.8. Market Revenue, by Application (2017-2030)
- 13.9. Market Revenue, by End User (2017-2030)
Chapter 14. Germany Market
- 14.1. Overview
- 14.2. Market Revenue, by Product (2017-2030)
- 14.2.1. Reagents market revenue, by type (2017-2030)
- 14.3. Market Revenue, by Type (2017-2030)
- 14.4. Market Revenue, by Vertical (2017-2030)
- 14.5. Market Revenue, by Source (2017-2030)
- 14.6. Market Revenue, by Form (2017-2030)
- 14.7. Market Revenue, by Technology (2017-2030)
- 14.8. Market Revenue, by Application (2017-2030)
- 14.9. Market Revenue, by End User (2017-2030)
Chapter 15. France Market
- 15.1. Overview
- 15.2. Market Revenue, by Product (2017-2030)
- 15.2.1. Reagents market revenue, by type (2017-2030)
- 15.3. Market Revenue, by Type (2017-2030)
- 15.4. Market Revenue, by Vertical (2017-2030)
- 15.5. Market Revenue, by Source (2017-2030)
- 15.6. Market Revenue, by Form (2017-2030)
- 15.7. Market Revenue, by Technology (2017-2030)
- 15.8. Market Revenue, by Application (2017-2030)
- 15.9. Market Revenue, by End User (2017-2030)
Chapter 16. U.K. Market
- 16.1. Overview
- 16.2. Market Revenue, by Product (2017-2030)
- 16.2.1. Reagents market revenue, by type (2017-2030)
- 16.3. Market Revenue, by Type (2017-2030)
- 16.4. Market Revenue, by Vertical (2017-2030)
- 16.5. Market Revenue, by Source (2017-2030)
- 16.6. Market Revenue, by Form (2017-2030)
- 16.7. Market Revenue, by Technology (2017-2030)
- 16.8. Market Revenue, by Application (2017-2030)
- 16.9. Market Revenue, by End User (2017-2030)
Chapter 17. Italy Market
- 17.1. Overview
- 17.2. Market Revenue, by Product (2017-2030)
- 17.2.1. Reagents market revenue, by type (2017-2030)
- 17.3. Market Revenue, by Type (2017-2030)
- 17.4. Market Revenue, by Vertical (2017-2030)
- 17.5. Market Revenue, by Source (2017-2030)
- 17.6. Market Revenue, by Form (2017-2030)
- 17.7. Market Revenue, by Technology (2017-2030)
- 17.8. Market Revenue, by Application (2017-2030)
- 17.9. Market Revenue, by End User (2017-2030)
Chapter 18. Spain Market
- 18.1. Overview
- 18.2. Market Revenue, by Product (2017-2030)
- 18.2.1. Reagents market revenue, by type (2017-2030)
- 18.3. Market Revenue, by Type (2017-2030)
- 18.4. Market Revenue, by Vertical (2017-2030)
- 18.5. Market Revenue, by Source (2017-2030)
- 18.6. Market Revenue, by Form (2017-2030)
- 18.7. Market Revenue, by Technology (2017-2030)
- 18.8. Market Revenue, by Application (2017-2030)
- 18.9. Market Revenue, by End User (2017-2030)
Chapter 19. Japan Market
- 19.1. Overview
- 19.2. Market Revenue, by Product (2017-2030)
- 19.2.1. Reagents market revenue, by type (2017-2030)
- 19.3. Market Revenue, by Type (2017-2030)
- 19.4. Market Revenue, by Vertical (2017-2030)
- 19.5. Market Revenue, by Source (2017-2030)
- 19.6. Market Revenue, by Form (2017-2030)
- 19.7. Market Revenue, by Technology (2017-2030)
- 19.8. Market Revenue, by Application (2017-2030)
- 19.9. Market Revenue, by End User (2017-2030)
Chapter 20. China Market
- 20.1. Overview
- 20.2. Market Revenue, by Product (2017-2030)
- 20.2.1. Reagents market revenue, by type (2017-2030)
- 20.3. Market Revenue, by Type (2017-2030)
- 20.4. Market Revenue, by Vertical (2017-2030)
- 20.5. Market Revenue, by Source (2017-2030)
- 20.6. Market Revenue, by Form (2017-2030)
- 20.7. Market Revenue, by Technology (2017-2030)
- 20.8. Market Revenue, by Application (2017-2030)
- 20.9. Market Revenue, by End User (2017-2030)
Chapter 21. India Market
- 21.1. Overview
- 21.2. Market Revenue, by Product (2017-2030)
- 21.2.1. Reagents market revenue, by type (2017-2030)
- 21.3. Market Revenue, by Type (2017-2030)
- 21.4. Market Revenue, by Vertical (2017-2030)
- 21.5. Market Revenue, by Source (2017-2030)
- 21.6. Market Revenue, by Form (2017-2030)
- 21.7. Market Revenue, by Technology (2017-2030)
- 21.8. Market Revenue, by Application (2017-2030)
- 21.9. Market Revenue, by End User (2017-2030)
Chapter 22. Australia Market
- 22.1. Overview
- 22.2. Market Revenue, by Product (2017-2030)
- 22.2.1. Reagents market revenue, by type (2017-2030)
- 22.3. Market Revenue, by Type (2017-2030)
- 22.4. Market Revenue, by Vertical (2017-2030)
- 22.5. Market Revenue, by Source (2017-2030)
- 22.6. Market Revenue, by Form (2017-2030)
- 22.7. Market Revenue, by Technology (2017-2030)
- 22.8. Market Revenue, by Application (2017-2030)
- 22.9. Market Revenue, by End User (2017-2030)
Chapter 23. South Korea Market
- 23.1. Overview
- 23.2. Market Revenue, by Product (2017-2030)
- 23.2.1. Reagents market revenue, by type (2017-2030)
- 23.3. Market Revenue, by Type (2017-2030)
- 23.4. Market Revenue, by Vertical (2017-2030)
- 23.5. Market Revenue, by Source (2017-2030)
- 23.6. Market Revenue, by Form (2017-2030)
- 23.7. Market Revenue, by Technology (2017-2030)
- 23.8. Market Revenue, by Application (2017-2030)
- 23.9. Market Revenue, by End User (2017-2030)
Chapter 24. Brazil Market
- 24.1. Overview
- 24.2. Market Revenue, by Product (2017-2030)
- 24.2.1. Reagents market revenue, by type (2017-2030)
- 24.3. Market Revenue, by Type (2017-2030)
- 24.4. Market Revenue, by Vertical (2017-2030)
- 24.5. Market Revenue, by Source (2017-2030)
- 24.6. Market Revenue, by Form (2017-2030)
- 24.7. Market Revenue, by Technology (2017-2030)
- 24.8. Market Revenue, by Application (2017-2030)
- 24.9. Market Revenue, by End User (2017-2030)
Chapter 25. Mexico Market
- 25.1. Overview
- 25.2. Market Revenue, by Product (2017-2030)
- 25.2.1. Reagents market revenue, by type (2017-2030)
- 25.3. Market Revenue, by Type (2017-2030)
- 25.4. Market Revenue, by Vertical (2017-2030)
- 25.5. Market Revenue, by Source (2017-2030)
- 25.6. Market Revenue, by Form (2017-2030)
- 25.7. Market Revenue, by Technology (2017-2030)
- 25.8. Market Revenue, by Application (2017-2030)
- 25.9. Market Revenue, by End User (2017-2030)
Chapter 26. Saudi Arabia Market
- 26.1. Overview
- 26.2. Market Revenue, by Product (2017-2030)
- 26.2.1. Reagents market revenue, by type (2017-2030)
- 26.3. Market Revenue, by Type (2017-2030)
- 26.4. Market Revenue, by Vertical (2017-2030)
- 26.5. Market Revenue, by Source (2017-2030)
- 26.6. Market Revenue, by Form (2017-2030)
- 26.7. Market Revenue, by Technology (2017-2030)
- 26.8. Market Revenue, by Application (2017-2030)
- 26.9. Market Revenue, by End User (2017-2030)
Chapter 27. South Africa Market
- 27.1. Overview
- 27.2. Market Revenue, by Product (2017-2030)
- 27.2.1. Reagents market revenue, by type (2017-2030)
- 27.3. Market Revenue, by Type (2017-2030)
- 27.4. Market Revenue, by Vertical (2017-2030)
- 27.5. Market Revenue, by Source (2017-2030)
- 27.6. Market Revenue, by Form (2017-2030)
- 27.7. Market Revenue, by Technology (2017-2030)
- 27.8. Market Revenue, by Application (2017-2030)
- 27.9. Market Revenue, by End User (2017-2030)
Chapter 28. U.A.E. Market
- 28.1. Overview
- 28.2. Market Revenue, by Product (2017-2030)
- 28.2.1. Reagents market revenue, by type (2017-2030)
- 28.3. Market Revenue, by Type (2017-2030)
- 28.4. Market Revenue, by Vertical (2017-2030)
- 28.5. Market Revenue, by Source (2017-2030)
- 28.6. Market Revenue, by Form (2017-2030)
- 28.7. Market Revenue, by Technology (2017-2030)
- 28.8. Market Revenue, by Application (2017-2030)
- 28.9. Market Revenue, by End User (2017-2030)
Chapter 29. Competitive Landscape
- 29.1. List of Market Players and their Offerings
- 29.2. Competitive Benchmarking of Key Players
- 29.3. Product Benchmarking of Key Players
- 29.4. Recent Strategic Developments
Chapter 30. Company Profiles
- 30.1. Thermo Fisher Scientific Inc.
- 30.1.1. Business overview
- 30.1.2. Product and service offerings
- 30.1.3. Key financial summary
- 30.2. Merck KGaA
- 30.2.1. Business overview
- 30.2.2. Product and service offerings
- 30.2.3. Key financial summary
- 30.3. Abcam plc
- 30.3.1. Business overview
- 30.3.2. Product and service offerings
- 30.3.3. Key financial summary
- 30.4. Becton, Dickinson and Company
- 30.4.1. Business overview
- 30.4.2. Product and service offerings
- 30.4.3. Key financial summary
- 30.5. F. Hoffmann-La Roche Ltd.
- 30.5.1. Business overview
- 30.5.2. Product and service offerings
- 30.5.3. Key financial summary
- 30.6. PerkinElmer Inc.
- 30.6.1. Business overview
- 30.6.2. Product and service offerings
- 30.6.3. Key financial summary
- 30.7. Bio-Rad Laboratories Inc.
- 30.7.1. Business overview
- 30.7.2. Product and service offerings
- 30.7.3. Key financial summary
- 30.8. Teva Pharmaceutical Industries Limited
- 30.8.1. Business overview
- 30.8.2. Product and service offerings
- 30.8.3. Key financial summary
- 30.9. Eli Lilly and Company
- 30.9.1. Business overview
- 30.9.2. Product and service offerings
- 30.9.3. Key financial summary
- 30.10. Agilent Technologies Inc.
- 30.10.1. Business overview
- 30.10.2. Product and service offerings
- 30.10.3. Key financial summary
Chapter 31. Appendix
- 31.1. Abbreviations
- 31.2. Sources and References
- 31.3. Related Reports
