|
|
市場調査レポート
商品コード
1457959
超電導磁気エネルギー貯蔵 (SMES) の世界市場:市場規模・シェア分析 (種類別 (低温SMES、高温SMES)・用途別 (電力システム、工業用途、研究))、産業需要の予測 (~2030年)Superconducting Magnetic Energy Storage Market Size and Share Analysis by Type (Low-Temperature SMES, High-Temperature SMES), Application (Power System, Industrial Use, Research) - Global Industry Demand Forecast to 2030 |
||||||

|
|||||||
|
|||||||

| 超電導磁気エネルギー貯蔵 (SMES) の世界市場:市場規模・シェア分析 (種類別 (低温SMES、高温SMES)・用途別 (電力システム、工業用途、研究))、産業需要の予測 (~2030年) |
|
出版日: 2024年02月01日
発行: Prescient & Strategic Intelligence
ページ情報: 英文 250 Pages
納期: 2~3営業日
|

全表示
- 概要
- 目次
世界の超電導磁気エネルギー貯蔵 (SMES) の総市場規模は、2023年に572億米ドルであり、10年間の予測期間中に8.4%の割合で成長し、2030年には1,001億米ドルに達すると思われます。業界成長の主な理由は、絶え間ない電力供給への要求の高まり、送電網の近代化への取り組みの高まり、ユーティリティ部門における資金調達の増加です。
電力システムが業界を牽引
SMES業界は電力システムが主導しており、10年間の予測期間中に8.6%の速度で成長する見通しです。
その主な理由は、絶え間なく増加する電力需要に対応するためのグリッドシステムの開発です。
低温SMESシステムの受容拡大
低温SMESは、高温SMESと比較して運用上の安全性が高いため、2024年から2030年にかけて8.5%の割合で成長します。
それとは別に、低温SMESはエネルギー密度が高く、多くの電力を蓄えることができます。また、高効率であるため、少ないエネルギー損失で電力を貯蔵・回収することができます。
地域別市場:北米がリード
北米はSMES市場のリーダーであり、2023年には50%のシェアを占めています。
アジア太平洋:急成長地域
アジア太平洋は、この10年間に8.9%の割合で最も急成長します。これは、再生可能な資源が入手しやすくなっていること、スマートグリッドや分散型ESSが重視されるようになっていること、エネルギー需要が伸びていること、エレクトロニクス部門が繁栄していること、人口が増加していること、中国、インド、韓国、日本の製造能力が高いことなどが理由です。
当レポートでは、世界の超電導磁気エネルギー貯蔵 (SMES) の市場について分析し、市場の基本構造・最新情勢や主な促進・抑制要因、世界全体および地域別・主要国の市場規模の動向見通し (金額ベース、2017~2030年)、種類別・用途別の詳細動向、現在の市場競争の状況、主要企業のプロファイルなどを調査しております。
目次
第1章 調査範囲
第2章 調査手法
第3章 エグゼクティブサマリー
第4章 市場指標
第5章 業界の展望
- 市場力学
- 動向
- 促進要因
- 抑制要因/課題
- 促進要因/抑制要因の影響分析
- 新型コロナウイルス感染症 (COVID-19) の影響
- ポーターのファイブフォース分析
第6章 世界市場
- 概要
- 市場収益:種類別 (2017~2030年)
- 市場収益:用途別 (2017~2030年)
- 市場収益:地域別 (2017~2030年)
第7章 北米市場
- 概要
- 市場収益:種類別 (2017~2030年)
- 市場収益:用途別 (2017~2030年)
- 市場収益:国別 (2017~2030年)
第8章 欧州市場
第9章 アジア太平洋市場
第10章 ラテンアメリカ市場
第11章 中東・アフリカ (MEA) 市場
第12章 米国市場
- 概要
- 市場収益:種類別 (2017~2030年)
- 市場収益:用途別 (2017~2030年)
第13章 カナダ市場
第14章 ドイツ市場
第15章 フランス市場
第16章 英国市場
第17章 イタリア市場
第18章 スペイン市場
第19章 日本市場
第20章 中国市場
第21章 インド市場
第22章 オーストラリア市場
第23章 韓国市場
第24章 ブラジル市場
第25章 メキシコ市場
第26章 サウジアラビア市場
第27章 南アフリカ市場
第28章 アラブ首長国連邦 (UAE) 市場
第29章 競合情勢
- 市場参入企業とその提供製品/サービスの一覧
- 主要企業の競合ベンチマーク
- 主要企業の製品ベンチマーク
- 最近の戦略展開状況
第30章 企業プロファイル
- American Superconductor Corporation
- Fujikura Ltd.
- Nexans S.A.
- Luvata
- ASG Superconductors spa
- Bruker Corporation
- Sumitomo Electric Industries Ltd.
第31章 付録
The superconducting magnetic energy storage market had a total value of USD 57.2 billion in 2023 and it will power at a rate of 8.4% by the end of this decade, reaching USD 100.1billion by 2030. The main reasons for industry growth are the growing requirement for an incessant power supply, mounting efforts for modernization of the grid, and the growing fundings in the utilities sector.
Growth Drivers Drivers
The requirement for an incessant power supply is on the rise all over the world because of the snowballing population and urbanization.
Furthermore, for more than hundred years, electricity has been a basic requirement of economies, industries, and human society. For satisfying the mounting requirement, the role of energy storage is apparent.
Other factors that are responsible for the growth of the industry are the improved performance of these systems as opposed to the primitive technologies, for example rapid response, high efficiency, lengthier life cycle, low maintenance and high-power density.
Industry is Led by Power Systems
The industry is led by power systems, and it will power at a rate of 8.6% by the end of this decade.
The main reason for this is the development of the grid system for meeting the incessantly increasing electricity demand.
SMES systems are employed into significant amenities, for example and data centers and medical centers for offering power anytime, particularly throughout outages and grid emergencies.
The government incentives and policies for promoting the employment of energy storage technologies for improving the stability of the grid, enhance renewable energy use, and fulfill sustainability goals power this category.
Also, with tech progressions, the use of this technology in small- and large-scale power systems will increase in the future.
Growing Acceptance of Low-Temperature SMES Systems
The low-temperature SMES will grow at a rate of 8.5% from 2024 to 2030 due to the higher operational safety of this tech than its high temperature counterpart.
Apart from that, these have a higher energy density, because of which it can store plenty of power. Also, these are highly efficient, allowing the storage and recovery of electricity with small amount of energy loss.
This feature turns out to be significant for applications where energy conservation is important. Furthermore, it has a lengthier lifecycle, helping in decreasing the replacement and upkeep costs over time.
Regional Market is Led by North America
North America is the leader of the SMES market, with a 50% share in 2023, because of the mounting power utility network.
As stated by the U.S Energy Information Administration, the production and consumption of renewable energy reached 13% of the total energy production and consumption in 2022. The increase recently is because of the production of high solar, wind, and hydroelectricity.
APAC is the Fastest-Growing Region
APAC will grow the fastest at a rate of 8.9%, by the end of this decade. This is because of the growing obtainability of resources that are renewable in nature, growing emphasis on smart grids and distributed ESSs, growing demand for energy, prosperous electronics sector, flourishing population, and robust manufacturing competences of China, India, South Korea, and Japan.
China is the leading country in the region. It is undertaking several pilot programs and research initiatives to improve the competence and usefulness of these systems.
Furthermore, the count of cities is rising across APAC region, expanding the development prospects for the industry, as cities make use of more electricity than rural area.
Table of Contents
Chapter 1. Research Scope
- 1.1. Research Objectives
- 1.2. Market Definition
- 1.3. Analysis Period
- 1.4. Market Size Breakdown by Segments
- 1.4.1. Market size breakdown, by type
- 1.4.2. Market size breakdown, by application
- 1.4.3. Market size breakdown, by region
- 1.4.4. Market size breakdown, by country
- 1.5. Market Data Reporting Unit
- 1.5.1. Value
- 1.6. Key Stakeholders
Chapter 2. Research Methodology
- 2.1. Secondary Research
- 2.1.1. Paid
- 2.1.2. Unpaid
- 2.1.3. P&S Intelligence database
- 2.2. Primary Research
- 2.3. Market Size Estimation
- 2.4. Data Triangulation
- 2.5. Currency Conversion Rates
- 2.6. Assumptions for the Study
- 2.7. Notes and Caveats
Chapter 3. Executive Summary
Chapter 4. Market Indicators
Chapter 5. Industry Outlook
- 5.1. Market Dynamics
- 5.1.1. Trends
- 5.1.2. Drivers
- 5.1.3. Restraints/challenges
- 5.1.4. Impact analysis of drivers/restraints
- 5.2. Impact of COVID-19
- 5.3. Porter's Five Forces Analysis
- 5.3.1. Bargaining power of buyers
- 5.3.2. Bargaining power of suppliers
- 5.3.3. Threat of new entrants
- 5.3.4. Intensity of rivalry
- 5.3.5. Threat of substitutes
Chapter 6. Global Market
- 6.1. Overview
- 6.2. Market Revenue, by Type (2017-2030)
- 6.3. Market Revenue, by Application (2017-2030)
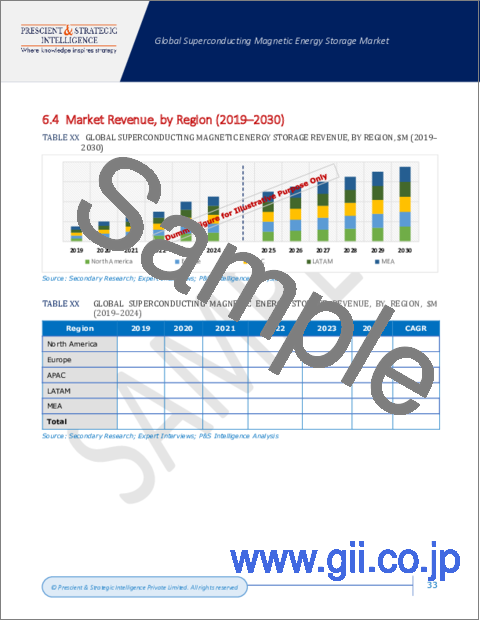
- 6.4. Market Revenue, by Region (2017-2030)
Chapter 7. North America Market
- 7.1. Overview
- 7.2. Market Revenue, by Type (2017-2030)
- 7.3. Market Revenue, by Application (2017-2030)
- 7.4. Market Revenue, by Country (2017-2030)
Chapter 8. Europe Market
- 8.1. Overview
- 8.2. Market Revenue, by Type (2017-2030)
- 8.3. Market Revenue, by Application (2017-2030)
- 8.4. Market Revenue, by Country (2017-2030)
Chapter 9. APAC Market
- 9.1. Overview
- 9.2. Market Revenue, by Type (2017-2030)
- 9.3. Market Revenue, by Application (2017-2030)
- 9.4. Market Revenue, by Country (2017-2030)
Chapter 10. LATAM Market
- 10.1. Overview
- 10.2. Market Revenue, by Type (2017-2030)
- 10.3. Market Revenue, by Application (2017-2030)
- 10.4. Market Revenue, by Country (2017-2030)
Chapter 11. MEA Market
- 11.1. Overview
- 11.2. Market Revenue, by Type (2017-2030)
- 11.3. Market Revenue, by Application (2017-2030)
- 11.4. Market Revenue, by Country (2017-2030)
Chapter 12. U.S. Market
- 12.1. Overview
- 12.2. Market Revenue, by Type (2017-2030)
- 12.3. Market Revenue, by Application (2017-2030)
Chapter 13. Canada Market
- 13.1. Overview
- 13.2. Market Revenue, by Type (2017-2030)
- 13.3. Market Revenue, by Application (2017-2030)
Chapter 14. Germany Market
- 14.1. Overview
- 14.2. Market Revenue, by Type (2017-2030)
- 14.3. Market Revenue, by Application (2017-2030)
Chapter 15. France Market
- 15.1. Overview
- 15.2. Market Revenue, by Type (2017-2030)
- 15.3. Market Revenue, by Application (2017-2030)
Chapter 16. U.K. Market
- 16.1. Overview
- 16.2. Market Revenue, by Type (2017-2030)
- 16.3. Market Revenue, by Application (2017-2030)
Chapter 17. Italy Market
- 17.1. Overview
- 17.2. Market Revenue, by Type (2017-2030)
- 17.3. Market Revenue, by Application (2017-2030)
Chapter 18. Spain Market
- 18.1. Overview
- 18.2. Market Revenue, by Type (2017-2030)
- 18.3. Market Revenue, by Application (2017-2030)
Chapter 19. Japan Market
- 19.1. Overview
- 19.2. Market Revenue, by Type (2017-2030)
- 19.3. Market Revenue, by Application (2017-2030)
Chapter 20. China Market
- 20.1. Overview
- 20.2. Market Revenue, by Type (2017-2030)
- 20.3. Market Revenue, by Application (2017-2030)
Chapter 21. India Market
- 21.1. Overview
- 21.2. Market Revenue, by Type (2017-2030)
- 21.3. Market Revenue, by Application (2017-2030)
Chapter 22. Australia Market
- 22.1. Overview
- 22.2. Market Revenue, by Type (2017-2030)
- 22.3. Market Revenue, by Application (2017-2030)
Chapter 23. South Korea Market
- 23.1. Overview
- 23.2. Market Revenue, by Type (2017-2030)
- 23.3. Market Revenue, by Application (2017-2030)
Chapter 24. Brazil Market
- 24.1. Overview
- 24.2. Market Revenue, by Type (2017-2030)
- 24.3. Market Revenue, by Application (2017-2030)
Chapter 25. Mexico Market
- 25.1. Overview
- 25.2. Market Revenue, by Type (2017-2030)
- 25.3. Market Revenue, by Application (2017-2030)
Chapter 26. Saudi Arabia Market
- 26.1. Overview
- 26.2. Market Revenue, by Type (2017-2030)
- 26.3. Market Revenue, by Application (2017-2030)
Chapter 27. South Africa Market
- 27.1. Overview
- 27.2. Market Revenue, by Type (2017-2030)
- 27.3. Market Revenue, by Application (2017-2030)
Chapter 28. U.A.E. Market
- 28.1. Overview
- 28.2. Market Revenue, by Type (2017-2030)
- 28.3. Market Revenue, by Application (2017-2030)
Chapter 29. Competitive Landscape
- 29.1. List of Market Players and their Offerings
- 29.2. Competitive Benchmarking of Key Players
- 29.3. Product Benchmarking of Key Players
- 29.4. Recent Strategic Developments
Chapter 30. Company Profiles
- 30.1. American Superconductor Corporation
- 30.1.1. Business overview
- 30.1.2. Product and service offerings
- 30.1.3. Key financial summary
- 30.2. Fujikura Ltd.
- 30.2.1. Business overview
- 30.2.2. Product and service offerings
- 30.2.3. Key financial summary
- 30.3. Nexans S.A.
- 30.3.1. Business overview
- 30.3.2. Product and service offerings
- 30.3.3. Key financial summary
- 30.4. Luvata
- 30.4.1. Business overview
- 30.4.2. Product and service offerings
- 30.4.3. Key financial summary
- 30.5. ASG Superconductors spa
- 30.5.1. Business overview
- 30.5.2. Product and service offerings
- 30.5.3. Key financial summary
- 30.6. Bruker Corporation
- 30.6.1. Business overview
- 30.6.2. Product and service offerings
- 30.6.3. Key financial summary
- 30.7. Sumitomo Electric Industries Ltd.
- 30.7.1. Business overview
- 30.7.2. Product and service offerings
- 30.7.3. Key financial summary
Chapter 31. Appendix
- 31.1. Abbreviations
- 31.2. Sources and References
- 31.3. Related Reports

