|
|
市場調査レポート
商品コード
1424959
重力蓄電の世界市場:市場規模・シェア分析 (種類別・用途別・最終用途別)、産業需要予測 (~2030年)Gravity Energy Storage Market Size and Share Analysis by Type, Application, End Use - Global Industry Demand Forecast to 2030 |
||||||
|
|
|||||||
|
|||||||


| 重力蓄電の世界市場:市場規模・シェア分析 (種類別・用途別・最終用途別)、産業需要予測 (~2030年) |
|
出版日: 2023年12月01日
発行: Prescient & Strategic Intelligence
ページ情報: 英文 260 Pages
納期: 2~3営業日
|

全表示
- 概要
- 目次
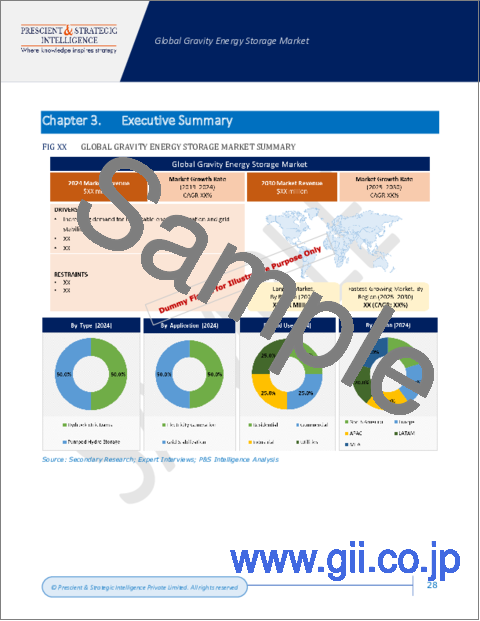
世界の重力蓄電 (重力エネルギー貯蔵) 市場は、2023年末までに2億1,780万米ドル、2030年には122億3,150万米ドルに達し、今後数年間で77.9%の大幅な成長を示すと思われます。この背景には、再生可能エネルギー資源の重視、EVの普及、送電網の安定性、電気料金の高騰などがあります。
揚水発電 (PHS) は、2029年末までに77.7%の成長を遂げると思われます。この方法は、大量の電力を効率的に貯蔵・放出する能力があるため、支持されています。
IHAによれば、PHSは世界全体のエネルギー貯蔵容量の94%を占めており、これらのポンプは9,000GWhの電力を貯蔵しています。この技術は、エネルギー供給と需要のバランスを確実に保ち、送電網の安定性を保証します。
用途別では、発電が業界をリードしており、これはPHSシステムが発電用に広く使用されているためです。これは、PHSが高いエネルギー貯蔵能力を持ち、電力需要が高いときや、他のエネルギー源から十分なエネルギーが得られないときに電力を生産する能力があるためです。
これらのシステムは、電力需要が増加したときに迅速な対応を提供することで、電力網のバランスをとるのに極めて効果的です。これは、重要なエネルギー貯蔵と発電のための、実績があり、十分に認知された技術です。それゆえ、その能力、信頼性、長い運用の歴史により、発電のための一般的な選択肢となっています。
北米が重力蓄電市場のリーダーであり、欧州とアジア太平洋がそれに続いています。その理由は、重力蓄電プロジェクトが少なからず始まっていること、技術準備が整っていること、要求が高いこと、政策が支持されていることです。さらに、EVの数が急増し、再生可能エネルギー源の投資回収に対する意識が高まっているため、これらの方法の受け入れが増加しています。
アジア太平洋地域は、特に日本、インド、中国において再生可能エネルギー産業が急速に成長した結果、2029末までに80.4%という最速の速度で成長すると思われます。これは、これらの国々が風力や太陽光などの再生可能エネルギー源にかなり投資してきたことと大いに関係があります。信頼できる電力供給を保証し、発電の不一致に対処するために、これらの断続的なエネルギー源を蓄電ソリューションと組み合わせることで、確固たる市場ポテンシャルが形成されています。
世界中で電気自動車の導入が増加しているため、重力蓄電ソリューションの需要が増加しています。この動向は今後も続くと思われます。
当レポートでは、世界の重力蓄電の市場について分析し、市場の基本構造・最新情勢や主な促進・抑制要因、世界全体および地域別・主要国の市場規模の動向見通し (金額ベース、2017~2030年)、種類別・用途別・最終用途別の詳細動向、現在の市場競争の状況、主要企業のプロファイルなどを調査しております。
目次
第1章 調査範囲
第2章 調査手法
第3章 エグゼクティブサマリー
第4章 市場指標
第5章 業界の展望
- 市場力学
- 動向
- 促進要因
- 抑制要因/課題
- 促進要因/抑制要因の影響分析
- 新型コロナウイルス感染症 (COVID-19) の影響
- ポーターのファイブフォース分析
第6章 世界市場
- 概要
- 市場収益:種類別 (2017~2030年)
- 市場収益:用途別 (2017~2030年)
- 市場収益:最終用途別 (2017~2030年)
- 市場収益:地域別 (2017~2030年)
第7章 北米市場
- 概要
- 市場収益:種類別 (2017~2030年)
- 市場収益:用途別 (2017~2030年)
- 市場収益:最終用途別 (2017~2030年)
- 市場収益:国別 (2017~2030年)
第8章 欧州市場
第9章 アジア太平洋市場
第10章 中南米市場
第11章 中東・アフリカ (MEA) 市場
第12章 米国市場
- 概要
- 市場収益:種類別 (2017~2030年)
- 市場収益:用途別 (2017~2030年)
- 市場収益:最終用途別 (2017~2030年)
第13章 カナダ市場
第14章 ドイツ市場
第15章 フランス市場
第16章 英国市場
第17章 イタリア市場
第18章 スペイン市場
第19章 日本市場
第20章 中国市場
第21章 インド市場
第22章 オーストラリア市場
第23章 韓国市場
第24章 ブラジル市場
第25章 メキシコ市場
第26章 サウジアラビア市場
第27章 南アフリカ市場
第28章 アラブ首長国連邦 (UAE) 市場
第29章 競合情勢
- 市場参入企業とその提供製品/サービスの一覧
- 主要企業の競合ベンチマーク
- 主要企業の製品ベンチマーク
- 最近の戦略展開状況
第30章 企業プロファイル
- Energy Vault Inc.
- Gravitricity
- ENERGYNEST AS
- Advanced Rail Energy Storage (ARES)
- Gravity Power LLC
- Highview Power
- Antora Energy
第31章 付録
The gravity energy storage market will generate USD 217.8 million by the end of 2023, which will power at a considerable rate of 77.9% in the years to come, touching USD 12,231.5 million by 2030. This will be because of the robust emphasis on renewable energy resources, acceptance of EVs require grid stability, and surge in the electricity cost.
The pumped hydro storage category will grow at a rate of 77.7% by the end of this decade. This method is favored attributable to its competence to store and release a huge quantity of power efficiently.
As per the IHA, PHS has 94% of the installed worldwide energy storage capacity and these pumps store equal to 9,000 GWh of electricity. This tech dependably balances the supply of energy and demand and guarantees the grid stability.
In the application segment, electricity generation led the industry, since PHS systems are extensively put to use for generating electricity. This is itself because of their high energy stowage competences and capacity to produce electricity when there is high requirement or sufficient energy is not obtainable from further sources.
These systems are extremely effective at balancing the electricity grid by offering fast responses when there is an increase in the demand for power. It is a proven and well-recognized tech for significant energy stowage and electricity generation. Hence, its competence, dependability, and lengthy operational history have made it a prevalent choice for the generation.
North America is the leader of the gravity energy storage market, followed by Europe and APAC, because of the beginning of more than a few gravity energy storage projects, tech readiness, high requirement, and supportive policies. Moreover, the acceptance of these methods is increasing because of a surge in the count of EVs and rise in the consciousness of the paybacks of renewable sources of energy.
The APAC region will grow at the fastest rate of 80.4%, by the end of this decade as a result of a speedily mounting renewable energy industry, particularly in Japan, India, and China. This has a lot to do with the fact that these nations have been considerably investing in renewable energy sources, for example wind and solar. A robust market potential has been formed by the incorporation of these intermittent sources of energy with storage solutions to guarantee a dependable power supply and deal with the inconsistency in generation of power.
It is because of the rise in adoption of electric vehicles al over the world, the demand for gravity energy storage solutions is on the rise. This trend will continue in the years to come as well.
Top Providers of Gravity Energy Storage Solutions Are:
Energy Vault Inc.
Gravitricity
ENERGYNEST AS
Advanced Rail Energy Storage (ARES)
Gravity Power LLC
Highview Power
Antora Energy
Table of Contents
Chapter 1. Research Scope
- 1.1. Research Objectives
- 1.2. Market Definition
- 1.3. Analysis Period
- 1.4. Market Size Breakdown by Segments
- 1.4.1. Market size breakdown, by type
- 1.4.2. Market size breakdown, by application
- 1.4.3. Market size breakdown, by end use
- 1.4.4. Market size breakdown, by region
- 1.4.5. Market size breakdown, by country
- 1.5. Market Data Reporting Unit
- 1.5.1. Value
- 1.6. Key Stakeholders
Chapter 2. Research Methodology
- 2.1. Secondary Research
- 2.1.1. Paid
- 2.1.2. Unpaid
- 2.1.3. P&S Intelligence database
- 2.2. Primary Research
- 2.3. Market Size Estimation
- 2.4. Data Triangulation
- 2.5. Currency Conversion Rates
- 2.6. Assumptions for the Study
- 2.7. Notes and Caveats
Chapter 3. Executive Summary
Chapter 4. Market Indicators
Chapter 5. Industry Outlook
- 5.1. Market Dynamics
- 5.1.1. Trends
- 5.1.2. Drivers
- 5.1.3. Restraints/challenges
- 5.1.4. Impact analysis of drivers/restraints
- 5.2. Impact of COVID-19
- 5.3. Porter's Five Forces Analysis
- 5.3.1. Bargaining power of buyers
- 5.3.2. Bargaining power of suppliers
- 5.3.3. Threat of new entrants
- 5.3.4. Intensity of rivalry
- 5.3.5. Threat of substitutes
Chapter 6. Global Market
- 6.1. Overview
- 6.2. Market Revenue, by Type (2017-2030)
- 6.3. Market Revenue, by Application (2017-2030)
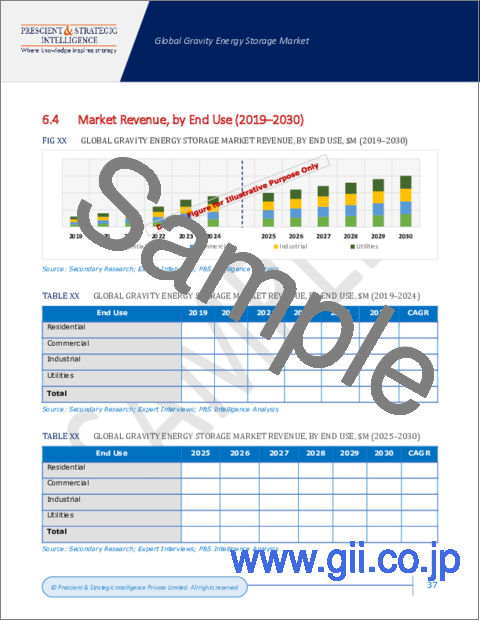
- 6.4. Market Revenue, by End Use (2017-2030)
- 6.5. Market Revenue, by Region (2017-2030)
Chapter 7. North America Market
- 7.1. Overview
- 7.2. Market Revenue, by Type (2017-2030)
- 7.3. Market Revenue, by Application (2017-2030)
- 7.4. Market Revenue, by End Use (2017-2030)
- 7.5. Market Revenue, by Country (2017-2030)
Chapter 8. Europe Market
- 8.1. Overview
- 8.2. Market Revenue, by Type (2017-2030)
- 8.3. Market Revenue, by Application (2017-2030)
- 8.4. Market Revenue, by End Use (2017-2030)
- 8.5. Market Revenue, by Country (2017-2030)
Chapter 9. APAC Market
- 9.1. Overview
- 9.2. Market Revenue, by Type (2017-2030)
- 9.3. Market Revenue, by Application (2017-2030)
- 9.4. Market Revenue, by End Use (2017-2030)
- 9.5. Market Revenue, by Country (2017-2030)
Chapter 10. LATAM Market
- 10.1. Overview
- 10.2. Market Revenue, by Type (2017-2030)
- 10.3. Market Revenue, by Application (2017-2030)
- 10.4. Market Revenue, by End Use (2017-2030)
- 10.5. Market Revenue, by Country (2017-2030)
Chapter 11. MEA Market
- 11.1. Overview
- 11.2. Market Revenue, by Type (2017-2030)
- 11.3. Market Revenue, by Application (2017-2030)
- 11.4. Market Revenue, by End Use (2017-2030)
- 11.5. Market Revenue, by Country (2017-2030)
Chapter 12. U.S. Market
- 12.1. Overview
- 12.2. Market Revenue, by Type (2017-2030)
- 12.3. Market Revenue, by Application (2017-2030)
- 12.4. Market Revenue, by End Use (2017-2030)
Chapter 13. Canada Market
- 13.1. Overview
- 13.2. Market Revenue, by Type (2017-2030)
- 13.3. Market Revenue, by Application (2017-2030)
- 13.4. Market Revenue, by End Use (2017-2030)
Chapter 14. Germany Market
- 14.1. Overview
- 14.2. Market Revenue, by Type (2017-2030)
- 14.3. Market Revenue, by Application (2017-2030)
- 14.4. Market Revenue, by End Use (2017-2030)
Chapter 15. France Market
- 15.1. Overview
- 15.2. Market Revenue, by Type (2017-2030)
- 15.3. Market Revenue, by Application (2017-2030)
- 15.4. Market Revenue, by End Use (2017-2030)
Chapter 16. U.K. Market
- 16.1. Overview
- 16.2. Market Revenue, by Type (2017-2030)
- 16.3. Market Revenue, by Application (2017-2030)
- 16.4. Market Revenue, by End Use (2017-2030)
Chapter 17. Italy Market
- 17.1. Overview
- 17.2. Market Revenue, by Type (2017-2030)
- 17.3. Market Revenue, by Application (2017-2030)
- 17.4. Market Revenue, by End Use (2017-2030)
Chapter 18. Spain Market
- 18.1. Overview
- 18.2. Market Revenue, by Type (2017-2030)
- 18.3. Market Revenue, by Application (2017-2030)
- 18.4. Market Revenue, by End Use (2017-2030)
Chapter 19. Japan Market
- 19.1. Overview
- 19.2. Market Revenue, by Type (2017-2030)
- 19.3. Market Revenue, by Application (2017-2030)
- 19.4. Market Revenue, by End Use (2017-2030)
Chapter 20. China Market
- 20.1. Overview
- 20.2. Market Revenue, by Type (2017-2030)
- 20.3. Market Revenue, by Application (2017-2030)
- 20.4. Market Revenue, by End Use (2017-2030)
Chapter 21. India Market
- 21.1. Overview
- 21.2. Market Revenue, by Type (2017-2030)
- 21.3. Market Revenue, by Application (2017-2030)
- 21.4. Market Revenue, by End Use (2017-2030)
Chapter 22. Australia Market
- 22.1. Overview
- 22.2. Market Revenue, by Type (2017-2030)
- 22.3. Market Revenue, by Application (2017-2030)
- 22.4. Market Revenue, by End Use (2017-2030)
Chapter 23. South Korea Market
- 23.1. Overview
- 23.2. Market Revenue, by Type (2017-2030)
- 23.3. Market Revenue, by Application (2017-2030)
- 23.4. Market Revenue, by End Use (2017-2030)
Chapter 24. Brazil Market
- 24.1. Overview
- 24.2. Market Revenue, by Type (2017-2030)
- 24.3. Market Revenue, by Application (2017-2030)
- 24.4. Market Revenue, by End Use (2017-2030)
Chapter 25. Mexico Market
- 25.1. Overview
- 25.2. Market Revenue, by Type (2017-2030)
- 25.3. Market Revenue, by Application (2017-2030)
- 25.4. Market Revenue, by End Use (2017-2030)
Chapter 26. Saudi Arabia Market
- 26.1. Overview
- 26.2. Market Revenue, by Type (2017-2030)
- 26.3. Market Revenue, by Application (2017-2030)
- 26.4. Market Revenue, by End Use (2017-2030)
Chapter 27. South Africa Market
- 27.1. Overview
- 27.2. Market Revenue, by Type (2017-2030)
- 27.3. Market Revenue, by Application (2017-2030)
- 27.4. Market Revenue, by End Use (2017-2030)
Chapter 28. U.A.E. Market
- 28.1. Overview
- 28.2. Market Revenue, by Type (2017-2030)
- 28.3. Market Revenue, by Application (2017-2030)
- 28.4. Market Revenue, by End Use (2017-2030)
Chapter 29. Competitive Landscape
- 29.1. List of Market Players and their Offerings
- 29.2. Competitive Benchmarking of Key Players
- 29.3. Product Benchmarking of Key Players
- 29.4. Recent Strategic Developments
Chapter 30. Company Profiles
- 30.1. Energy Vault Inc.
- 30.1.1. Business overview
- 30.1.2. Product and service offerings
- 30.1.3. Key financial summary
- 30.2. Gravitricity
- 30.2.1. Business overview
- 30.2.2. Product and service offerings
- 30.2.3. Key financial summary
- 30.3. ENERGYNEST AS
- 30.3.1. Business overview
- 30.3.2. Product and service offerings
- 30.3.3. Key financial summary
- 30.4. Advanced Rail Energy Storage (ARES)
- 30.4.1. Business overview
- 30.4.2. Product and service offerings
- 30.4.3. Key financial summary
- 30.5. Gravity Power LLC
- 30.5.1. Business overview
- 30.5.2. Product and service offerings
- 30.5.3. Key financial summary
- 30.6. Highview Power
- 30.6.1. Business overview
- 30.6.2. Product and service offerings
- 30.6.3. Key financial summary
- 30.7. Antora Energy
- 30.7.1. Business overview
- 30.7.2. Product and service offerings
- 30.7.3. Key financial summary
Chapter 31. Appendix
- 31.1. Abbreviations
- 31.2. Sources and References
- 31.3. Related Reports

