|
|
市場調査レポート
商品コード
1421765
浮体式発電所市場、シェア、規模、動向、産業分析レポート:電源別、定格電力別、プラットフォームタイプ別、地域別、セグメント別予測、2024年~2032年Floating Power Plants Market Share, Size, Trends, Industry Analysis Report, By Power Source (Non-renewable and Renewable); By Power Rating; By Platform Type; By Region; Segment Forecast, 2024 - 2032 |
||||||
|
|
|||||||
カスタマイズ可能
|
|||||||


| 浮体式発電所市場、シェア、規模、動向、産業分析レポート:電源別、定格電力別、プラットフォームタイプ別、地域別、セグメント別予測、2024年~2032年 |
|
出版日: 2023年12月23日
発行: Polaris Market Research
ページ情報: 英文 114 Pages
納期: 即日から翌営業日
|

- 全表示
- 概要
- 図表
- 目次
Polaris Market Researchの最新調査によると、世界の浮体式発電所市場規模は2032年までに240億米ドルに達する見込みです。この調査レポートは、現在の市場力学を詳細に洞察し、将来の市場成長に関する分析を提供しています。
特に非電化地域や遠隔地における世界のエネルギー需要の増加と、環境負荷の低減や炭素排出量の削減など、浮体式太陽光発電所や風力発電所に関連するいくつかの環境上の利点が、市場成長に影響を与える主な要因となっています。さらに、デジタル技術やリアルタイム監視、データ駆動型最適化、予知保全を可能にするその他の先進技術の導入が進んでいること、新しい浮体式太陽光発電所プロジェクトの開拓に向けた投資が増加していることも、近い将来の市場成長に良い影響を与えると思われます。
例えば、2022年8月、インド再生可能エネルギー局は、マディヤ・プラデシュ州に浮体式太陽光発電所を建設すると発表しました。これは世界最大の浮体式太陽光発電所になる可能性が高く、2022~23年までに600MWの発電が見込まれています。
二面太陽電池パネル、浮体式太陽光発電システム、反射防止コーティングなど、太陽電池パネルの設計や材料における技術革新の高まりは、浮体式太陽光発電所の効率向上やコスト削減につながっており、政府機関や民間団体による浮体式太陽光発電所の世界の開拓が進むにつれて、FPPの市場は急激に拡大しています。
例えば、2023年6月、EDFグループは、フランスで最初の施設であり、太陽光発電と水力発電を1つのサイトで組み合わせた最初の施設でもある、新しいLazer浮体式太陽光発電所の立ち上げを発表しました。
さらに、浮体式発電所の組み立て、輸送、配備を容易にし、さまざまな水域への適応性を高め、さまざまなエネルギー需要への拡張性を可能にする、浮体式発電所作成のためのモジュラー建設手法の採用が増加していることは、今後数年間、市場にプラスの影響を与える可能性が高いです。
浮体式発電所市場レポートハイライト
非再生可能分野が最大の市場シェアを占め、その主な理由は運転コストの低さ、信頼性の高さ、出力密度の高さです。
ハイパワーセグメントは、大規模な電力を必要とするプロジェクトや用途に大きく採用されていることから、かなりのシェアを占めて市場をリードしています。
パワーバージ・セグメントが最も高いペースで成長すると予想されるが、これは配備の容易さや高い柔軟性など、数々の有利な特性によって加速されます。
アジア太平洋は、様々なセクターからのエネルギー需要の増加と再生可能エネルギー源の普及により、世界市場を独占しています。
目次
第1章 イントロダクション
第2章 エグゼクティブサマリー
第3章 調査手法
第4章 世界の浮体式発電所市場に関する洞察
- 浮体式発電所市場- プラットフォームタイプのスナップショット
- 浮体式発電所の市場力学
- 促進要因と機会
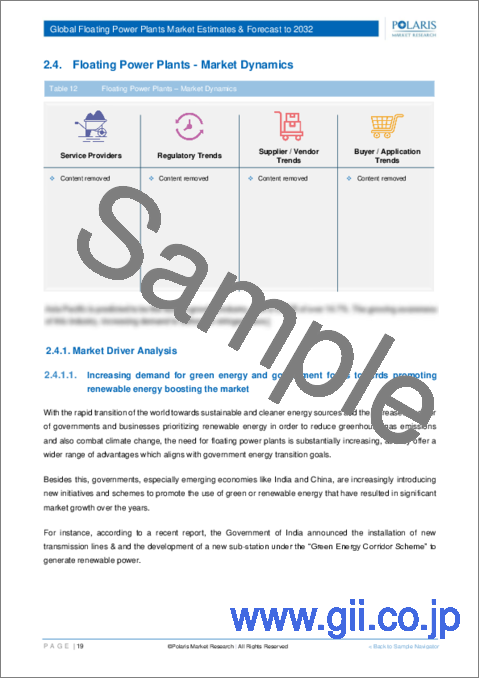
- グリーンエネルギーの需要の増加と政府の再生可能エネルギー促進への注力が市場を後押し
- 企業は遮熱コーティングやセラミックなどの材料の使用を増やしています。
- 抑制要因と課題
- 浮体式発電所の設計、建設、設置には多額の先行資金が必要であり、非常に複雑です。
- 促進要因と機会
- PESTEL分析
- 浮体式発電所市場プラットフォームの種類の動向
- バリューチェーン分析
- COVID-19感染症の影響分析
第5章 世界の浮体式発電所市場、電源別
- 主な調査結果
- イントロダクション
- 再生不可能
- 再生可能
第6章 世界の浮体式発電所市場、定格電力別
- 主な調査結果
- イントロダクション
- 高電力
- 中電力
- 低電力
第7章 世界の浮体式発電所市場、プラットフォームタイプ別
- 主な調査結果
- イントロダクション
- 浮体構造物
- パワーバージ
- 動力船
第8章 世界の浮体式発電所市場、地域別
- 主な調査結果
- イントロダクション
- 浮体式発電所市場評価、地域別、2019-2032年
- 浮体式発電所市場-北米
- 北米:浮体式発電所市場、電源別、2019-2032年
- 北米:浮体式発電所市場、プラットフォームタイプ別、2019-2032年
- 北米:浮体式発電所市場、定格電力別、2019-2032年
- 浮体式発電所市場-米国
- 浮体式発電所市場- カナダ
- 浮体式発電所市場- 欧州
- 欧州:浮体式発電所市場、電源別、2019-2032年
- 欧州:浮体式発電所市場、プラットフォームタイプ別、2019-2032
- 欧州:浮体式発電所市場、定格電力別、2019~2032年
- 浮体式発電所市場- 英国
- 浮体式発電所市場- フランス
- 浮体式発電所市場- ドイツ
- 浮体式発電所市場- イタリア
- 浮体式発電所市場- スペイン
- 浮体式発電所市場- オランダ
- 浮体式発電所市場- ロシア
- 浮体式発電所市場- アジア太平洋
- アジア太平洋:浮体式発電所市場、電源別、2019~2032年
- アジア太平洋:浮体式発電所市場、プラットフォームタイプ別、2019~2032年
- アジア太平洋:浮体式発電所市場、定格電力別、2019~2032年
- 浮体式発電所市場- 中国
- 浮体式発電所市場- インド
- 浮体式発電所市場- マレーシア
- 浮体式発電所市場- 日本
- 浮体式発電所市場- インドネシア
- 浮体式発電所市場- 韓国
- 浮体式発電所市場-中東およびアフリカ
- 中東およびアフリカ:浮体式発電所市場、電源別、2019-2032年
- 中東およびアフリカ:浮体式発電所市場、プラットフォームタイプ別、2019~2032年
- 中東およびアフリカ:浮体式発電所市場、定格電力別、2019~2032年
- 浮体式発電所市場- サウジアラビア
- 浮体式発電所市場- アラブ首長国連邦
- 浮体式発電所市場- イスラエル
- 浮体式発電所市場- 南アフリカ
- 浮体式発電所市場-ラテンアメリカ
- ラテンアメリカ:浮体式発電所市場、電源別、2019-2032年
- ラテンアメリカ:浮体式発電所市場、プラットフォームタイプ別、2019-2032年
- ラテンアメリカ:浮体式発電所市場、定格電力別、2019-2032年
- 浮体式発電所市場- メキシコ
- 浮体式発電所市場- ブラジル
- 浮体式発電所市場- アルゼンチン
第9章 競合情勢
- 拡張と買収の分析
- 拡大
- 買収
- 提携/協業/合意/公開
第10章 企業プロファイル
- Caterpillar Inc.
- Ciel & Terre International
- Flack Renewable SpA
- Floating Power Plant A/S
- General Electric Company
- Kyocera Corporation
- MAN Diesel & Turbo SE
- Mitsubishi Corporation
- Principle Power Inc
- SeaTwirl AB
- Siemens AG
- Upsolar
- Vikram Solar
- Wartsila
- Yingli Solar
List of Tables
- Table 1 Global Floating Power Plants Market, by Power Source, 2019-2032 (USD Billion)
- Table 2 Global Floating Power Plants Market, by Power Rating, 2019-2032 (USD Billion)
- Table 3 Global Floating Power Plants Market, by Platform Type, 2019-2032 (USD Billion)
- Table 4 Floating Power Plants Market Assessment, By Geography, 2019-2032 (USD Billion)
- Table 5 North America: Floating Power Plants Market, by Power Source, 2019-2032 (USD Billion)
- Table 6 North America: Floating Power Plants Market, by Power Rating, 2019-2032 (USD Billion)
- Table 7 North America: Floating Power Plants Market, by Platform Type, 2019-2032 (USD Billion)
- Table 8 U.S.: Floating Power Plants Market, by Power Source, 2019-2032 (USD Billion)
- Table 9 U.S.: Floating Power Plants Market, by Power Rating, 2019-2032 (USD Billion)
- Table 10 U.S.: Floating Power Plants Market, by Platform Type, 2019-2032 (USD Billion)
- Table 11 Canada: Floating Power Plants Market, by Power Source, 2019-2032 (USD Billion)
- Table 12 Canada: Floating Power Plants Market, by Power Rating, 2019-2032 (USD Billion)
- Table 13 Canada: Floating Power Plants Market, by Platform Type, 2019-2032 (USD Billion)
- Table 14 Europe: Floating Power Plants Market, by Power Source, 2019-2032 (USD Billion)
- Table 15 Europe: Floating Power Plants Market, by Power Rating, 2019-2032 (USD Billion)
- Table 16 Europe: Floating Power Plants Market, by Platform Type, 2019-2032 (USD Billion)
- Table 17 UK: Floating Power Plants Market, by Power Source, 2019-2032 (USD Billion)
- Table 18 UK: Floating Power Plants Market, by Power Rating, 2019-2032 (USD Billion)
- Table 19 UK: Floating Power Plants Market, by Platform Type, 2019-2032 (USD Billion)
- Table 20 France: Floating Power Plants Market, by Power Source, 2019-2032 (USD Billion)
- Table 21 France: Floating Power Plants Market, by Power Rating, 2019-2032 (USD Billion)
- Table 22 France: Floating Power Plants Market, by Platform Type, 2019-2032 (USD Billion)
- Table 23 Germany: Floating Power Plants Market, by Power Source, 2019-2032 (USD Billion)
- Table 24 Germany: Floating Power Plants Market, by Power Rating, 2019-2032 (USD Billion)
- Table 25 Germany: Floating Power Plants Market, by Platform Type, 2019-2032 (USD Billion)
- Table 26 Italy: Floating Power Plants Market, by Power Source, 2019-2032 (USD Billion)
- Table 27 Italy: Floating Power Plants Market, by Power Rating, 2019-2032 (USD Billion)
- Table 28 Italy: Floating Power Plants Market, by Platform Type, 2019-2032 (USD Billion)
- Table 29 Spain: Floating Power Plants Market, by Power Source, 2019-2032 (USD Billion)
- Table 30 Spain: Floating Power Plants Market, by Power Rating, 2019-2032 (USD Billion)
- Table 31 Spain: Floating Power Plants Market, by Platform Type, 2019-2032 (USD Billion)
- Table 32 Netherlands: Floating Power Plants Market, by Power Source, 2019-2032 (USD Billion)
- Table 33 Netherlands: Floating Power Plants Market, by Power Rating, 2019-2032 (USD Billion)
- Table 34 Netherlands: Floating Power Plants Market, by Platform Type, 2019-2032 (USD Billion)
- Table 35 Russia: Floating Power Plants Market, by Power Source, 2019-2032 (USD Billion)
- Table 36 Russia: Floating Power Plants Market, by Power Rating, 2019-2032 (USD Billion)
- Table 37 Russia: Floating Power Plants Market, by Platform Type, 2019-2032 (USD Billion)
- Table 38 Asia Pacific: Floating Power Plants Market, by Power Source, 2019-2032 (USD Billion)
- Table 39 Asia Pacific: Floating Power Plants Market, by Power Rating, 2019-2032 (USD Billion)
- Table 40 Asia Pacific: Floating Power Plants Market, by Platform Type, 2019-2032 (USD Billion)
- Table 41 China: Floating Power Plants Market, by Power Source, 2019-2032 (USD Billion)
- Table 42 China: Floating Power Plants Market, by Power Rating, 2019-2032 (USD Billion)
- Table 43 China: Floating Power Plants Market, by Platform Type, 2019-2032 (USD Billion)
- Table 44 India: Floating Power Plants Market, by Power Source, 2019-2032 (USD Billion)
- Table 45 India: Floating Power Plants Market, by Power Rating, 2019-2032 (USD Billion)
- Table 46 India: Floating Power Plants Market, by Platform Type, 2019-2032 (USD Billion)
- Table 47 Malaysia: Floating Power Plants Market, by Power Source, 2019-2032 (USD Billion)
- Table 48 Malaysia: Floating Power Plants Market, by Power Rating, 2019-2032 (USD Billion)
- Table 49 Malaysia: Floating Power Plants Market, by Platform Type, 2019-2032 (USD Billion)
- Table 50 Japan: Floating Power Plants Market, by Power Source, 2019-2032 (USD Billion)
- Table 51 Japan: Floating Power Plants Market, by Power Rating, 2019-2032 (USD Billion)
- Table 52 Japan: Floating Power Plants Market, by Platform Type, 2019-2032 (USD Billion)
- Table 53 Indonesia: Floating Power Plants Market, by Power Source, 2019-2032 (USD Billion)
- Table 54 Indonesia: Floating Power Plants Market, by Power Rating, 2019-2032 (USD Billion)
- Table 55 Indonesia: Floating Power Plants Market, by Platform Type, 2019-2032 (USD Billion)
- Table 56 South Korea: Floating Power Plants Market, by Power Source, 2019-2032 (USD Billion)
- Table 57 South Korea: Floating Power Plants Market, by Power Rating, 2019-2032 (USD Billion)
- Table 58 South Korea: Floating Power Plants Market, by Platform Type, 2019-2032 (USD Billion)
- Table 59 Middle East & Africa: Floating Power Plants Market, by Power Source, 2019-2032 (USD Billion)
- Table 60 Middle East & Africa: Floating Power Plants Market, by Power Rating, 2019-2032 (USD Billion)
- Table 61 Middle East & Africa: Floating Power Plants Market, by Platform Type, 2019-2032 (USD Billion)
- Table 62 Saudi Arabia: Floating Power Plants Market, by Power Source, 2019-2032 (USD Billion)
- Table 63 Saudi Arabia: Floating Power Plants Market, by Power Rating, 2019-2032 (USD Billion)
- Table 64 Saudi Arabia: Floating Power Plants Market, by Platform Type, 2019-2032 (USD Billion)
- Table 65 UAE: Floating Power Plants Market, by Power Source, 2019-2032 (USD Billion)
- Table 66 UAE: Floating Power Plants Market, by Power Rating, 2019-2032 (USD Billion)
- Table 67 UAE: Floating Power Plants Market, by Platform Type, 2019-2032 (USD Billion)
- Table 68 Israel: Floating Power Plants Market, by Power Source, 2019-2032 (USD Billion)
- Table 69 Israel: Floating Power Plants Market, by Power Rating, 2019-2032 (USD Billion)
- Table 70 Israel: Floating Power Plants Market, by Platform Type, 2019-2032 (USD Billion)
- Table 71 South Africa: Floating Power Plants Market, by Power Source, 2019-2032 (USD Billion)
- Table 72 South Africa: Floating Power Plants Market, by Power Rating, 2019-2032 (USD Billion)
- Table 73 South Africa: Floating Power Plants Market, by Platform Type, 2019-2032 (USD Billion)
- Table 74 Latin America: Floating Power Plants Market, by Power Source, 2019-2032 (USD Billion)
- Table 75 Latin America: Floating Power Plants Market, by Power Rating, 2019-2032 (USD Billion)
- Table 76 Latin America: Floating Power Plants Market, by Platform Type, 2019-2032 (USD Billion)
- Table 77 Mexico: Floating Power Plants Market, by Power Source, 2019-2032 (USD Billion)
- Table 78 Mexico: Floating Power Plants Market, by Power Rating, 2019-2032 (USD Billion)
- Table 79 Mexico: Floating Power Plants Market, by Platform Type, 2019-2032 (USD Billion)
- Table 80 Brazil: Floating Power Plants Market, by Power Source, 2019-2032 (USD Billion)
- Table 81 Brazil: Floating Power Plants Market, by Power Rating, 2019-2032 (USD Billion)
- Table 82 Brazil: Floating Power Plants Market, by Platform Type, 2019-2032 (USD Billion)
- Table 83 Argentina: Floating Power Plants Market, by Power Source, 2019-2032 (USD Billion)
- Table 84 Argentina: Floating Power Plants Market, by Power Rating, 2019-2032 (USD Billion)
- Table 85 Argentina: Floating Power Plants Market, by Platform Type, 2019-2032 (USD Billion)
List of Figures
- Figure 1. Global Floating Power Plants Market, 2019-2032 (USD Billion)
- Figure 2. Integrated Ecosystem
- Figure 3. Research Methodology: Top-Down & Bottom-Up Approach
- Figure 4. Market by Geography
- Figure 5. Porter's Five Forces
- Figure 6. Market by Power Rating
- Figure 7. Global Floating Power Plants Market, by Power Rating, 2022 & 2032 (USD Billion)
- Figure 8. Market by Power Source
- Figure 9. Global Floating Power Plants Market, by Power Source, 2022 & 2032 (USD Billion)
- Figure 10. Market by Platform Type
- Figure 11. Global Floating Power Plants Market, by Platform Type, 2022 & 2032 (USD Billion)
- Figure 12. Floating Power Plants Market Assessment, By Geography, 2019-2032 (USD Billion)
- Figure 13. Strategic Analysis - Floating Power Plants Market
The global floating power plants market size is expected to reach USD 24.00 billion by 2032, according to a new study by Polaris Market Research. The report "Floating Power Plants Market Share, Size, Trends, Industry Analysis Report, By Power Source (Non-renewable and Renewable); By Power Rating; By Platform Type; By Region; Segment Forecast, 2024 - 2032" gives a detailed insight into current market dynamics and provides analysis on future market growth.
Increasing global energy demand, particularly in off-grid and remote areas, and several environmental benefits associated with the floating solar and wind power plants, such as lower environmental impacts and reduction of carbon emissions, are primary factors influencing the market growth. In addition, the growing incorporation of digital technologies and other advancements that enable real-time monitoring, data-driven optimization, and predictive maintenance, coupled with the rising investments toward the development of new floating solar plant projects, will likely bode well for market growth in the near future.
For instance, in August 2022, the Renewable Energy Department India announced that a floating solar power plant was going to be constructed in Madhya Pradesh. It is likely to be the world's largest floating solar plant, with an estimate of generating 600 MW of power by 2022-23.
The rising number of innovations in solar panel design and materials, including bifacial solar panels, floating photovoltaic systems, and anti-reflective coatings, have led to increased or enhanced efficiency and reduced costs for floating solar power plants and growing developments of floating solar plants worldwide by both government and private organizations, the market for FPPs is drastically increasing.
For instance, in June 2023, EDF Group announced the launch of its new Lazer floating solar power plant, 1st facility in France and also the 1st to combine photovoltaic & hydroelectric power generation at a single site.
Furthermore, the growing adoption of modular construction methods for the creating floating power plants that allow for easier assembly, transportation, and deployment of floating power plants and make them more adaptable to different water bodies and scalable to various energy demands is likely to have a positive impact on the market over the coming years.
Floating Power Plants Market Report Highlights
The non-renewable segment accounted for the largest market share, mainly due to its low operating costs, better reliability, and high-power density.
The high-power segment led the market with a considerable share on account of its significant adoption in large-scale power-requiring projects or applications.
The power barges segment will grow at the highest pace, which is accelerated by its numerous advantageous characteristics, including easy deployment and higher flexibility.
Asia Pacific dominated the global market, owing to higher demand for energy from various sectors and widespread adoption of renewable energy sources.
The key market players include Mitsubishi Corporation, Ciel & Terre International, Caterpillar Inc., General Electric Company, and MAN Diesel & Turbo.
Polaris Market Research has segmented the floating power plants market report based on power source, power rating, platform type, and region:
Floating Power Plants, Power Source Outlook (Revenue - USD Billion, 2023 - 2032)
- Non-renewable
- Renewable
Floating Power Plants, Power Rating Outlook (Revenue - USD Billion, 2023 - 2032)
- High
- Medium
- Low
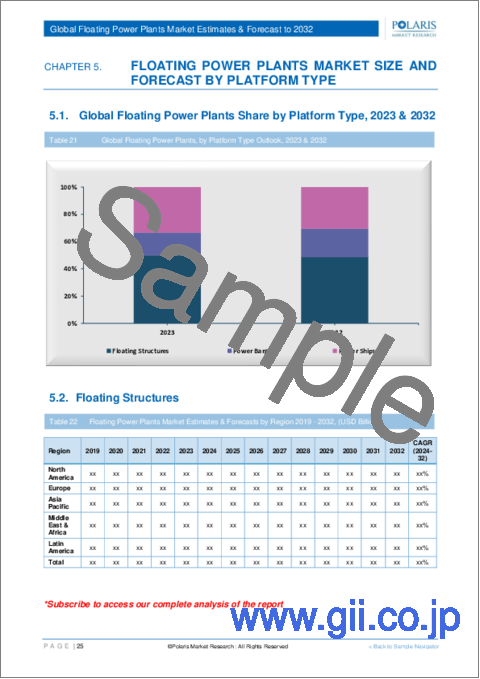
Floating Power Plants, Platform Type Outlook (Revenue - USD Billion, 2023 - 2032)
- Floating Structures
- Power Barges
- Power Ships
Floating Power Plants, Regional Outlook (Revenue - USD Billion, 2023 - 2032)
- North America
- U.S.
- Canada
- Europe
- Germany
- UK
- France
- Italy
- Spain
- Russia
- Netherlands
- Asia Pacific
- China
- India
- Japan
- South Korea
- Indonesia
- Malaysia
- Latin America
- Argentina
- Brazil
- Mexico
- Middle East & Africa
- UAE
- Saudi Arabia
- Israel
- South Africa
Table of Contents
1. Introduction
- 1.1. Report Description
- 1.1.1. Objectives of the Study
- 1.1.2. Market Scope
- 1.1.3. Assumptions
- 1.2. Stakeholders
2. Executive Summary
- 2.1. Market Highlights
3. Research Methodology
- 3.1. Overview
- 3.1.1. Data Mining
- 3.2. Data Sources
- 3.2.1. Primary Sources
- 3.2.2. Secondary Sources
4. Global Floating Power Plants Market Insights
- 4.1. Floating Power Plants Market - Platform Type Snapshot
- 4.2. Floating Power Plants Market Dynamics
- 4.2.1. Drivers and Opportunities
- 4.2.1.1. Increasing demand for green energy and government focus towards promoting renewable energy boosting the market
- 4.2.1.2. Companies are increasing the use of materials such as thermal barrier coatings and ceramics
- 4.2.2. Restraints and Challenges
- 4.2.2.1. The substantial upfront capital required for the design, construction, and installation of floating power plants and the high complexity
- 4.2.1. Drivers and Opportunities
- 4.3. Porter's Five Forces Analysis
- 4.3.1. Bargaining Power of Suppliers (Moderate)
- 4.3.2. Threats of New Entrants: (Low)
- 4.3.3. Bargaining Power of Buyers (Moderate)
- 4.3.4. Threat of Substitute (Moderate)
- 4.3.5. Rivalry among existing firms (High)
- 4.4. PESTEL Analysis
- 4.5. Floating Power Plants Market Platform Type Trends
- 4.6. Value Chain Analysis
- 4.7. COVID-19 Impact Analysis
5. Global Floating Power Plants Market, by Power Source
- 5.1. Key Findings
- 5.2. Introduction
- 5.2.1. Global Floating Power Plants Market, by Power Source, 2019-2032 (USD Billion)
- 5.3. Non-renewable
- 5.3.1. Global Floating Power Plants Market, by Non-renewable, by Region, 2019-2032 (USD Billion)
- 5.4. Renewable
- 5.4.1. Global Floating Power Plants Market, by Renewable, by Region, 2019-2032 (USD Billion)
6. Global Floating Power Plants Market, by Power Rating
- 6.1. Key Findings
- 6.2. Introduction
- 6.2.1. Global Floating Power Plants Market, by Power Rating, 2019-2032 (USD Billion)
- 6.3. High
- 6.3.1. Global Floating Power Plants Market, by High, by Region, 2019-2032 (USD Billion)
- 6.4. Medium
- 6.4.1. Global Floating Power Plants Market, by Medium, by Region, 2019-2032 (USD Billion)
- 6.5. Low
- 6.5.1. Global Floating Power Plants Market, by Low, by Region, 2019-2032 (USD Billion)
7. Global Floating Power Plants Market, by Platform Type
- 7.1. Key Findings
- 7.2. Introduction
- 7.2.1. Global Floating Power Plants Market, by Platform Type, 2019-2032 (USD Billion)
- 7.3. Floating Structures
- 7.3.1. Global Floating Power Plants Market, by Floating Structures, By Region, 2019-2032 (USD Billion)
- 7.4. Power Barges
- 7.4.1. Global Floating Power Plants Market, by Power Barges, By Region, 2019-2032 (USD Billion)
- 7.5. Power Ships
- 7.5.1. Global Floating Power Plants Market, by Power Ships, By Region, 2019-2032 (USD Billion)
8. Global Floating Power Plants Market, by Geography
- 8.1. Key findings
- 8.2. Introduction
- 8.2.1. Floating Power Plants Market Assessment, By Geography, 2019-2032 (USD Billion)
- 8.3. Floating Power Plants Market - North America
- 8.3.1. North America: Floating Power Plants Market, by Power Source, 2019-2032 (USD Billion)
- 8.3.2. North America: Floating Power Plants Market, by Platform Type, 2019-2032 (USD Billion)
- 8.3.3. North America: Floating Power Plants Market, by Power Rating, 2019-2032 (USD Billion)
- 8.3.4. Floating Power Plants Market - U.S.
- 8.3.4.1. U.S.: Floating Power Plants Market, by Power Source, 2019-2032 (USD Billion)
- 8.3.4.2. U.S.: Floating Power Plants Market, by Platform Type, 2019-2032 (USD Billion)
- 8.3.4.3. U.S.: Floating Power Plants Market, by Power Rating, 2019-2032 (USD Billion)
- 8.3.5. Floating Power Plants Market - Canada
- 8.3.5.1. Canada: Floating Power Plants Market, by Power Source, 2019-2032 (USD Billion)
- 8.3.5.2. Canada.: Floating Power Plants Market, by Platform Type, 2019-2032 (USD Billion)
- 8.3.5.3. Canada: Floating Power Plants Market, by Power Rating, 2019-2032 (USD Billion)
- 8.4. Floating Power Plants Market - Europe
- 8.4.1. Europe: Floating Power Plants Market, by Power Source, 2019-2032 (USD Billion)
- 8.4.2. Europe.: Floating Power Plants Market, by Platform Type, 2019-2032 (USD Billion)
- 8.4.3. Europe: Floating Power Plants Market, by Power Rating, 2019-2032 (USD Billion)
- 8.4.4. Floating Power Plants Market - UK
- 8.4.4.1. UK: Floating Power Plants Market, by Power Source, 2019-2032 (USD Billion)
- 8.4.4.2. UK.: Floating Power Plants Market, by Platform Type, 2019-2032 (USD Billion)
- 8.4.4.3. UK: Floating Power Plants Market, by Power Rating, 2019-2032 (USD Billion)
- 8.4.5. Floating Power Plants Market - France
- 8.4.5.1. France: Floating Power Plants Market, by Power Source, 2019-2032 (USD Billion)
- 8.4.5.2. France.: Floating Power Plants Market, by Platform Type, 2019-2032 (USD Billion)
- 8.4.5.3. France: Floating Power Plants Market, by Power Rating, 2019-2032 (USD Billion)
- 8.4.6. Floating Power Plants Market - Germany
- 8.4.6.1. Germany: Floating Power Plants Market, by Power Source, 2019-2032 (USD Billion)
- 8.4.6.2. Germany.: Floating Power Plants Market, by Platform Type, 2019-2032 (USD Billion)
- 8.4.6.3. Germany: Floating Power Plants Market, by Power Rating, 2019-2032 (USD Billion)
- 8.4.7. Floating Power Plants Market - Italy
- 8.4.7.1. Italy: Floating Power Plants Market, by Power Source, 2019-2032 (USD Billion)
- 8.4.7.2. Italy.: Floating Power Plants Market, by Platform Type, 2019-2032 (USD Billion)
- 8.4.7.3. Italy: Floating Power Plants Market, by Power Rating, 2019-2032 (USD Billion)
- 8.4.8. Floating Power Plants Market - Spain
- 8.4.8.1. Spain: Floating Power Plants Market, by Power Source, 2019-2032 (USD Billion)
- 8.4.8.2. Spain.: Floating Power Plants Market, by Platform Type, 2019-2032 (USD Billion)
- 8.4.8.3. Spain: Floating Power Plants Market, by Power Rating, 2019-2032 (USD Billion)
- 8.4.9. Floating Power Plants Market - Netherlands
- 8.4.9.1. Netherlands: Floating Power Plants Market, by Power Source, 2019-2032 (USD Billion)
- 8.4.9.2. Netherlands.: Floating Power Plants Market, by Platform Type, 2019-2032 (USD Billion)
- 8.4.9.3. Netherlands: Floating Power Plants Market, by Power Rating, 2019-2032 (USD Billion)
- 8.4.10. Floating Power Plants Market - Russia
- 8.4.10.1. Russia: Floating Power Plants Market, by Power Source, 2019-2032 (USD Billion)
- 8.4.10.2. Russia.: Floating Power Plants Market, by Platform Type, 2019-2032 (USD Billion)
- 8.4.10.3. Russia: Floating Power Plants Market, by Power Rating, 2019-2032 (USD Billion)
- 8.5. Floating Power Plants Market - Asia Pacific
- 8.5.1. Asia Pacific: Floating Power Plants Market, by Power Source, 2019-2032 (USD Billion)
- 8.5.2. Asia Pacific.: Floating Power Plants Market, by Platform Type, 2019-2032 (USD Billion)
- 8.5.3. Asia Pacific: Floating Power Plants Market, by Power Rating, 2019-2032 (USD Billion)
- 8.5.4. Floating Power Plants Market - China
- 8.5.4.1. China: Floating Power Plants Market, by Power Source, 2019-2032 (USD Billion)
- 8.5.4.2. China.: Floating Power Plants Market, by Platform Type, 2019-2032 (USD Billion)
- 8.5.4.3. China: Floating Power Plants Market, by Power Rating, 2019-2032 (USD Billion)
- 8.5.5. Floating Power Plants Market - India
- 8.5.5.1. India: Floating Power Plants Market, by Power Source, 2019-2032 (USD Billion)
- 8.5.5.2. India.: Floating Power Plants Market, by Platform Type, 2019-2032 (USD Billion)
- 8.5.5.3. India: Floating Power Plants Market, by Power Rating, 2019-2032 (USD Billion)
- 8.5.6. Floating Power Plants Market - Malaysia
- 8.5.6.1. Malaysia: Floating Power Plants Market, by Power Source, 2019-2032 (USD Billion)
- 8.5.6.2. Malaysia.: Floating Power Plants Market, by Platform Type, 2019-2032 (USD Billion)
- 8.5.6.3. Malaysia: Floating Power Plants Market, by Power Rating, 2019-2032 (USD Billion)
- 8.5.7. Floating Power Plants Market - Japan
- 8.5.7.1. Japan: Floating Power Plants Market, by Power Source, 2019-2032 (USD Billion)
- 8.5.7.2. Japan.: Floating Power Plants Market, by Platform Type, 2019-2032 (USD Billion)
- 8.5.7.3. Japan: Floating Power Plants Market, by Power Rating, 2019-2032 (USD Billion)
- 8.5.8. Floating Power Plants Market - Indonesia
- 8.5.8.1. Indonesia: Floating Power Plants Market, by Power Source, 2019-2032 (USD Billion)
- 8.5.8.2. Indonesia.: Floating Power Plants Market, by Platform Type, 2019-2032 (USD Billion)
- 8.5.8.3. Indonesia: Floating Power Plants Market, by Power Rating, 2019-2032 (USD Billion)
- 8.5.9. Floating Power Plants Market - South Korea
- 8.5.9.1. South Korea: Floating Power Plants Market, by Power Source, 2019-2032 (USD Billion)
- 8.5.9.2. South Korea.: Floating Power Plants Market, by Platform Type, 2019-2032 (USD Billion)
- 8.5.9.3. South Korea: Floating Power Plants Market, by Power Rating, 2019-2032 (USD Billion)
- 8.6. Floating Power Plants Market - Middle East & Africa
- 8.6.1. Middle East & Africa: Floating Power Plants Market, by Power Source, 2019-2032 (USD Billion)
- 8.6.2. Middle East & Africa.: Floating Power Plants Market, by Platform Type, 2019-2032 (USD Billion)
- 8.6.3. Middle East & Africa: Floating Power Plants Market, by Power Rating, 2019-2032 (USD Billion)
- 8.6.4. Floating Power Plants Market - Saudi Arabia
- 8.6.4.1. Saudi Arabia: Floating Power Plants Market, by Power Source, 2019-2032 (USD Billion)
- 8.6.4.2. Saudi Arabia.: Floating Power Plants Market, by Platform Type, 2019-2032 (USD Billion)
- 8.6.4.3. Saudi Arabia: Floating Power Plants Market, by Power Rating, 2019-2032 (USD Billion)
- 8.6.5. Floating Power Plants Market - UAE
- 8.6.5.1. UAE: Floating Power Plants Market, by Power Source, 2019-2032 (USD Billion)
- 8.6.5.2. UAE.: Floating Power Plants Market, by Platform Type, 2019-2032 (USD Billion)
- 8.6.5.3. UAE: Floating Power Plants Market, by Power Rating, 2019-2032 (USD Billion)
- 8.6.6. Floating Power Plants Market - Israel
- 8.6.6.1. Israel: Floating Power Plants Market, by Power Source, 2019-2032 (USD Billion)
- 8.6.6.2. Israel.: Floating Power Plants Market, by Platform Type, 2019-2032 (USD Billion)
- 8.6.6.3. Israel: Floating Power Plants Market, by Power Rating, 2019-2032 (USD Billion)
- 8.6.7. Floating Power Plants Market - South Africa
- 8.6.7.1. South Africa: Floating Power Plants Market, by Power Source, 2019-2032 (USD Billion)
- 8.6.7.2. South Africa.: Floating Power Plants Market, by Platform Type, 2019-2032 (USD Billion)
- 8.6.7.3. South Africa: Floating Power Plants Market, by Power Rating, 2019-2032 (USD Billion)
- 8.7. Floating Power Plants Market - Latin America
- 8.7.1. Latin America: Floating Power Plants Market, by Power Source, 2019-2032 (USD Billion)
- 8.7.2. Latin America.: Floating Power Plants Market, by Platform Type, 2019-2032 (USD Billion)
- 8.7.3. Latin America: Floating Power Plants Market, by Power Rating, 2019-2032 (USD Billion)
- 8.7.4. Floating Power Plants Market - Mexico
- 8.7.4.1. Mexico: Floating Power Plants Market, by Power Source, 2019-2032 (USD Billion)
- 8.7.4.2. Mexico.: Floating Power Plants Market, by Platform Type, 2019-2032 (USD Billion)
- 8.7.4.3. Mexico: Floating Power Plants Market, by Power Rating, 2019-2032 (USD Billion)
- 8.7.5. Floating Power Plants Market - Brazil
- 8.7.5.1. Brazil: Floating Power Plants Market, by Power Source, 2019-2032 (USD Billion)
- 8.7.5.2. Brazil.: Floating Power Plants Market, by Platform Type, 2019-2032 (USD Billion)
- 8.7.5.3. Brazil: Floating Power Plants Market, by Power Rating, 2019-2032 (USD Billion)
- 8.7.6. Floating Power Plants Market - Argentina
- 8.7.6.1. Argentina: Floating Power Plants Market, by Power Source, 2019-2032 (USD Billion)
- 8.7.6.2. Argentina.: Floating Power Plants Market, by Platform Type, 2019-2032 (USD Billion)
- 8.7.6.3. Argentina: Floating Power Plants Market, by Power Rating, 2019-2032 (USD Billion)
9. Competitive Landscape
- 9.1. Expansion and Acquisition Analysis
- 9.1.1. Expansion
- 9.1.2. Acquisitions
- 9.2. Partnerships/Collaborations/Agreements/Exhibitions
10. Company Profiles
- 10.1. Caterpillar Inc.
- 10.1.1. Company Overview
- 10.1.2. Financial Performance
- 10.1.3. Product Benchmarking
- 10.1.4. Recent Development
- 10.2. Ciel & Terre International
- 10.2.1. Company Overview
- 10.2.2. Financial Performance
- 10.2.3. Product Benchmarking
- 10.2.4. Recent Development
- 10.3. Flack Renewable SpA
- 10.3.1. Company Overview
- 10.3.2. Financial Performance
- 10.3.3. Product Benchmarking
- 10.3.4. Recent Development
- 10.4. Floating Power Plant A/S
- 10.4.1. Company Overview
- 10.4.2. Financial Performance
- 10.4.3. Product Benchmarking
- 10.4.4. Recent Development
- 10.5. General Electric Company
- 10.5.1. Company Overview
- 10.5.2. Financial Performance
- 10.5.3. Product Benchmarking
- 10.5.4. Recent Development
- 10.6. Kyocera Corporation
- 10.6.1. Company Overview
- 10.6.2. Financial Performance
- 10.6.3. Product Benchmarking
- 10.6.4. Recent Development
- 10.7. MAN Diesel & Turbo SE
- 10.7.1. Company Overview
- 10.7.2. Financial Performance
- 10.7.3. Product Benchmarking
- 10.7.4. Recent Development
- 10.8. Mitsubishi Corporation
- 10.8.1. Company Overview
- 10.8.2. Financial Performance
- 10.8.3. Product Benchmarking
- 10.8.4. Recent Development
- 10.9. Principle Power Inc
- 10.9.1. Company Overview
- 10.9.2. Financial Performance
- 10.9.3. Product Benchmarking
- 10.9.4. Recent Development
- 10.10.SeaTwirl AB
- 10.10.1. Company Overview
- 10.10.2. Financial Performance
- 10.10.3. Product Benchmarking
- 10.10.4. Recent Development
- 10.11. Siemens AG
- 10.11.1. Company Overview
- 10.11.2. Financial Performance
- 10.11.3. Product Benchmarking
- 10.11.4. Recent Development
- 10.12. Upsolar
- 10.12.1. Company Overview
- 10.12.2. Financial Performance
- 10.12.3. Product Benchmarking
- 10.12.4. Recent Development
- 10.13. Vikram Solar
- 10.13.1. Company Overview
- 10.13.2. Financial Performance
- 10.13.3. Product Benchmarking
- 10.13.4. Recent Development
- 10.14. Wartsila
- 10.14.1. Company Overview
- 10.14.2. Financial Performance
- 10.14.3. Product Benchmarking
- 10.14.4. Recent Development
- 10.15. Yingli Solar
- 10.15.1. Company Overview
- 10.15.2. Financial Performance
- 10.15.3. Product Benchmarking
- 10.15.4. Recent Development