|
|
市場調査レポート
商品コード
1175567
パーティクルカウンターの世界市場 - 市場シェア・規模・動向・業界分析:タイプ別、最終用途別、用途別、地域別、セグメント予測(2022年~2030年)Particle Counters Market Share, Size, Trends, Industry Analysis Report, By Type ; By End-Use; By Application; By Region; Segment Forecast, 2022 - 2030 |
||||||
|
|
|||||||
|
● お客様のご希望に応じて、既存データの加工や未掲載情報(例:国別セグメント)の追加などの対応が可能です。 詳細はお問い合わせください。 |
|||||||


| パーティクルカウンターの世界市場 - 市場シェア・規模・動向・業界分析:タイプ別、最終用途別、用途別、地域別、セグメント予測(2022年~2030年) |
|
出版日: 2022年11月01日
発行: Polaris Market Research
ページ情報: 英文 117 Pages
納期: 即日から翌営業日
|
- 全表示
- 概要
- 図表
- 目次
世界のパーティクルカウンターの市場規模は、2030年までに11億770万米ドルに達すると予測されています。
当レポートでは、世界のパーティクルカウンター市場を調査しており、市場の概要、市場規模や予測、動向、促進要因・抑制要因、タイプ別・最終用途別・用途別・地域別などの分析、さらに企業プロファイルなどを提供しています。
目次
第1章 イントロダクション
- レポートの説明
- 調査の目的
- 市場範囲
- 前提条件
- 利害関係者
第2章 エグゼクティブサマリー
- 市場のハイライト
第3章 調査手法
- 概要
- データマイニング
- 情報源
- 一次情報
- 二次情報
第4章 世界のパーティクルカウンター市場の洞察
- パーティクルカウンター - 業界のスナップショット
- パーティクルカウンター市場力学
- 促進要因と機会
- 抑制要因と課題
- ポーターのファイブフォース分析
- 供給企業の交渉力
- 新規参入者の脅威
- 買い手の交渉力
- 代替品の脅威
- 既存企業間の競争力
- PESTEL分析
- パーティクルカウンター市場の業界動向
- バリューチェーン分析
- COVID-19影響分析
第5章 世界のパーティクルカウンター市場:タイプ別
- 主な調査結果
- イントロダクション
- 世界のパーティクルカウンター市場、タイプ別(2018年~2030年)
- 空中パーティクルカウンター
- 世界のパーティクルカウンター市場、空中パーティクルカウンター別、地域別(2018年~2030年)
- ポータブル
- リモート
- ハンドヘルド
- 結露/超微粒子
- 液体パーティクルカウンター
- 世界のパーティクルカウンター市場、液体パーティクルカウンター別、地域別(2018年~2030年)
- オンライン/インライン
- オフライン
- 粉塵パーティクルカウンター
- 世界のパーティクルカウンター市場、粉塵パーティクルカウンター別、地域別(2018年~2030年)
- その他
- 世界のパーティクルカウンター市場、その他別、地域別(2018年~2030年)
第6章 世界のパーティクルカウンター市場:用途別
- 主な調査結果
- イントロダクション
- 世界のパーティクルカウンター市場、用途別(2018年~2030年)
- クリーンルームモニタリング
- 世界のパーティクルカウンター市場、クリーンルームモニタリング別、地域別(2018年~2030年)
- 飲料水汚染モニタリング
- 世界のパーティクルカウンター市場、飲料水汚染モニタリング別、地域別(2018年~2030年)
- エアロゾルモニタリング・調査
- 世界のパーティクルカウンター市場、エアロゾルモニタリング・調査別、地域別(2018年~2030年)
- 室内空気品質モニタリング
- 世界のパーティクルカウンター市場、室内空気品質モニタリング別、地域別(2018年~2030年)
- 液体汚染モニタリング
- 世界のパーティクルカウンター市場、液体汚染モニタリング別、地域別(2018年~2030年)
- 化学物質汚染モニタリング
- 世界のパーティクルカウンター市場、化学物質汚染モニタリング別、地域別(2018年~2030年)
- その他の用途
- 世界のパーティクルカウンター市場、その他の用途別、地域別(2018年~2030年)
第7章 世界のパーティクルカウンター市場:最終用途別
- 主な調査結果
- イントロダクション
- 世界のパーティクルカウンター市場、最終用途別(2018年~2030年)
- ライフサイエンス・医療機器産業
- 世界のパーティクルカウンター市場、ライフサイエンス・医療機器産業別、地域別(2018年~2030年)
- 半導体産業
- 世界のパーティクルカウンター市場、半導体産業別、地域別(2018年~2030年)
- 自動車産業
- 世界のパーティクルカウンター市場、自動車産業別、地域別(2018年~2030年)
- 航空宇宙産業
- 世界のパーティクルカウンター市場、航空宇宙産業別、地域別(2018年~2030年)
- 食品・飲料産業
- 世界のパーティクルカウンター市場、食品・飲料産業別、地域別(2018年~2030年)
- その他の最終用途
- 世界のパーティクルカウンター市場、その他の最終用途別、地域別(2018年~2030年)
第8章 世界のパーティクルカウンター市場:地域別
- 主な調査結果
- イントロダクション
- パーティクルカウンター市場の評価、地域別(2018年~2030年)
- パーティクルカウンター市場 - 北米
- 北米:パーティクルカウンター市場、タイプ別(2018年~2030年)
- 北米:パーティクルカウンター市場、最終用途別(2018年~2030年)
- 北米:パーティクルカウンター市場、用途別(2018年~2030年)
- パーティクルカウンター市場 - 米国
- パーティクルカウンター市場 - カナダ
- パーティクルカウンター市場 - 欧州
- 欧州:パーティクルカウンター市場、タイプ別(2018年~2030年)
- 欧州:パーティクルカウンター市場、最終用途別(2018年~2030年)
- 欧州:パーティクルカウンター市場、用途別(2018年~2030年)
- パーティクルカウンター市場 - 英国
- パーティクルカウンター市場 - フランス
- パーティクルカウンター市場 - ドイツ
- パーティクルカウンター市場 - イタリア
- パーティクルカウンター市場 - スペイン
- パーティクルカウンター市場 - オランダ
- パーティクルカウンター市場 - ロシア
- パーティクルカウンター市場 - アジア太平洋
- アジア太平洋:パーティクルカウンター市場、タイプ別(2018年~2030年)
- アジア太平洋:パーティクルカウンター市場、最終用途別(2018年~2030年)
- アジア太平洋:パーティクルカウンター市場、用途別(2018年~2030年)
- パーティクルカウンター市場 - 中国
- パーティクルカウンター市場 - インド
- パーティクルカウンター市場 - マレーシア
- パーティクルカウンター市場 - 日本
- パーティクルカウンター市場 - インドネシア
- パーティクルカウンター市場 - 韓国
- パーティクルカウンター市場 - 中東・アフリカ
- 中東・アフリカ:パーティクルカウンター市場、タイプ別(2018年~2030年)
- 中東・アフリカ:パーティクルカウンター市場、最終用途別(2018年~2030年)
- 中東・アフリカ:パーティクルカウンター市場、用途別(2018年~2030年)
- パーティクルカウンター市場 - サウジアラビア
- パーティクルカウンター市場 - アラブ首長国連邦
- パーティクルカウンター市場 - イスラエル
- パーティクルカウンター市場 - 南アフリカ
- パーティクルカウンター市場 - ラテンアメリカ
- ラテンアメリカ:パーティクルカウンター市場、タイプ別(2018年~2030年)
- ラテンアメリカ:パーティクルカウンター市場、最終用途別(2018年~2030年)
- ラテンアメリカ:パーティクルカウンター市場、用途別(2018年~2030年)
- パーティクルカウンター市場 - メキシコ
- パーティクルカウンター市場 - ブラジル
- パーティクルカウンター市場 - アルゼンチン
第9章 競合情勢
- 拡大・買収の分析
- 拡大
- 買収
- パートナーシップ/コラボレーション/協定/公開
第10章 企業プロファイル
- Beckman Coulter
- Climet Instruments
- Chemtrac Corp
- Extech Instruments
- Fluke Corporation
- GrayWolf Sensing Solutions
- Hal Technology
- Konamax Corporation
- Lighthouse Worldwide Solutions
- Met One Instruments
- Particle Measuring Systems
- PCE Instruments
- Palas
- PAMAS
- Particle Plus Corp
- RION
- Setra Systems
- TSI Inc
- Veltek Associates
List of Tables
- Table 1 Global Particle Counters Market, by Type, 2018 - 2030 (USD Million)
- Table 2 Global Particle Counters Market, by Application, 2018 - 2030 (USD Million)
- Table 3 Global Particle Counters Market, by End-Use, 2018 - 2030 (USD Million)
- Table 4 Particle Counters Market Assessment, By Geography, 2018 - 2030 (USD Million)
- Table 5 North America: Particle Counters Market, by Type, 2018 - 2030 (USD Million)
- Table 6 North America: Particle Counters Market, by Application, 2018 - 2030 (USD Million)
- Table 7 North America: Particle Counters Market, by End-Use, 2018 - 2030 (USD Million)
- Table 8 U.S.: Particle Counters Market, by Type, 2018 - 2030 (USD Million)
- Table 9 U.S.: Particle Counters Market, by Application, 2018 - 2030 (USD Million)
- Table 10 U.S.: Particle Counters Market, by End-Use, 2018 - 2030 (USD Million)
- Table 11 Canada: Particle Counters Market, by Type, 2018 - 2030 (USD Million)
- Table 12 Canada: Particle Counters Market, by Application, 2018 - 2030 (USD Million)
- Table 13 Canada: Particle Counters Market, by End-Use, 2018 - 2030 (USD Million)
- Table 14 Europe: Particle Counters Market, by Type, 2018 - 2030 (USD Million)
- Table 15 Europe: Particle Counters Market, by Application, 2018 - 2030 (USD Million)
- Table 16 Europe: Particle Counters Market, by End-Use, 2018 - 2030 (USD Million)
- Table 17 UK: Particle Counters Market, by Type, 2018 - 2030 (USD Million)
- Table 18 UK: Particle Counters Market, by Application, 2018 - 2030 (USD Million)
- Table 19 UK: Particle Counters Market, by End-Use, 2018 - 2030 (USD Million)
- Table 20 France: Particle Counters Market, by Type, 2018 - 2030 (USD Million)
- Table 21 France: Particle Counters Market, by Application, 2018 - 2030 (USD Million)
- Table 22 France: Particle Counters Market, by End-Use, 2018 - 2030 (USD Million)
- Table 23 Germany: Particle Counters Market, by Type, 2018 - 2030 (USD Million)
- Table 24 Germany: Particle Counters Market, by Application, 2018 - 2030 (USD Million)
- Table 25 Germany: Particle Counters Market, by End-Use, 2018 - 2030 (USD Million)
- Table 26 Italy: Particle Counters Market, by Type, 2018 - 2030 (USD Million)
- Table 27 Italy: Particle Counters Market, by Application, 2018 - 2030 (USD Million)
- Table 28 Italy: Particle Counters Market, by End-Use, 2018 - 2030 (USD Million)
- Table 29 Spain: Particle Counters Market, by Type, 2018 - 2030 (USD Million)
- Table 30 Spain: Particle Counters Market, by Application, 2018 - 2030 (USD Million)
- Table 31 Spain: Particle Counters Market, by End-Use, 2018 - 2030 (USD Million)
- Table 32 Netherlands: Particle Counters Market, by Type, 2018 - 2030 (USD Million)
- Table 33 Netherlands: Particle Counters Market, by Application, 2018 - 2030 (USD Million)
- Table 34 Netherlands: Particle Counters Market, by End-Use, 2018 - 2030 (USD Million)
- Table 35 Russia: Particle Counters Market, by Type, 2018 - 2030 (USD Million)
- Table 36 Russia: Particle Counters Market, by Application, 2018 - 2030 (USD Million)
- Table 37 Russia: Particle Counters Market, by End-Use, 2018 - 2030 (USD Million)
- Table 38 Asia Pacific: Particle Counters Market, by Type, 2018 - 2030 (USD Million)
- Table 39 Asia Pacific: Particle Counters Market, by Application, 2018 - 2030 (USD Million)
- Table 40 Asia Pacific: Particle Counters Market, by End-Use, 2018 - 2030 (USD Million)
- Table 41 China: Particle Counters Market, by Type, 2018 - 2030 (USD Million)
- Table 42 China: Particle Counters Market, by Application, 2018 - 2030 (USD Million)
- Table 43 China: Particle Counters Market, by End-Use, 2018 - 2030 (USD Million)
- Table 44 India: Particle Counters Market, by Type, 2018 - 2030 (USD Million)
- Table 45 India: Particle Counters Market, by Application, 2018 - 2030 (USD Million)
- Table 46 India: Particle Counters Market, by End-Use, 2018 - 2030 (USD Million)
- Table 47 Malaysia: Particle Counters Market, by Type, 2018 - 2030 (USD Million)
- Table 48 Malaysia: Particle Counters Market, by Application, 2018 - 2030 (USD Million)
- Table 49 Malaysia: Particle Counters Market, by End-Use, 2018 - 2030 (USD Million)
- Table 50 Japan: Particle Counters Market, by Type, 2018 - 2030 (USD Million)
- Table 51 Japan: Particle Counters Market, by Application, 2018 - 2030 (USD Million)
- Table 52 Japan: Particle Counters Market, by End-Use, 2018 - 2030 (USD Million)
- Table 53 Indonesia: Particle Counters Market, by Type, 2018 - 2030 (USD Million)
- Table 54 Indonesia: Particle Counters Market, by Application, 2018 - 2030 (USD Million)
- Table 55 Indonesia: Particle Counters Market, by End-Use, 2018 - 2030 (USD Million)
- Table 56 South Korea: Particle Counters Market, by Type, 2018 - 2030 (USD Million)
- Table 57 South Korea: Particle Counters Market, by Application, 2018 - 2030 (USD Million)
- Table 58 South Korea: Particle Counters Market, by End-Use, 2018 - 2030 (USD Million)
- Table 59 Middle East & Africa: Particle Counters Market, by Type, 2018 - 2030 (USD Million)
- Table 60 Middle East & Africa: Particle Counters Market, by Application, 2018 - 2030 (USD Million)
- Table 61 Middle East & Africa: Particle Counters Market, by End-Use, 2018 - 2030 (USD Million)
- Table 62 Saudi Arabia: Particle Counters Market, by Type, 2018 - 2030 (USD Million)
- Table 63 Saudi Arabia: Particle Counters Market, by Application, 2018 - 2030 (USD Million)
- Table 64 Saudi Arabia: Particle Counters Market, by End-Use, 2018 - 2030 (USD Million)
- Table 65 UAE: Particle Counters Market, by Type, 2018 - 2030 (USD Million)
- Table 66 UAE: Particle Counters Market, by Application, 2018 - 2030 (USD Million)
- Table 67 UAE: Particle Counters Market, by End-Use, 2018 - 2030 (USD Million)
- Table 68 Israel: Particle Counters Market, by Type, 2018 - 2030 (USD Million)
- Table 69 Israel: Particle Counters Market, by Application, 2018 - 2030 (USD Million)
- Table 70 Israel: Particle Counters Market, by End-Use, 2018 - 2030 (USD Million)
- Table 71 South Africa: Particle Counters Market, by Type, 2018 - 2030 (USD Million)
- Table 72 South Africa: Particle Counters Market, by Application, 2018 - 2030 (USD Million)
- Table 73 South Africa: Particle Counters Market, by End-Use, 2018 - 2030 (USD Million)
- Table 74 Latin America: Particle Counters Market, by Type, 2018 - 2030 (USD Million)
- Table 75 Latin America: Particle Counters Market, by Application, 2018 - 2030 (USD Million)
- Table 76 Latin America: Particle Counters Market, by End-Use, 2018 - 2030 (USD Million)
- Table 77 Mexico: Particle Counters Market, by Type, 2018 - 2030 (USD Million)
- Table 78 Mexico: Particle Counters Market, by Application, 2018 - 2030 (USD Million)
- Table 79 Mexico: Particle Counters Market, by End-Use, 2018 - 2030 (USD Million)
- Table 80 Brazil: Particle Counters Market, by Type, 2018 - 2030 (USD Million)
- Table 81 Brazil: Particle Counters Market, by Application, 2018 - 2030 (USD Million)
- Table 82 Brazil: Particle Counters Market, by End-Use, 2018 - 2030 (USD Million)
- Table 83 Argentina: Particle Counters Market, by Type, 2018 - 2030 (USD Million)
- Table 84 Argentina: Particle Counters Market, by Application, 2018 - 2030 (USD Million)
- Table 85 Argentina: Particle Counters Market, by End-Use, 2018 - 2030 (USD Million)
List of Figures
Figure 1. Global Particle Counters Market, 2018 - 2030 (USD Million)
Figure 2. Integrated Ecosystem
Figure 3. Research Methodology: Top-Down & Bottom-Up Approach
Figure 4. Market by Geography
Figure 5. Porter's Five Forces
Figure 6. Market by Application
Figure 7. Global Particle Counters Market, by Application, 2021 & 2030 (USD Million)
Figure 8. Market by Type
Figure 9. Global Particle Counters Market, by Type, 2021 & 2030 (USD Million)
Figure 10. Market by End-Use
Figure 11. Global Particle Counters Market, by End-Use, 2021 & 2030 (USD Million)
Figure 12. Particle Counters Market Assessment, By Geography, 2018 - 2030 (USD Million)
Figure 13. Strategic Analysis - Particle Counters Market
The global Particle Counters market size is expected to reach USD 1,107.7 million by 2030, according to a new study by Polaris Market Research. The report "Particle Counters Market Share, Size, Trends, Industry Analysis Report, By Type (Airborne Particle Counters, Portable, Remote, Handheld, Condensation/Ultrafine, Liquid Particle Counters, Online/Inline, and Offline); By End-Use; By Application; By Region; Segment Forecast, 2022 - 2030" gives a detailed insight into current market dynamics and provides analysis on future market growth.
The market is growing due to the increased demand for indoor and outdoor air pollution monitoring services. The key players in the market are also focusing on developing indoor and outdoor monitoring services for offices and companies to combat post-pandemic. For instance, in September 2021, ATMO introduced the Atmocube, an indoor air quality monitoring device for businesses and industries.
Air quality in office buildings was essential in the post-COVID era, and this new product positioned much more for that period. Rather than being small and portable like previous models, the Atmocube is noticeable and dominant to give office workers confidence that their air quality is good. Thus these factors are supporting the market to grow rapidly.
The requirement for portable particle counters is expanding and the launches of portable counters by manufacturers are fueling the market's expansion. Portable particle counters are being produced with an emphasis by producers on on-site measurement and convenience of carrying. Automobile, aerospace, pharmaceuticals, food and beverage, and oil and gas industries all see an increase in the demand for handheld and portable particle detectors. As a result, the market for particle counters is expanding among consumers and industries.
Further, in November 2021, MP Filtri introduced the improved LPA3 portable particle counter for using phosphate esters and harsh fluids. With specialized seals, a redesigned internal architecture, and the latest firmware suite, the new "aggressive fluids" version has been improved for industry application and may be utilized with Skydrol1 and HyJet2. During the projected period, these factors are predicted to drive the market considerably.
Additionally, it is anticipated that the market will increase due to product-related technological developments and rising investments in R&D activities. For example, Particle Measuring Systems created a 20nm syringe sampler called the "SLS" in February 2020. This device will be utilized in batch sampling with the particle counter called the "Chem 20 Particle Counter." Therefore, it is anticipated that the aforementioned factors will drive the growth of the particle counter market throughout the research period.
Particle Counters Market Report Highlights
The portable counters segment is anticipated to grow at the largest CAGR over the forecast period due to increased demand for portable liquid particle counts from the oil and gas industries. The oil and gas sectors utilize a variety of particle detectors for water-based hydraulic fluids and checking injected liquid for contamination.
The airborne particle counters segment accounted for a major revenue share. This is because air quality monitoring standards are becoming more stringent, and these particle counters are used more frequently for cleanroom surveillance.
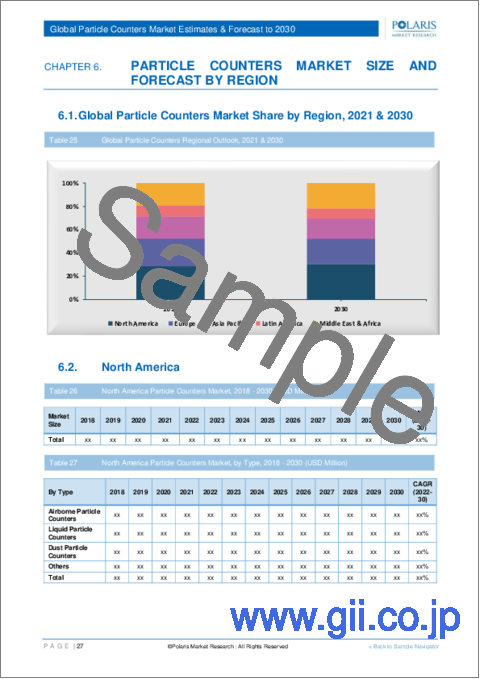
Asia-Pacific is expected to proliferate over the projected period due to the rising need for liquid particle counters inside the oil and gas industry and the presence of a fully developed medical and pharmaceutical sector.
The global players include Beckman Coulter, Climet Instruments Company, Chemtrac Corp., Fluke Corporation, Hal Technology, Konamax Corporation, Particle Measuring Systems, PAMAS, Particle Plus Corp., RION, Setra Systems, TSI Inc., and Veltek Associates.
Polaris Market Research has segmented the particle counters market report based on type, end-use, application, and region:
Particle Counters, Type Outlook (Revenue - USD Million, 2018 - 2030)
Airborne Particle Counters
Portable
Remote
Handheld
Condensation/Ultrafine
Liquid Particle Counters
Online/Inline
Offline
Dust Particle Counters
Others
Particle Counters, Application Outlook (Revenue - USD Million, 2018 - 2030)
Cleanroom Monitoring
Drinking Water Contamination Monitoring
Aerosol Monitoring and Research
Indoor Air Quality Monitoring
Contamination Monitoring of Liquids
Chemical Contamination Monitoring
Other Applications
Particle Counters, End-Use Outlook (Revenue - USD Million, 2018 - 2030)
Life Sciences and Medical Device Industry
Semiconductor Industry
Automotive Industry
Aerospace Industry
Food and Beverage Industry
Other End Users
Particle Counters, Regional Outlook (Revenue - USD Million, 2018 - 2030)
North America
U.S
Canada
Europe
Germany
UK
France
Italy
Spain
Russia
Netherlands
Asia Pacific
China
India
Japan
South Korea
Indonesia
Malaysia
Latin America
Argentina
Brazil
Mexico
Middle East & Africa
UAE
Saudi Arabia
Israel
South Africa
Table of Contents
1. Introduction
- 1.1. Report Description
- 1.1.1. Objectives of the Study
- 1.1.2. Market Scope
- 1.1.3. Assumptions
- 1.2. Stakeholders
2. Executive Summary
- 2.1. Market Highlights
3. Research Methodology
- 3.1. Overview
- 3.1.1. Data Mining
- 3.2. Data Sources
- 3.2.1. Primary Sources
- 3.2.2. Secondary Sources
4. Global Particle Counters Market Insights
- 4.1. Particle Counters - Industry Snapshot
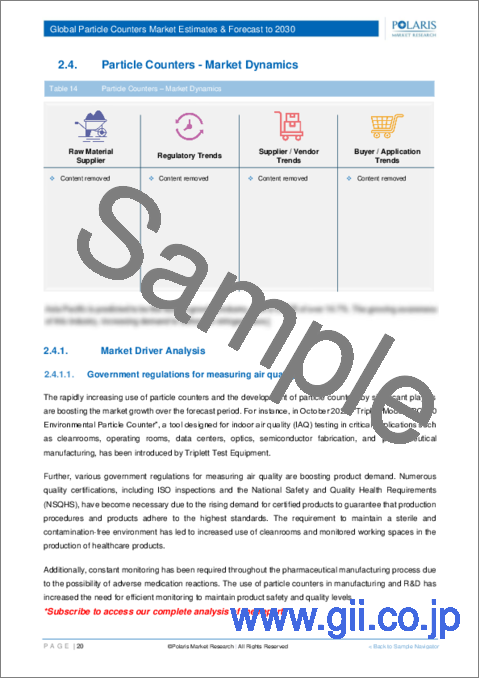
- 4.2. Particle Counters Market Dynamics
- 4.2.1. Drivers and Opportunities
- 4.2.1.1. Rising indoor air pollution
- 4.2.1.2. Government regulations for measuring air quality
- 4.2.2. Restraints and Challenges
- 4.2.2.1. High cost of particle counters
- 4.2.1. Drivers and Opportunities
- 4.3. Porter's Five Forces Analysis
- 4.3.1. Bargaining Power of Suppliers (Moderate)
- 4.3.2. Threats of New Entrants: (Low)
- 4.3.3. Bargaining Power of Buyers (Moderate)
- 4.3.4. Threat of Substitute (Moderate)
- 4.3.5. Rivalry among existing firms (High)
- 4.4. PESTEL Analysis
- 4.5. Particle Counters Market Industry Trends
- 4.6. Value Chain Analysis
- 4.7. COVID-19 Impact Analysis
5. Global Particle Counters Market, by Type
- 5.1. Key Findings
- 5.2. Introduction
- 5.2.1. Global Particle Counters Market, by Type, 2018 - 2030 (USD Million)
- 5.3. Airborne Particle Counters
- 5.3.1. Global Particle Counters Market, by Airborne Particle Counters, by Region, 2018 - 2030 (USD Million)
- 5.3.2. Portable
- 5.3.2.1. Global Particle Counters Market, by Portable, by Region, 2018 - 2030 (USD Million)
- 5.3.3. Remote
- 5.3.3.1. Global Particle Counters Market, by Remote, by Region, 2018 - 2030 (USD Million)
- 5.3.4. Handheld
- 5.3.4.1. Global Particle Counters Market, by Handheld, by Region, 2018 - 2030 (USD Million)
- 5.3.5. Condensation/Ultrafine
- 5.3.5.1. Global Particle Counters Market, by Condensation/Ultrafine, by Region, 2018 - 2030 (USD Million)
- 5.4. Liquid Particle Counters
- 5.4.1. Global Particle Counters Market, by Liquid Particle Counters, by Region, 2018 - 2030 (USD Million)
- 5.4.2. Online/Inline
- 5.4.2.1. Global Particle Counters Market, by Online/Inline, by Region, 2018 - 2030 (USD Million)
- 5.4.3. Offline
- 5.4.3.1. Global Particle Counters Market, by Offline, by Region, 2018 - 2030 (USD Million)
- 5.5. Dust Particle Counters
- 5.5.1. Global Particle Counters Market, by Dust Particle Counters, by Region, 2018 - 2030 (USD Million)
- 5.6. Others
- 5.6.1. Global Particle Counters Market, by Others, by Region, 2018 - 2030 (USD Million)
6. Global Particle Counters Market, by Application
- 6.1. Key Findings
- 6.2. Introduction
- 6.2.1. Global Particle Counters Market, by Application, 2018 - 2030 (USD Million)
- 6.3. Cleanroom Monitoring
- 6.3.1. Global Particle Counters Market, by Cleanroom Monitoring, by Region, 2018 - 2030 (USD Million)
- 6.4. Drinking Water Contamination Monitoring
- 6.4.1. Global Particle Counters Market, by Drinking Water Contamination Monitoring, by Region, 2018 - 2030 (USD Million)
- 6.5. Aerosol Monitoring and Research
- 6.5.1. Global Particle Counters Market, by Aerosol Monitoring and Research, by Region, 2018 - 2030 (USD Million)
- 6.6. Indoor Air Quality Monitoring
- 6.6.1. Global Particle Counters Market, by Indoor Air Quality Monitoring, by Region, 2018 - 2030 (USD Million)
- 6.7. Contamination Monitoring of Liquids
- 6.7.1. Global Particle Counters Market, by Contamination Monitoring of Liquids, by Region, 2018 - 2030 (USD Million)
- 6.8. Chemical Contamination Monitoring
- 6.8.1. Global Particle Counters Market, by Chemical Contamination Monitoring, by Region, 2018 - 2030 (USD Million)
- 6.9. Other Applications
- 6.9.1. Global Particle Counters Market, by Other Applications, by Region, 2018 - 2030 (USD Million)
7. Global Particle Counters Market, by End-Use
- 7.1. Key Findings
- 7.2. Introduction
- 7.2.1. Global Particle Counters Market, by End-Use, 2018 - 2030 (USD Million)
- 7.3. Life Sciences and Medical Device Industry
- 7.3.1. Global Particle Counters Market, by Life Sciences and Medical Device Industry, by Region, 2018 - 2030 (USD Million)
- 7.4. Semiconductor Industry
- 7.4.1. Global Particle Counters Market, by Semiconductor Industry, by Region, 2018 - 2030 (USD Million)
- 7.5. Automotive Industry
- 7.5.1. Global Particle Counters Market, by Automotive Industry, by Region, 2018 - 2030 (USD Million)
- 7.6. Aerospace Industry
- 7.6.1. Global Particle Counters Market, by Aerospace Industry, by Region, 2018 - 2030 (USD Million)
- 7.7. Food and Beverage Industry
- 7.7.1. Global Particle Counters Market, by Food and Beverage Industry, by Region, 2018 - 2030 (USD Million)
- 7.8. Other End Users
- 7.8.1. Global Particle Counters Market, by Other End Users, by Region, 2018 - 2030 (USD Million)
8. Global Particle Counters Market, by Geography
- 8.1. Key findings
- 8.2. Introduction
- 8.2.1. Particle Counters Market Assessment, By Geography, 2018 - 2030 (USD Million)
- 8.3. Particle Counters Market - North America
- 8.3.1. North America: Particle Counters Market, by Type, 2018 - 2030 (USD Million)
- 8.3.2. North America: Particle Counters Market, by End-Use, 2018 - 2030 (USD Million)
- 8.3.3. North America: Particle Counters Market, by Application, 2018 - 2030 (USD Million)
- 8.3.4. Particle Counters Market - U.S.
- 8.3.4.1. U.S.: Particle Counters Market, by Type, 2018 - 2030 (USD Million)
- 8.3.4.2. U.S.: Particle Counters Market, by End-Use, 2018 - 2030 (USD Million)
- 8.3.4.3. U.S.: Particle Counters Market, by Application, 2018 - 2030 (USD Million)
- 8.3.5. Particle Counters Market - Canada
- 8.3.5.1. Canada: Particle Counters Market, by Type, 2018 - 2030 (USD Million)
- 8.3.5.2. Canada.: Particle Counters Market, by End-Use, 2018 - 2030 (USD Million)
- 8.3.5.3. Canada: Particle Counters Market, by Application, 2018 - 2030 (USD Million)
- 8.4. Particle Counters Market - Europe
- 8.4.1. Europe: Particle Counters Market, by Type, 2018 - 2030 (USD Million)
- 8.4.2. Europe.: Particle Counters Market, by End-Use, 2018 - 2030 (USD Million)
- 8.4.3. Europe: Particle Counters Market, by Application, 2018 - 2030 (USD Million)
- 8.4.4. Particle Counters Market - UK
- 8.4.4.1. UK: Particle Counters Market, by Type, 2018 - 2030 (USD Million)
- 8.4.4.2. UK.: Particle Counters Market, by End-Use, 2018 - 2030 (USD Million)
- 8.4.4.3. UK: Particle Counters Market, by Application, 2018 - 2030 (USD Million)
- 8.4.5. Particle Counters Market - France
- 8.4.5.1. France: Particle Counters Market, by Type, 2018 - 2030 (USD Million)
- 8.4.5.2. France.: Particle Counters Market, by End-Use, 2018 - 2030 (USD Million)
- 8.4.5.3. France: Particle Counters Market, by Application, 2018 - 2030 (USD Million)
- 8.4.6. Particle Counters Market - Germany
- 8.4.6.1. Germany: Particle Counters Market, by Type, 2018 - 2030 (USD Million)
- 8.4.6.2. Germany.: Particle Counters Market, by End-Use, 2018 - 2030 (USD Million)
- 8.4.6.3. Germany: Particle Counters Market, by Application, 2018 - 2030 (USD Million)
- 8.4.7. Particle Counters Market - Italy
- 8.4.7.1. Italy: Particle Counters Market, by Type, 2018 - 2030 (USD Million)
- 8.4.7.2. Italy.: Particle Counters Market, by End-Use, 2018 - 2030 (USD Million)
- 8.4.7.3. Italy: Particle Counters Market, by Application, 2018 - 2030 (USD Million)
- 8.4.8. Particle Counters Market - Spain
- 8.4.8.1. Spain: Particle Counters Market, by Type, 2018 - 2030 (USD Million)
- 8.4.8.2. Spain.: Particle Counters Market, by End-Use, 2018 - 2030 (USD Million)
- 8.4.8.3. Spain: Particle Counters Market, by Application, 2018 - 2030 (USD Million)
- 8.4.9. Particle Counters Market - Netherlands
- 8.4.9.1. Netherlands: Particle Counters Market, by Type, 2018 - 2030 (USD Million)
- 8.4.9.2. Netherlands.: Particle Counters Market, by End-Use, 2018 - 2030 (USD Million)
- 8.4.9.3. Netherlands: Particle Counters Market, by Application, 2018 - 2030 (USD Million)
- 8.4.10. Particle Counters Market - Russia
- 8.4.10.1. Russia: Particle Counters Market, by Type, 2018 - 2030 (USD Million)
- 8.4.10.2. Russia.: Particle Counters Market, by End-Use, 2018 - 2030 (USD Million)
- 8.4.10.3. Russia: Particle Counters Market, by Application, 2018 - 2030 (USD Million)
- 8.5. Particle Counters Market - Asia Pacific
- 8.5.1. Asia Pacific: Particle Counters Market, by Type, 2018 - 2030 (USD Million)
- 8.5.2. Asia Pacific.: Particle Counters Market, by End-Use, 2018 - 2030 (USD Million)
- 8.5.3. Asia Pacific: Particle Counters Market, by Application, 2018 - 2030 (USD Million)
- 8.5.4. Particle Counters Market - China
- 8.5.4.1. China: Particle Counters Market, by Type, 2018 - 2030 (USD Million)
- 8.5.4.2. China.: Particle Counters Market, by End-Use, 2018 - 2030 (USD Million)
- 8.5.4.3. China: Particle Counters Market, by Application, 2018 - 2030 (USD Million)
- 8.5.5. Particle Counters Market - India
- 8.5.5.1. India: Particle Counters Market, by Type, 2018 - 2030 (USD Million)
- 8.5.5.2. India.: Particle Counters Market, by End-Use, 2018 - 2030 (USD Million)
- 8.5.5.3. India: Particle Counters Market, by Application, 2018 - 2030 (USD Million)
- 8.5.6. Particle Counters Market - Malaysia
- 8.5.6.1. Malaysia: Particle Counters Market, by Type, 2018 - 2030 (USD Million)
- 8.5.6.2. Malaysia.: Particle Counters Market, by End-Use, 2018 - 2030 (USD Million)
- 8.5.6.3. Malaysia: Particle Counters Market, by Application, 2018 - 2030 (USD Million)
- 8.5.7. Particle Counters Market - Japan
- 8.5.7.1. Japan: Particle Counters Market, by Type, 2018 - 2030 (USD Million)
- 8.5.7.2. Japan.: Particle Counters Market, by End-Use, 2018 - 2030 (USD Million)
- 8.5.7.3. Japan: Particle Counters Market, by Application, 2018 - 2030 (USD Million)
- 8.5.8. Particle Counters Market - Indonesia
- 8.5.8.1. Indonesia: Particle Counters Market, by Type, 2018 - 2030 (USD Million)
- 8.5.8.2. Indonesia.: Particle Counters Market, by End-Use, 2018 - 2030 (USD Million)
- 8.5.8.3. Indonesia: Particle Counters Market, by Application, 2018 - 2030 (USD Million)
- 8.5.9. Particle Counters Market - South Korea
- 8.5.9.1. South Korea: Particle Counters Market, by Type, 2018 - 2030 (USD Million)
- 8.5.9.2. South Korea.: Particle Counters Market, by End-Use, 2018 - 2030 (USD Million)
- 8.5.9.3. South Korea: Particle Counters Market, by Application, 2018 - 2030 (USD Million)
- 8.6. Particle Counters Market - Middle East & Africa
- 8.6.1. Middle East & Africa: Particle Counters Market, by Type, 2018 - 2030 (USD Million)
- 8.6.2. Middle East & Africa.: Particle Counters Market, by End-Use, 2018 - 2030 (USD Million)
- 8.6.3. Middle East & Africa: Particle Counters Market, by Application, 2018 - 2030 (USD Million)
- 8.6.4. Particle Counters Market - Saudi Arabia
- 8.6.4.1. Saudi Arabia: Particle Counters Market, by Type, 2018 - 2030 (USD Million)
- 8.6.4.2. Saudi Arabia.: Particle Counters Market, by End-Use, 2018 - 2030 (USD Million)
- 8.6.4.3. Saudi Arabia: Particle Counters Market, by Application, 2018 - 2030 (USD Million)
- 8.6.5. Particle Counters Market - UAE
- 8.6.5.1. UAE: Particle Counters Market, by Type, 2018 - 2030 (USD Million)
- 8.6.5.2. UAE.: Particle Counters Market, by End-Use, 2018 - 2030 (USD Million)
- 8.6.5.3. UAE: Particle Counters Market, by Application, 2018 - 2030 (USD Million)
- 8.6.6. Particle Counters Market - Israel
- 8.6.6.1. Israel: Particle Counters Market, by Type, 2018 - 2030 (USD Million)
- 8.6.6.2. Israel.: Particle Counters Market, by End-Use, 2018 - 2030 (USD Million)
- 8.6.6.3. Israel: Particle Counters Market, by Application, 2018 - 2030 (USD Million)
- 8.6.7. Particle Counters Market - South Africa
- 8.6.7.1. South Africa: Particle Counters Market, by Type, 2018 - 2030 (USD Million)
- 8.6.7.2. South Africa.: Particle Counters Market, by End-Use, 2018 - 2030 (USD Million)
- 8.6.7.3. South Africa: Particle Counters Market, by Application, 2018 - 2030 (USD Million)
- 8.7. Particle Counters Market - Latin America
- 8.7.1. Latin America: Particle Counters Market, by Type, 2018 - 2030 (USD Million)
- 8.7.2. Latin America.: Particle Counters Market, by End-Use, 2018 - 2030 (USD Million)
- 8.7.3. Latin America: Particle Counters Market, by Application, 2018 - 2030 (USD Million)
- 8.7.4. Particle Counters Market - Mexico
- 8.7.4.1. Mexico: Particle Counters Market, by Type, 2018 - 2030 (USD Million)
- 8.7.4.2. Mexico.: Particle Counters Market, by End-Use, 2018 - 2030 (USD Million)
- 8.7.4.3. Mexico: Particle Counters Market, by Application, 2018 - 2030 (USD Million)
- 8.7.5. Particle Counters Market - Brazil
- 8.7.5.1. Brazil: Particle Counters Market, by Type, 2018 - 2030 (USD Million)
- 8.7.5.2. Brazil.: Particle Counters Market, by End-Use, 2018 - 2030 (USD Million)
- 8.7.5.3. Brazil: Particle Counters Market, by Application, 2018 - 2030 (USD Million)
- 8.7.6. Particle Counters Market - Argentina
- 8.7.6.1. Argentina: Particle Counters Market, by Type, 2018 - 2030 (USD Million)
- 8.7.6.2. Argentina.: Particle Counters Market, by End-Use, 2018 - 2030 (USD Million)
- 8.7.6.3. Argentina: Particle Counters Market, by Application, 2018 - 2030 (USD Million)
9. Competitive Landscape
- 9.1. Expansion and Acquisition Analysis
- 9.1.1. Expansion
- 9.1.2. Acquisitions
- 9.2. Partnerships/Collaborations/Agreements/Exhibitions
10. Company Profiles
- 10.1. Beckman Coulter
- 10.1.1. Company Overview
- 10.1.2. Financial Performance
- 10.1.3. Product Benchmarking
- 10.1.4. Recent Development
- 10.2. Climet Instruments
- 10.2.1. Company Overview
- 10.2.2. Financial Performance
- 10.2.3. Product Benchmarking
- 10.2.4. Recent Development
- 10.3. Chemtrac Corp
- 10.3.1. Company Overview
- 10.3.2. Financial Performance
- 10.3.3. Product Benchmarking
- 10.3.4. Recent Development
- 10.4. Extech Instruments
- 10.4.1. Company Overview
- 10.4.2. Financial Performance
- 10.4.3. Product Benchmarking
- 10.4.4. Recent Development
- 10.5. Fluke Corporation
- 10.5.1. Company Overview
- 10.5.2. Financial Performance
- 10.5.3. Product Benchmarking
- 10.5.4. Recent Development
- 10.6. GrayWolf Sensing Solutions
- 10.6.1. Company Overview
- 10.6.2. Financial Performance
- 10.6.3. Product Benchmarking
- 10.6.4. Recent Development
- 10.7. Hal Technology
- 10.7.1. Company Overview
- 10.7.2. Financial Performance
- 10.7.3. Product Benchmarking
- 10.7.4. Recent Development
- 10.8. Konamax Corporation
- 10.8.1. Company Overview
- 10.8.2. Financial Performance
- 10.8.3. Product Benchmarking
- 10.8.4. Recent Development
- 10.9. Lighthouse Worldwide Solutions
- 10.9.1. Company Overview
- 10.9.2. Financial Performance
- 10.9.3. Product Benchmarking
- 10.9.4. Recent Development
- 10.10. Met One Instruments
- 10.10.1. Company Overview
- 10.10.2. Financial Performance
- 10.10.3. Product Benchmarking
- 10.10.4. Recent Development
- 10.11. Particle Measuring Systems
- 10.11.1. Company Overview
- 10.11.2. Financial Performance
- 10.11.3. Product Benchmarking
- 10.11.4. Recent Development
- 10.12. PCE Instruments
- 10.12.1. Company Overview
- 10.12.2. Financial Performance
- 10.12.3. Product Benchmarking
- 10.12.4. Recent Development
- 10.13. Palas
- 10.13.1. Company Overview
- 10.13.2. Financial Performance
- 10.13.3. Product Benchmarking
- 10.13.4. Recent Development
- 10.14. PAMAS
- 10.14.1. Company Overview
- 10.14.2. Financial Performance
- 10.14.3. Product Benchmarking
- 10.14.4. Recent Development
- 10.15. Particle Plus Corp
- 10.15.1. Company Overview
- 10.15.2. Financial Performance
- 10.15.3. Product Benchmarking
- 10.15.4. Recent Development
- 10.16. RION
- 10.16.1. Company Overview
- 10.16.2. Financial Performance
- 10.16.3. Product Benchmarking
- 10.16.4. Recent Development
- 10.17. Setra Systems
- 10.17.1. Company Overview
- 10.17.2. Financial Performance
- 10.17.3. Product Benchmarking
- 10.17.4. Recent Development
- 10.18. TSI Inc
- 10.18.1. Company Overview
- 10.18.2. Financial Performance
- 10.18.3. Product Benchmarking
- 10.18.4. Recent Development
- 10.19. Veltek Associates
- 10.19.1. Company Overview
- 10.19.2. Financial Performance
- 10.19.3. Product Benchmarking
- 10.19.4. Recent Development