|
|
市場調査レポート
商品コード
1175511
家庭用ロボットの世界市場(2022年~2030年):市場シェア、規模、動向、業界分析、提供別、タイプ別、流通チャネル別、用途別、地域別、セグメント予測Household Robots Market Share, Size, Trends, Industry Analysis Report, By Offering (Product, Services); By Type; By Distribution Channel (Online, Offline); By Application; By Region; Segment Forecast, 2022-2030 |
||||||
|
|
|||||||
|
● お客様のご希望に応じて、既存データの加工や未掲載情報(例:国別セグメント)の追加などの対応が可能です。 詳細はお問い合わせください。 |
|||||||


| 家庭用ロボットの世界市場(2022年~2030年):市場シェア、規模、動向、業界分析、提供別、タイプ別、流通チャネル別、用途別、地域別、セグメント予測 |
|
出版日: 2022年11月01日
発行: Polaris Market Research
ページ情報: 英文 117 Pages
納期: 即日から翌営業日
|
- 全表示
- 概要
- 図表
- 目次
世界の家庭用ロボットの市場規模は、2030年までに319億9,000万米ドルに達すると予想されています。
当レポートでは、世界の家庭用ロボット市場を調査し、市場の概要、市場の促進要因・抑制要因の分析、市場機会、COVID-19の影響、セグメント別の市場分析、競合情勢、主要企業のプロファイルなど、体系的な情報を提供しています。
目次
第1章 イントロダクション
- レポートについて
- 調査目的
- 市場範囲
- 前提条件
- 利害関係者
第2章 エグゼクティブサマリー
- 市場のハイライト
第3章 調査手法
- 概要
- データマイニング
- データ情報源
- 一次情報源
- 二次情報源
第4章 世界の家庭用ロボット市場:洞察
- 業界のスナップショット
- 市場力学
- 促進要因と機会
- 抑制要因と課題
- ポーターのファイブフォース分析
- 供給企業の交渉力(中)
- 新規参入者の脅威(低)
- 買い手の交渉力(中)
- 代替の脅威(中)
- 既存企業間の競争(高)
- PESTLE分析
- 業界の動向
- バリューチェーン分析
- COVID-19の影響分析
第5章 世界の家庭用ロボット市場:用途別
- 主な調査結果
- イントロダクション
- 用途別の世界市場(2018年~2030年)
- 掃除機がけ
- 掃除機がけ別、地域別
- 芝刈り
- 芝刈り別、地域別
- プール清掃
- プール清掃別、地域別
- コンパニオンシップ
- コンパニオンシップ別、地域別
- 高齢者支援・ハンディキャップ支援
- 高齢者支援・ハンディキャップ支援別、地域別
- ロボット玩具・ホビーシステム
- ロボット玩具・ホビーシステム別、地域別
- その他
- その他別、地域別
第6章 世界の家庭用ロボット市場:提供別
- 主な調査結果
- イントロダクション
- 提供別の世界市場(2018年~2030年)
- 製品
- 製品別、地域別
- サービス
- サービス別、地域別
第7章 世界の家庭用ロボット市場:タイプ別
- 主な調査結果
- イントロダクション
- タイプ別の世界市場(2018年~2030年)
- 家庭内
- 家庭内別、地域別
- 娯楽・レジャー
- 娯楽・レジャー別、地域別
第8章 世界の家庭用ロボット市場:流通チャネル別
- 主な調査結果
- イントロダクション
- 流通チャネル別の世界市場(2018年~2030年)
- オンラインチャネル
- オンラインチャネル別、地域別
- オフラインチャネル
- オフラインチャネル別、地域別
第9章 世界の家庭用ロボット市場:地域別
- 主な調査結果
- イントロダクション
- 家庭用ロボット市場の評価:地域別(2018年~2030年)
- 北米
- 用途別
- 流通チャネル別
- 提供別
- タイプ別
- 米国
- カナダ
- 欧州
- 用途別
- 流通チャネル別
- 提供別
- タイプ別
- 英国
- フランス
- ドイツ
- イタリア
- スペイン
- オランダ
- ロシア
- アジア太平洋地域
- 用途別
- 流通チャネル別
- 提供別
- タイプ別
- 中国
- インド
- 日本
- マレーシア
- インドネシア
- 韓国
- 中東・アフリカ
- 用途別
- 流通チャネル別
- 提供別
- タイプ別
- サウジアラビア
- 南アフリカ
- イスラエル
- アラブ首長国連邦
- ラテンアメリカ
- 用途別
- 流通チャネル別
- 提供別
- タイプ別
- メキシコ
- ブラジル
- アルゼンチン
第10章 競合情勢
- 拡張と買収の分析
- 拡張
- 買収
- パートナーシップ/コラボレーション/協定/展示会
第11章 企業プロファイル
- AIRROBO
- Alfred Karcher
- SE & Co.KG
- Blue Grog Robotics, Inc
- Bobsweep Inc
- BSH Hausgerate
- Dyson Ltd
- Ecovacs Robotics, Inc
- Husqvarna Group
- iLIFE Innovation Ltd
- Intuitive Surgical Inc
- iRobot Corporation
- John Deere
- Lego
- LG Electronics Inc
- Maytronics Ltd
- Miele
- Neato Robotics, Inc
- Panasonic Corporation
- Robomow
- Roborock Technology Co. Ltd
- Samsung Electronics Co. Ltd
- SharkNinja Operating LLC
List of Tables
- Table 1 Global Household Robots Market, by Application, by Region, 2018 - 2030 (USD Billion)
- Table 2 Global Household Robots Market, by Offering, by Region, 2018 - 2030 (USD Billion)
- Table 3 Global Household Robots Market, by Type, by Region, 2018 - 2030 (USD Billion)
- Table 4 Global Household Robots Market, by Distribution Channel, by Region, 2018 - 2030 (USD Billion)
- Table 5 Household Robots Market Assessment, By Geography, 2018 - 2030 (USD Billion)
- Table 6 North America: Household Robots Market, by Application, 2018 - 2030 (USD Billion)
- Table 7 North America: Household Robots Market, by Offering, 2018 - 2030 (USD Billion)
- Table 8 North America: Household Robots Market, by Type, 2018 - 2030 (USD Billion)
- Table 9 North America: Household Robots Market, by Distribution Channel, 2018 - 2030 (USD Billion)
- Table 10 U.S.: Household Robots Market, by Application, 2018 - 2030 (USD Billion)
- Table 11 U.S.: Household Robots Market, by Offering, 2018 - 2030 (USD Billion)
- Table 12 U.S.: Household Robots Market, by Type, 2018 - 2030 (USD Billion)
- Table 13 U.S.: Household Robots Market, by Distribution Channel, 2018 - 2030 (USD Billion)
- Table 14 Canada: Household Robots Market, by Application, 2018 - 2030 (USD Billion)
- Table 15 Canada: Household Robots Market, by Offering, 2018 - 2030 (USD Billion)
- Table 16 Canada: Household Robots Market, by Type, 2018 - 2030 (USD Billion)
- Table 17 Canada: Household Robots Market, by Distribution Channel, 2018 - 2030 (USD Billion)
- Table 18 Europe: Household Robots Market, by Application, 2018 - 2030 (USD Billion)
- Table 19 Europe: Household Robots Market, by Offering, 2018 - 2030 (USD Billion)
- Table 20 Europe: Household Robots Market, by Type, 2018 - 2030 (USD Billion)
- Table 21 Europe: Household Robots Market, by Distribution Channel, 2018 - 2030 (USD Billion)
- Table 22 Germany: Household Robots Market, by Application, 2018 - 2030 (USD Billion)
- Table 23 Germany: Household Robots Market, by Offering, 2018 - 2030 (USD Billion)
- Table 24 Germany: Household Robots Market, by Type, 2018 - 2030 (USD Billion)
- Table 25 Germany: Household Robots Market, by Distribution Channel, 2018 - 2030 (USD Billion)
- Table 26 France: Household Robots Market, by Application, 2018 - 2030 (USD Billion)
- Table 27 France: Household Robots Market, by Offering, 2018 - 2030 (USD Billion)
- Table 28 France: Household Robots Market, by Type, 2018 - 2030 (USD Billion)
- Table 29 France: Household Robots Market, by Distribution Channel, 2018 - 2030 (USD Billion)
- Table 30 UK: Household Robots Market, by Application, 2018 - 2030 (USD Billion)
- Table 31 UK: Household Robots Market, by Offering, 2018 - 2030 (USD Billion)
- Table 32 UK: Household Robots Market, by Type, 2018 - 2030 (USD Billion)
- Table 33 UK: Household Robots Market, by Distribution Channel, 2018 - 2030 (USD Billion)
- Table 34 Italy: Household Robots Market, by Application, 2018 - 2030 (USD Billion)
- Table 35 Italy: Household Robots Market, by Offering, 2018 - 2030 (USD Billion)
- Table 36 Italy: Household Robots Market, by Type, 2018 - 2030 (USD Billion)
- Table 37 Italy: Household Robots Market, by Distribution Channel, 2018 - 2030 (USD Billion)
- Table 38 Netherlands: Household Robots Market, by Application, 2018 - 2030 (USD Billion)
- Table 39 Netherlands: Household Robots Market, by Offering, 2018 - 2030 (USD Billion)
- Table 40 Netherlands: Household Robots Market, by Type, 2018 - 2030 (USD Billion)
- Table 41 Netherlands: Household Robots Market, by Distribution Channel, 2018 - 2030 (USD Billion)
- Table 42 Spain: Household Robots Market, by Application, 2018 - 2030 (USD Billion)
- Table 43 Spain: Household Robots Market, by Offering, 2018 - 2030 (USD Billion)
- Table 44 Spain: Household Robots Market, by Type, 2018 - 2030 (USD Billion)
- Table 45 Spain: Household Robots Market, by Distribution Channel, 2018 - 2030 (USD Billion)
- Table 46 Russia: Household Robots Market, by Application, 2018 - 2030 (USD Billion)
- Table 47 Russia: Household Robots Market, by Offering, 2018 - 2030 (USD Billion)
- Table 48 Russia: Household Robots Market, by Type, 2018 - 2030 (USD Billion)
- Table 49 Russia: Household Robots Market, by Distribution Channel, 2018 - 2030 (USD Billion)
- Table 50 Asia Pacific: Household Robots Market, by Application, 2018 - 2030 (USD Billion)
- Table 51 Asia Pacific: Household Robots Market, by Offering, 2018 - 2030 (USD Billion)
- Table 52 Asia Pacific: Household Robots Market, by Type, 2018 - 2030 (USD Billion)
- Table 53 Asia Pacific: Household Robots Market, by Distribution Channel, 2018 - 2030 (USD Billion)
- Table 54 China: Household Robots Market, by Application, 2018 - 2030 (USD Billion)
- Table 55 China: Household Robots Market, by Offering, 2018 - 2030 (USD Billion)
- Table 56 China: Household Robots Market, by Type, 2018 - 2030 (USD Billion)
- Table 57 China: Household Robots Market, by Distribution Channel, 2018 - 2030 (USD Billion)
- Table 58 Japan: Household Robots Market, by Application, 2018 - 2030 (USD Billion)
- Table 59 Japan: Household Robots Market, by Offering, 2018 - 2030 (USD Billion)
- Table 60 Japan: Household Robots Market, by Type, 2018 - 2030 (USD Billion)
- Table 61 Japan: Household Robots Market, by Distribution Channel, 2018 - 2030 (USD Billion)
- Table 62 India: Household Robots Market, by Application, 2018 - 2030 (USD Billion)
- Table 63 India: Household Robots Market, by Offering, 2018 - 2030 (USD Billion)
- Table 64 India: Household Robots Market, by Type, 2018 - 2030 (USD Billion)
- Table 65 India: Household Robots Market, by Distribution Channel, 2018 - 2030 (USD Billion)
- Table 66 Indonesia: Household Robots Market, by Application, 2018 - 2030 (USD Billion)
- Table 67 Indonesia: Household Robots Market, by Offering, 2018 - 2030 (USD Billion)
- Table 68 Indonesia: Household Robots Market, by Type, 2018 - 2030 (USD Billion)
- Table 69 Indonesia: Household Robots Market, by Distribution Channel, 2018 - 2030 (USD Billion)
- Table 70 Malaysia: Household Robots Market, by Application, 2018 - 2030 (USD Billion)
- Table 71 Malaysia: Household Robots Market, by Offering, 2018 - 2030 (USD Billion)
- Table 72 Malaysia: Household Robots Market, by Type, 2018 - 2030 (USD Billion)
- Table 73 Malaysia: Household Robots Market, by Distribution Channel, 2018 - 2030 (USD Billion)
- Table 74 South Korea: Household Robots Market, by Application, 2018 - 2030 (USD Billion)
- Table 75 South Korea: Household Robots Market, by Offering, 2018 - 2030 (USD Billion)
- Table 76 South Korea: Household Robots Market, by Type, 2018 - 2030 (USD Billion)
- Table 77 South Korea: Household Robots Market, by Distribution Channel, 2018 - 2030 (USD Billion)
- Table 78 Latin America: Household Robots Market, by Application, 2018 - 2030 (USD Billion)
- Table 79 Latin America: Household Robots Market, by Offering, 2018 - 2030 (USD Billion)
- Table 80 Latin America: Household Robots Market, by Type, 2018 - 2030 (USD Billion)
- Table 81 Latin America: Household Robots Market, by Distribution Channel, 2018 - 2030 (USD Billion)
- Table 82 Brazil: Household Robots Market, by Application, 2018 - 2030 (USD Billion)
- Table 83 Brazil: Household Robots Market, by Offering, 2018 - 2030 (USD Billion)
- Table 84 Brazil: Household Robots Market, by Type, 2018 - 2030 (USD Billion)
- Table 85 Brazil: Household Robots Market, by Distribution Channel, 2018 - 2030 (USD Billion)
- Table 86 Mexico: Household Robots Market, by Application, 2018 - 2030 (USD Billion)
- Table 87 Mexico: Household Robots Market, by Offering, 2018 - 2030 (USD Billion)
- Table 88 Mexico: Household Robots Market, by Type, 2018 - 2030 (USD Billion)
- Table 89 Mexico: Household Robots Market, by Distribution Channel, 2018 - 2030 (USD Billion)
- Table 90 Argentina: Household Robots Market, by Application, 2018 - 2030 (USD Billion)
- Table 91 Argentina: Household Robots Market, by Offering, 2018 - 2030 (USD Billion)
- Table 92 Argentina: Household Robots Market, by Type, 2018 - 2030 (USD Billion)
- Table 93 Argentina: Household Robots Market, by Distribution Channel, 2018 - 2030 (USD Billion)
- Table 94 Middle East & Africa: Household Robots Market, by Application, 2018 - 2030 (USD Billion)
- Table 95 Middle East & Africa: Household Robots Market, by Offering, 2018 - 2030 (USD Billion)
- Table 96 Middle East & Africa: Household Robots Market, by Type, 2018 - 2030 (USD Billion)
- Table 97 Middle East & Africa: Household Robots Market, by Distribution Channel, 2018 - 2030 (USD Billion)
- Table 98 UAE: Household Robots Market, by Application, 2018 - 2030 (USD Billion)
- Table 99 UAE: Household Robots Market, by Offering, 2018 - 2030 (USD Billion)
- Table 100 UAE: Household Robots Market, by Type, 2018 - 2030 (USD Billion)
- Table 101 UAE: Household Robots Market, by Distribution Channel, 2018 - 2030 (USD Billion)
- Table 102 Saudi Arabia: Household Robots Market, by Application, 2018 - 2030 (USD Billion)
- Table 103 Saudi Arabia: Household Robots Market, by Offering, 2018 - 2030 (USD Billion)
- Table 104 Saudi Arabia: Household Robots Market, by Type, 2018 - 2030 (USD Billion)
- Table 105 Saudi Arabia: Household Robots Market, by Distribution Channel, 2018 - 2030 (USD Billion)
- Table 106 South Africa: Household Robots Market, by Application, 2018 - 2030 (USD Billion)
- Table 107 South Africa: Household Robots Market, by Offering, 2018 - 2030 (USD Billion)
- Table 108 South Africa: Household Robots Market, by Type, 2018 - 2030 (USD Billion)
- Table 109 South Africa: Household Robots Market, by Distribution Channel, 2018 - 2030 (USD Billion)
- Table 110 Israel: Household Robots Market, by Application, 2018 - 2030 (USD Billion)
- Table 111 Israel: Household Robots Market, by Offering, 2018 - 2030 (USD Billion)
- Table 112 Israel: Household Robots Market, by Type, 2018 - 2030 (USD Billion)
- Table 113 Israel: Household Robots Market, by Distribution Channel, 2018 - 2030 (USD Billion)
List of Figures
Figure 1. Global Household Robots Market, 2018 - 2030 (USD Billion)
Figure 2. Integrated Ecosystem
Figure 3. Research Methodology: Top-Down & Bottom-Up Distribution Channel
Figure 4. Market by Geography
Figure 5. Porter's Five Forces
Figure 6. Market by Application
Figure 7. Global Household Robots Market, by Application, 2021 & 2030 (USD Billion)
Figure 8. Market by Distribution Channel
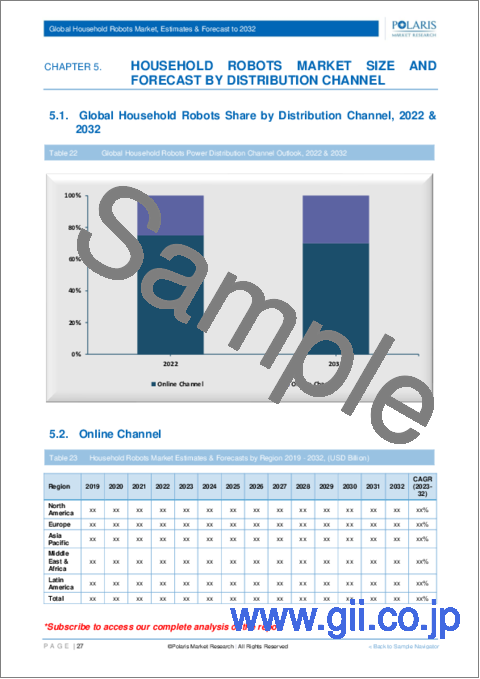
Figure 9. Global Household Robots Market, by Distribution Channel, 2021 & 2030 (USD Billion)
Figure 10. Market by Offering
Figure 11. Global Household Robots Market, by Offering, 2021 & 2030 (USD Billion)
Figure 12. Market by Type
Figure 13. Global Household Robots Market, by Type, 2021 & 2030 (USD Billion)
Figure 14. Household Robots Market Assessment, By Geography, 2018 - 2030 (USD Billion)
Figure 15. Strategic Analysis - Household Robots Market
The global household robots market size is expected to reach USD 31.99 billion by 2030, according to a new study by Polaris Market Research. The report "Household Robots Market Share, Size, Trends, Industry Analysis Report, By Offering (Product, Services); By Type; By Distribution Channel (Online, Offline); By Application; By Region; Segment Forecast, 2022-2030" gives a detailed insight into current market dynamics and provides an analysis of future market growth.
The growing demand for the product in the commercial sector for pool cleaning, mopping, lawn mowing, and many more household chores is expected to drive market growth. Furthermore, increasing penetration of automation robots to perform a dangerous and difficult task is expected to boost the market.
In addition, technological advancement in robotics to develop robots that are capable of interacting, cognitive in nature, and could be manipulated in action are increasing the demand for household robots. Moreover, R&D investment by many key players to create innovative robots equipped with AI features with 2D and 3D vision cameras to map the house and recognize impediments, if any, are driving the market growth.
The COVID-19 pandemic had a negative impact on the demand for household robots as many residential and commercial projects came to a standstill owing to global lockdowns. In addition, the lack of raw materials movement due to strict government norms resulted in a delay in the production of robot components which hampered the market growth.
Household Robots Market Report Highlights
The growing demand for domestic robots is due to busy lifestyles and the increasing adoption of automation devices. In addition, these robots are convenient, save time, and have better companionship, which drives segment growth.
The online distribution channel is expected to dominate the market over the forecast period as they allow smooth delivery of products, and the consumer doesn't have to bear any levied expenses.
The vacuuming robot type is expected to spearhead revenue growth as it cleans all levels of dirt and works on all surfaces. Moreover, the increasing aging and handicapped population is an essential factor in driving the segment's growth.
Asia Pacific is expected to grow over the forecast period on account of the increasing adoption of robotic technology across China, Japan, and India. The growing geriatric population and rising R&D investment in developing innovative robots are propelling market growth.
Major players operating in the industry include Alfred Karcher, SE & Co.KG, Blue Grog Robotics, Inc., Bobsweep Inc., BSH Hausgerate, Dyson Ltd, Ecovacs Robotics, Inc, Husqvarna Group, iLIFE Innovation Ltd, Intuitive Surgical Inc., iRobot Corporation.
Polaris Market Research has segmented the household robots market report based on offering, type, distribution channel, application, and region:
Household Robots, Offering Outlook (Revenue - USD Billion, 2018 - 2030)
Product
Services
Household Robots, Type Outlook (Revenue - USD Billion, 2018 - 2030)
Domestic
Entertainment And Leisure
Household Robots, Distribution Channel Outlook (Revenue - USD Billion, 2018 - 2030)
Online Channel
Offline Channel
Household Robots, Applications Outlook (Revenue - USD Billion, 2018 - 2030)
Vacuuming
Lawn Mowing
Pool Cleaning
Companionship
Elderly Assistance and Handicap Assistance
Robot Toys and Hobby Systems
Others
Household Robots, Regional Outlook (Revenue - USD Billion, 2018 - 2030)
North America
U.S
Canada
Europe
Germany
UK
France
Italy
Spain
Russia
Netherlands
Asia Pacific
China
India
Japan
South Korea
Indonesia
Malaysia
Latin America
Argentina
Brazil
Mexico
Middle East & Africa
UAE
Saudi Arabia
Israel
South Africa
Table of Contents
1. Introduction
- 1.1. Report Description
- 1.1.1. Objectives of the Study
- 1.1.2. Market Scope
- 1.1.3. Assumptions
- 1.2. Stakeholders
2. Executive Summary
- 2.1. Market Highlights
3. Research Methodology
- 3.1. Overview
- 3.1.1. Data Mining
- 3.2. Data Sources
- 3.2.1. Primary Sources
- 3.2.2. Secondary Sources
4. Global Household Robots Market Insights
- 4.1. Household Robots - Industry Snapshot
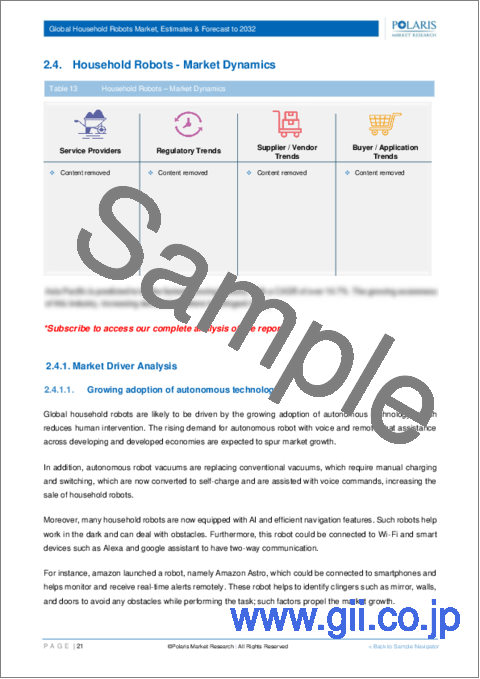
- 4.2. Household Robots Market Dynamics
- 4.2.1. Drivers and Opportunities
- 4.2.1.1. Growing adoption of autonomous technology
- 4.2.1.2. Increasing government initiatives for development of robotic technologies
- 4.2.2. Restraints and Challenges
- 4.2.2.1. Data protection regulation
- 4.2.1. Drivers and Opportunities
- 4.3. Porter's Five Forces Analysis
- 4.3.1. Bargaining Power of Suppliers (Moderate)
- 4.3.2. Threats of New Entrants: (Low)
- 4.3.3. Bargaining Power of Buyers (Moderate)
- 4.3.4. Threat of Substitute (Moderate)
- 4.3.5. Rivalry among existing firms (High)
- 4.4. PESTLE Analysis
- 4.5. Household Robots Industry Trends
- 4.6. Value Chain Analysis
- 4.7. COVID-19 Impact Analysis
5. Global Household Robots Market, by Application
- 5.1. Key Findings
- 5.2. Introduction
- 5.2.1. Global Household Robots Market, by Application, 2018 - 2030 (USD Billion)
- 5.3. Vacuuming
- 5.3.1. Global Household Robots Market, by Vacuuming, by Region, 2018 - 2030 (USD Billion)
- 5.4. Lawn Mowing
- 5.4.1. Global Household Robots Market, by Lawn Mowing, by Region, 2018 - 2030 (USD Billion)
- 5.5. Pool Cleaning
- 5.5.1. Global Household Robots Market, by Pool Cleaning, by Region, 2018 - 2030 (USD Billion)
- 5.6. Companionship
- 5.6.1. Global Household Robots Market, by Companionship, by Region, 2018 - 2030 (USD Billion)
- 5.7. Elderly Assistance and Handicap Assistance
- 5.7.1. Global Household Robots Market, by Elderly Assistance and Handicap Assistance, by Region, 2018 - 2030 (USD Billion)
- 5.8. Robot Toys and Hobby Systems
- 5.8.1. Global Household Robots Market, by Robot Toys and Hobby Systems, by Region, 2018 - 2030 (USD Billion)
- 5.9. Others
- 5.9.1. Global Household Robots Market, by Other Applications, by Region, 2018 - 2030 (USD Billion)
6. Global Household Robots Market, by Offering
- 6.1. Key Findings
- 6.2. Introduction
- 6.2.1. Global Household Robots Market, by Offering, 2018 - 2030 (USD Billion)
- 6.3. Product
- 6.3.1. Global Household Robots Market, by Product, by Region, 2018 - 2030 (USD Billion)
- 6.4. Services
- 6.4.1. Global Household Robots Market, by Services, by Region, 2018 - 2030 (USD Billion)
7. Global Household Robots Market, by Type
- 7.1. Key Findings
- 7.2. Introduction
- 7.2.1. Global Household Robots Market, by Type, 2018 - 2030 (USD Billion)
- 7.3. Domestic
- 7.3.1. Global Household Robots Market, by Domestic, by Region, 2018 - 2030 (USD Billion)
- 7.4. Entertainment And Leisure
- 7.4.1. Global Household Robots Market, by Entertainment And Leisure, by Region, 2018 - 2030 (USD Billion)
8. Global Household Robots Market, by Distribution Channel
- 8.1. Key Findings
- 8.2. Introduction
- 8.2.1. Global Household Robots Market, by Distribution Channel, 2018 - 2030 (USD Billion)
- 8.3. Online Channel
- 8.3.1. Global Household Robots Market, by Online Channel, by Region, 2018 - 2030 (USD Billion)
- 8.4. Offline Channel
- 8.4.1. Global Household Robots Market, by Offline Channel, by Region, 2018 - 2030 (USD Billion)
9. Global Household Robots Market, by Geography
- 9.1. Key findings
- 9.2. Introduction
- 9.2.1. Household Robots Market Assessment, By Geography, 2018 - 2030 (USD Billion)
- 9.3. Household Robots Market - North America
- 9.3.1. North America: Household Robots Market, by Application, 2018 - 2030 (USD Billion)
- 9.3.2. North America: Household Robots Market, by Distribution Channel, 2018 - 2030 (USD Billion)
- 9.3.3. North America: Household Robots Market, by Offering, 2018 - 2030 (USD Billion)
- 9.3.4. North America: Household Robots Market, by Type, 2018 - 2030 (USD Billion)
- 9.3.5. Household Robots Market - U.S.
- 9.3.5.1. U.S.: Household Robots Market, by Application, 2018 - 2030 (USD Billion)
- 9.3.5.2. U.S.: Household Robots Market, by Distribution Channel, 2018 - 2030 (USD Billion)
- 9.3.5.3. U.S.: Household Robots Market, by Offering, 2018 - 2030 (USD Billion)
- 9.3.5.4. U.S.: Household Robots Market, by Type, 2018 - 2030 (USD Billion)
- 9.3.6. Household Robots Market - Canada
- 9.3.6.1. Canada: Household Robots Market, by Application, 2018 - 2030 (USD Billion)
- 9.3.6.2. Canada: Household Robots Market, by Distribution Channel, 2018 - 2030 (USD Billion)
- 9.3.6.3. Canada: Household Robots Market, by Offering, 2018 - 2030 (USD Billion)
- 9.3.6.4. Canada: Household Robots Market, by Type, 2018 - 2030 (USD Billion)
- 9.4. Household Robots Market - Europe
- 9.4.1. Europe: Household Robots Market, by Application, 2018 - 2030 (USD Billion)
- 9.4.2. Europe: Household Robots Market, by Distribution Channel, 2018 - 2030 (USD Billion)
- 9.4.3. Europe: Household Robots Market, by Offering, 2018 - 2030 (USD Billion)
- 9.4.4. Europe: Household Robots Market, by Type, 2018 - 2030 (USD Billion)
- 9.4.5. Household Robots Market - UK
- 9.4.5.1. UK: Household Robots Market, by Application, 2018 - 2030 (USD Billion)
- 9.4.5.2. UK: Household Robots Market, by Distribution Channel, 2018 - 2030 (USD Billion)
- 9.4.5.3. UK: Household Robots Market, by Offering, 2018 - 2030 (USD Billion)
- 9.4.5.4. UK: Household Robots Market, by Type, 2018 - 2030 (USD Billion)
- 9.4.6. Household Robots Market - France
- 9.4.6.1. France: Household Robots Market, by Application, 2018 - 2030 (USD Billion)
- 9.4.6.2. France: Household Robots Market, by Distribution Channel, 2018 - 2030 (USD Billion)
- 9.4.6.3. France: Household Robots Market, by Offering, 2018 - 2030 (USD Billion)
- 9.4.6.4. France: Household Robots Market, by Type, 2018 - 2030 (USD Billion)
- 9.4.7. Household Robots Market - Germany
- 9.4.7.1. Germany: Household Robots Market, by Application, 2018 - 2030 (USD Billion)
- 9.4.7.2. Germany: Household Robots Market, by Distribution Channel, 2018 - 2030 (USD Billion)
- 9.4.7.3. Germany: Household Robots Market, by Offering, 2018 - 2030 (USD Billion)
- 9.4.7.4. Germany: Household Robots Market, by Type, 2018 - 2030 (USD Billion)
- 9.4.8. Household Robots Market - Italy
- 9.4.8.1. Italy: Household Robots Market, by Application, 2018 - 2030 (USD Billion)
- 9.4.8.2. Italy: Household Robots Market, by Distribution Channel, 2018 - 2030 (USD Billion)
- 9.4.8.3. Italy: Household Robots Market, by Offering, 2018 - 2030 (USD Billion)
- 9.4.8.4. Italy: Household Robots Market, by Type, 2018 - 2030 (USD Billion)
- 9.4.9. Household Robots Market - Spain
- 9.4.9.1. Spain: Household Robots Market, by Application, 2018 - 2030 (USD Billion)
- 9.4.9.2. Spain: Household Robots Market, by Distribution Channel, 2018 - 2030 (USD Billion)
- 9.4.9.3. Spain: Household Robots Market, by Offering, 2018 - 2030 (USD Billion)
- 9.4.9.4. Spain: Household Robots Market, by Type, 2018 - 2030 (USD Billion)
- 9.4.10. Household Robots Market - Netherlands
- 9.4.10.1. Netherlands: Household Robots Market, by Application, 2018 - 2030 (USD Billion)
- 9.4.10.2. Netherlands: Household Robots Market, by Distribution Channel, 2018 - 2030 (USD Billion)
- 9.4.10.3. Netherlands: Household Robots Market, by Offering, 2018 - 2030 (USD Billion)
- 9.4.10.4. Netherlands: Household Robots Market, by Type, 2018 - 2030 (USD Billion)
- 9.4.11. Household Robots Market - Russia
- 9.4.11.1. Russia: Household Robots Market, by Application, 2018 - 2030 (USD Billion)
- 9.4.11.2. Russia.: Household Robots Market, by Distribution Channel, 2018 - 2030 (USD Billion)
- 9.4.11.3. Russia: Household Robots Market, by Offering, 2018 - 2030 (USD Billion)
- 9.4.11.4. Russia: Household Robots Market, by Type, 2018 - 2030 (USD Billion)
- 9.5. Household Robots Market - Asia Pacific
- 9.5.1. Asia Pacific: Household Robots Market, by Application, 2018 - 2030 (USD Billion)
- 9.5.2. Asia Pacific: Household Robots Market, by Distribution Channel, 2018 - 2030 (USD Billion)
- 9.5.3. Asia Pacific: Household Robots Market, by Offering, 2018 - 2030 (USD Billion)
- 9.5.4. Asia Pacific: Household Robots Market, by Type, 2018 - 2030 (USD Billion)
- 9.5.5. Household Robots Market - China
- 9.5.5.1. China: Household Robots Market, by Application, 2018 - 2030 (USD Billion)
- 9.5.5.2. China.: Household Robots Market, by Distribution Channel, 2018 - 2030 (USD Billion)
- 9.5.5.3. China: Household Robots Market, by Offering, 2018 - 2030 (USD Billion)
- 9.5.5.4. China: Household Robots Market, by Type, 2018 - 2030 (USD Billion)
- 9.5.6. Household Robots Market - India
- 9.5.6.1. India: Household Robots Market, by Application, 2018 - 2030 (USD Billion)
- 9.5.6.2. India.: Household Robots Market, by Distribution Channel, 2018 - 2030 (USD Billion)
- 9.5.6.3. India: Household Robots Market, by Offering, 2018 - 2030 (USD Billion)
- 9.5.6.4. India: Household Robots Market, by Type, 2018 - 2030 (USD Billion)
- 9.5.7. Household Robots Market - Japan
- 9.5.7.1. Japan: Household Robots Market, by Application, 2018 - 2030 (USD Billion)
- 9.5.7.2. Japan.: Household Robots Market, by Distribution Channel, 2018 - 2030 (USD Billion)
- 9.5.7.3. Japan: Household Robots Market, by Offering, 2018 - 2030 (USD Billion)
- 9.5.7.4. Japan: Household Robots Market, by Type, 2018 - 2030 (USD Billion)
- 9.5.8. Household Robots Market - Malaysia
- 9.5.8.1. Malaysia: Household Robots Market, by Application, 2018 - 2030 (USD Billion)
- 9.5.8.2. Malaysia.: Household Robots Market, by Distribution Channel, 2018 - 2030 (USD Billion)
- 9.5.8.3. Malaysia: Household Robots Market, by Offering, 2018 - 2030 (USD Billion)
- 9.5.8.4. Malaysia: Household Robots Market, by Type, 2018 - 2030 (USD Billion)
- 9.5.9. Household Robots Market - Indonesia
- 9.5.9.1. Indonesia: Household Robots Market, by Application, 2018 - 2030 (USD Billion)
- 9.5.9.2. Indonesia.: Household Robots Market, by Distribution Channel, 2018 - 2030 (USD Billion)
- 9.5.9.3. Indonesia: Household Robots Market, by Offering, 2018 - 2030 (USD Billion)
- 9.5.9.4. Indonesia: Household Robots Market, by Type, 2018 - 2030 (USD Billion)
- 9.5.10. Household Robots Market - South Korea
- 9.5.10.1. South Korea: Household Robots Market, by Application, 2018 - 2030 (USD Billion)
- 9.5.10.2. South Korea.: Household Robots Market, by Distribution Channel, 2018 - 2030 (USD Billion)
- 9.5.10.3. South Korea: Household Robots Market, by Offering, 2018 - 2030 (USD Billion)
- 9.5.10.4. South Korea: Household Robots Market, by Type, 2018 - 2030 (USD Billion)
- 9.6. Household Robots Market - Middle East & Africa
- 9.6.1. Middle East & Africa: Household Robots Market, by Application, 2018 - 2030 (USD Billion)
- 9.6.2. Middle East & Africa: Household Robots Market, by Distribution Channel, 2018 - 2030 (USD Billion)
- 9.6.3. Middle East & Africa: Household Robots Market, by Offering, 2018 - 2030 (USD Billion)
- 9.6.4. Middle East & Africa: Household Robots Market, by Type, 2018 - 2030 (USD Billion)
- 9.6.5. Household Robots Market - Saudi Arabia
- 9.6.5.1. Saudi Arabia: Household Robots Market, by Application, 2018 - 2030 (USD Billion)
- 9.6.5.2. Saudi Arabia: Household Robots Market, by Distribution Channel, 2018 - 2030 (USD Billion)
- 9.6.5.3. Saudi Arabia: Household Robots Market, by Offering, 2018 - 2030 (USD Billion)
- 9.6.5.4. Saudi Arabia: Household Robots Market, by Type, 2018 - 2030 (USD Billion)
- 9.6.6. Household Robots Market - South Africa
- 9.6.6.1. South Africa: Household Robots Market, by Application, 2018 - 2030 (USD Billion)
- 9.6.6.2. South Africa: Household Robots Market, by Distribution Channel, 2018 - 2030 (USD Billion)
- 9.6.6.3. South Africa: Household Robots Market, by Offering, 2018 - 2030 (USD Billion)
- 9.6.6.4. South Africa: Household Robots Market, by Type, 2018 - 2030 (USD Billion)
- 9.6.7. Household Robots Market - Israel
- 9.6.7.1. Israel: Household Robots Market, by Application, 2018 - 2030 (USD Billion)
- 9.6.7.2. Israel: Household Robots Market, by Distribution Channel, 2018 - 2030 (USD Billion)
- 9.6.7.3. Israel: Household Robots Market, by Offering, 2018 - 2030 (USD Billion)
- 9.6.7.4. Israel: Household Robots Market, by Type, 2018 - 2030 (USD Billion)
- 9.6.8. Household Robots Market - UAE
- 9.6.8.1. UAE: Household Robots Market, by Application, 2018 - 2030 (USD Billion)
- 9.6.8.2. UAE: Household Robots Market, by Distribution Channel, 2018 - 2030 (USD Billion)
- 9.6.8.3. UAE: Household Robots Market, by Offering, 2018 - 2030 (USD Billion)
- 9.6.8.4. UAE: Household Robots Market, by Type, 2018 - 2030 (USD Billion)
- 9.7. Household Robots Market - Latin America
- 9.7.1. Latin America: Household Robots Market, by Application, 2018 - 2030 (USD Billion)
- 9.7.2. Latin America: Household Robots Market, by Distribution Channel, 2018 - 2030 (USD Billion)
- 9.7.3. Latin America: Household Robots Market, by Offering, 2018 - 2030 (USD Billion)
- 9.7.4. Latin America: Household Robots Market, by Type, 2018 - 2030 (USD Billion)
- 9.7.5. Household Robots Market - Mexico
- 9.7.5.1. Mexico: Household Robots Market, by Application, 2018 - 2030 (USD Billion)
- 9.7.5.2. Mexico: Household Robots Market, by Distribution Channel, 2018 - 2030 (USD Billion)
- 9.7.5.3. Mexico: Household Robots Market, by Offering, 2018 - 2030 (USD Billion)
- 9.7.5.4. Mexico: Household Robots Market, by Type, 2018 - 2030 (USD Billion)
- 9.7.6. Household Robots Market - Brazil
- 9.7.6.1. Brazil: Household Robots Market, by Application, 2018 - 2030 (USD Billion)
- 9.7.6.2. Brazil: Household Robots Market, by Distribution Channel, 2018 - 2030 (USD Billion)
- 9.7.6.3. Brazil: Household Robots Market, by Offering, 2018 - 2030 (USD Billion)
- 9.7.6.4. Brazil: Household Robots Market, by Type, 2018 - 2030 (USD Billion)
- 9.7.7. Household Robots Market - Argentina
- 9.7.7.1. Argentina: Household Robots Market, by Application, 2018 - 2030 (USD Billion)
- 9.7.7.2. Argentina: Household Robots Market, by Distribution Channel, 2018 - 2030 (USD Billion)
- 9.7.7.3. Argentina: Household Robots Market, by Offering, 2018 - 2030 (USD Billion)
- 9.7.7.4. Argentina: Household Robots Market, by Type, 2018 - 2030 (USD Billion)
10. Competitive Landscape
- 10.1. Expansion and Acquisition Analysis
- 10.1.1. Expansion
- 10.1.2. Acquisitions
- 10.2. Partnerships/Collaborations/Agreements/Exhibitions
11. Company Profiles
- 11.1. AIRROBO
- 11.1.1. Company Overview
- 11.1.2. Financial Performance
- 11.1.3. Product Benchmarking
- 11.1.4. Recent Development
- 11.2. Alfred Karcher
- 11.2.1. Company Overview
- 11.2.2. Financial Performance
- 11.2.3. Product Benchmarking
- 11.2.4. Recent Development
- 11.3. SE & Co.KG
- 11.3.1. Company Overview
- 11.3.2. Financial Performance
- 11.3.3. Product Benchmarking
- 11.3.4. Recent Development
- 11.4. Blue Grog Robotics, Inc
- 11.4.1. Company Overview
- 11.4.2. Financial Performance
- 11.4.3. Product Benchmarking
- 11.4.4. Recent Development
- 11.5. Bobsweep Inc
- 11.5.1. Company Overview
- 11.5.2. Financial Performance
- 11.5.3. Product Benchmarking
- 11.5.4. Recent Development
- 11.6. BSH Hausgerate
- 11.6.1. Company Overview
- 11.6.2. Financial Performance
- 11.6.3. Product Benchmarking
- 11.6.4. Recent Development
- 11.7. Dyson Ltd
- 11.7.1. Company Overview
- 11.7.2. Financial Performance
- 11.7.3. Product Benchmarking
- 11.7.4. Recent Development
- 11.8. Ecovacs Robotics, Inc
- 11.8.1. Company Overview
- 11.8.2. Financial Performance
- 11.8.3. Product Benchmarking
- 11.8.4. Recent Development
- 11.9. Husqvarna Group
- 11.9.1. Company Overview
- 11.9.2. Financial Performance
- 11.9.3. Product Benchmarking
- 11.9.4. Recent Development
- 11.10. iLIFE Innovation Ltd
- 11.10.1. Company Overview
- 11.10.2. Financial Performance
- 11.10.3. Product Benchmarking
- 11.10.4. Recent Development
- 11.11. Intuitive Surgical Inc
- 11.11.1. Company Overview
- 11.11.2. Financial Performance
- 11.11.3. Product Benchmarking
- 11.11.4. Recent Development
- 11.12. iRobot Corporation
- 11.12.1. Company Overview
- 11.12.2. Financial Performance
- 11.12.3. Product Benchmarking
- 11.12.4. Recent Development
- 11.13. John Deere
- 11.13.1. Company Overview
- 11.13.2. Financial Performance
- 11.13.3. Product Benchmarking
- 11.13.4. Recent Development
- 11.14. Lego
- 11.14.1. Company Overview
- 11.14.2. Financial Performance
- 11.14.3. Product Benchmarking
- 11.14.4. Recent Development
- 11.15. LG Electronics Inc
- 11.15.1. Company Overview
- 11.15.2. Financial Performance
- 11.15.3. Product Benchmarking
- 11.15.4. Recent Development
- 11.16. Maytronics Ltd
- 11.16.1. Company Overview
- 11.16.2. Financial Performance
- 11.16.3. Product Benchmarking
- 11.16.4. Recent Development
- 11.17. Miele
- 11.17.1. Company Overview
- 11.17.2. Financial Performance
- 11.17.3. Product Benchmarking
- 11.17.4. Recent Development
- 11.18. Neato Robotics, Inc
- 11.18.1. Company Overview
- 11.18.2. Financial Performance
- 11.18.3. Product Benchmarking
- 11.18.4. Recent Development
- 11.19. Panasonic Corporation
- 11.19.1. Company Overview
- 11.19.2. Financial Performance
- 11.19.3. Product Benchmarking
- 11.19.4. Recent Development
- 11.20. Robomow
- 11.20.1. Company Overview
- 11.20.2. Financial Performance
- 11.20.3. Product Benchmarking
- 11.20.4. Recent Development
- 11.21. Roborock Technology Co. Ltd
- 11.21.1. Company Overview
- 11.21.2. Financial Performance
- 11.21.3. Product Benchmarking
- 11.21.4. Recent Development
- 11.22. Samsung Electronics Co. Ltd
- 11.22.1. Company Overview
- 11.22.2. Financial Performance
- 11.22.3. Product Benchmarking
- 11.22.4. Recent Development
- 11.23. SharkNinja Operating LLC
- 11.23.1. Company Overview
- 11.23.2. Financial Performance
- 11.23.3. Product Benchmarking
- 11.23.4. Recent Development