|
市場調査レポート
商品コード
1246781
海上コネクティビティ (第11版)Maritime Connectivity, 11th Edition |
|||||||

| 海上コネクティビティ (第11版) |
|
出版日: 2023年03月28日
発行: Northern Sky Research, LLC
ページ情報: 英文
納期: 即日から翌営業日
|
- 全表示
- 概要
- 目次
COVID-19の影響が市場から消えても、デジタル化とスループットの要件は残っています。旅客船では接続要件が急増し、石油・ガスやオフショア施設の需要は船単位で持続し、乗組員の福利厚生が需要の重要な原動力となる時期かもしれません。全体として、海上衛星コネクティビティの需要は拡大し続けており、2032年にかけて、新しい端末のフォームファクターと価格帯が小型船舶に向けて解放され、新しいビジネスモデルがマージナルな利用事例を獲得すると考えられています。
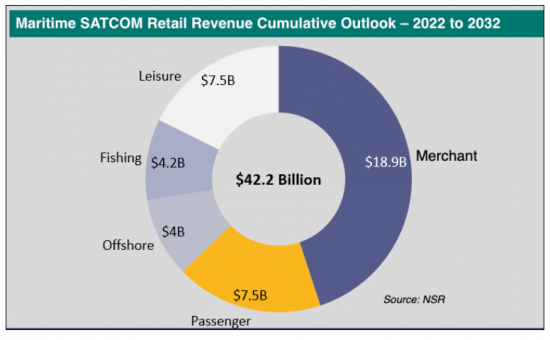
予測期間中の累積収益は422億米ドル、CAGRは9.5%と見込まれています。
分析概要
当レポートでは、世界の海上コネクティビティ (海上衛星通信) の最新情勢や市場力学、成長機会について分析し、海上衛星通信におけるGEO (静止) およびNGEO (非静止) コネクティビティの役割や、全体的な市場規模 - 稼働中の衛星の台数、小売売上高、容量需要、収益額など - の動向見通し (今後10年間分)、地域別・セグメント別 (商船・旅客船・オフショア施設・漁船・レジャー船) の詳細動向、業界関係者が今後取るべき戦略、といった情報を取りまとめてお届けいたします。
主な特徴
当レポートの分析対象:
- NGSO (非静止) 企業の取り組みとその影響:Starlink・OneWeb
- 地域別動向:全8地域 (北米、ラテンアメリカ、欧州、中東・アフリカ、アジア、AOR (大西洋)、IOR (インド洋)、POR (太平洋)、ARC (南極)
- 船舶の種類別の予測:全5種類 (商船、旅客、オフショア施設、漁業、レジャー船)
- 各船舶市場におけるVSAT需要の概要
当レポートの分析対象企業
SpaceX Starlink、OneWeb、Telesat Lightspeed、AWS Kuiper、Inmarsat、Intellian、Speedcast、Marlink、Anuvu、SES
目次
第1章 海上衛星通信:エグゼクティブサマリー
- 概要
- 420億米ドルの市場機会
- 月間ARPUは短期的に上昇
- 非GEO HTSへの移行が進行中
- 主な分析結果
第2章 主な分析結果
- 衛星通信船舶市場向けのLEO+MEOピボット
- VSAT:過去の比較
- 地域別の見通し
- 有効市場 (TAM)
- サービスプロバイダー層の状態
- 商船の見通し
- 旅客船の見通し
- オフショア施設の見通し
- 漁船の見通し
- レジャー船の展望
第3章 課題と推奨事項
- 「コネクティビティ」を超えた収益化
- NGEOは接続性を改善し、サービスプロバイダが提供するVASの役割を減らすのか?
- 海上SATCOMにおける3つの大きな成長機会
第4章 データ付録
Report Summary:
NSR's “ Maritime Connectivity, 11th Edition” report offers valuable insights and analysis, helping industry stakeholders understand market dynamics and capitalize on growth opportunities in maritime SatCom markets.
Focusing on the impacts from Non-GEO systems such as the 'new entrants' of Starlink, OneWeb, and mPower this edition explores the role of GEO vs. Non-GEO (NGSO) connectivity in the maritime SATCOM markets. Building from a regional and segment level view, the report is broken down into 5 vessel types - Merchant, Passenger, Offshore, Fishing, and Leisure. Each segmentation provides insight into In-service units, retail revenues, capacity demand and revenue. Overall, as more capacity choices come online over the next ten years Maritime SATCOM players will need to have a carefully crafted capacity strategy in place to optimize revenues and meet customer demands.
As the impacts of COVID-19 fall away from the market, digitalization and throughput requirements remain. Passenger vessels are seeing a surge in connectivity requirements, oil and gas / Offshore demand persist on a per-vessel basis, and now might be the time for crew welfare provisioning to become a key driver of demand. Towards 2032, new terminal form factors and price points will unlock smaller and smaller vessels, new business models will help capture marginal use-cases, and overall, the demand for maritime satellite connectivity continues to expand.
Bottom line, NSR's “ Maritime Connectivity, 11th Edition” helps industry stakeholders make informed decisions about their business strategies and investments in this important evolving market.
Key questions are answered in this report?
- What are the major satellite connectivity architectures?
- Which region holds the most opportunity?
- What is the revenue outlook of the Maritime SATCOM Market?
- What is the growth rate of the Maritime SATCOM market?
- Which vessel market is in transition towards NGSO market?
Who Should Purchase this Report:
- SATCOM service providers
- Business Strategy mangers
- Maritime end-users
- Maritime Satellite Equipment manufacturers
- Satellite Operators
- Financial services and other investor community members
Key Features:
Covered in this Report:
- NEW in this Edition - Focus on the uptake and impact of NGSO Players such as Starlink and OneWeb
- 8 Regions - NAM, LAM, EU, MEA, ASIA, AOR, IOR, POR, ARC
- Forecasts for 5 vessel markets - Merchant, Passenger, Offshore, Fishing, Leisure.
- Overview of VSAT demand for each vessel market.
Key Findings:
- Merchant Vessels - VSAT adoption increasing across merchant market. IoT and Cloud-to-Vessel adoption is occurring across fleets, including more SD-WAN installations.
- Passenger Vessels - Cruise liners trialing NGSO connectivity e.g., SpaceX Starlink. Passenger vessels are optimizing their fleets network to automate data processing.
- Offshore Vessels - A market that is filled with VSAT architecture. Early trials of NGSO low latency connectivity taking place in Q1 of 2023 e.g., SpaceX Starlink.
- Fishing Vessels - Vessel optimization for HTS architecture is occurring and is a given with new builds. VSAT adoption is on the rise across the fishing market.
- Leisure Vessels - NGSO adoption is occurring across both small and super yachts. VSAT adoption is happening on small yachts due to affordable price tag.
Overall cumulative revenue for the forecast period is USD$42.2 billion and a CAGR of 9.5%.
Companies included in this Report:
SpaceX Starlink, OneWeb, Telesat Lightspeed, AWS Kuiper, Inmarsat, Intellian, Speedcast, Marlink, Anuvu, SES.
Table of Contents
1. Maritime SATCOM Executive Summary
- 1.1. Overview
- 1.2. A $42 Billion Opportunity
- 1.3. A near-term Increase for Monthly ARPUs
- 1.4. The Non-GEO HTS Migration Underway
- 1.5. Major Findings
2. Key Findings
- 2.1. A LEO + MEO Pivot for SATCOM vessel markets
- 2.2. VSAT Historical Comparisons
- 2.3. Regional Outlook
- 2.4. Total Addressable Market (TAM)
- 2.5. State of Service Provider Layer
- 2.6. Merchant Outlook
- 2.7. Passenger Outlook
- 2.8. Offshore Outlook
- 2.9. Fishing Outlook
- 2.10. Leisure Outlook
3. Challenges and Recommendations
- 3.1. Monetizing beyond "Connectivity"
- 3.2. Non-GEO Improving Connectivity and Decreasing Role of SP-provided VAS?
- 3.3. Three Big Growth Opportunities in Maritime SATCOM.
4. Data Appendix
- 4.1. Global Forecast At-a-glance
- 4.2. Merchant Forecast
- 4.3. Passenger Forecast
- 4.4. Offshore Forecast
- 4.5. Fishing Forecast
- 4.6. Leisure Forecast
- 4.7. Key Definitions
- 4.8. Changelog
List of Exhibits
1. Maritime SATCOM Executive Summary
- 1.1. Maritime SATCOM Retail Revenue Cumulative Outlook - 2022 to 2032
- 1.2. Global Maritime SATCOM Market Retail Revenue ($M)
- 1.3. Global Maritime SATCOM Average BB $Month 2022-2027
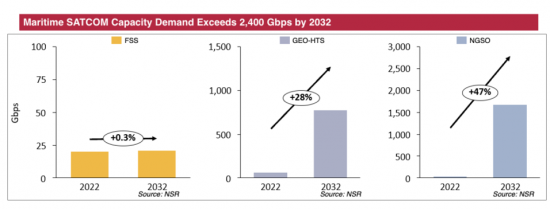
- 1.4. Maritime SATCOM Capacity Demand, FSS vs. GEO-HTS vs. NGSO
- 1.5. Maritime SATCOM Capacity Revenues
2. Key Findings
- 2.1. Maritime SATCOM Retail Revenues by Capacity Type (USD $M)
- 2.2. VSAT Vessel Comparison
- 2.3. VSAT No. of Vessels
- 2.4. Broadband SATCOM Addressable Vessels
- 2.5. Broadband Connected Vessels
- 2.6. Top Maritime Service Provider by Service Revenues (2022)
- 2.7. Top Maritime Service Provider by Connected Vessels (2022)
- 2.8. Merchant Retail ARPU 2022-2032 (USD$ per Month)
- 2.9. Merchant Service Revenues ($M) - GEO-HTS vs NGSO
- 2.10. Percentage of Addressable Merchant vessels
- 2.11. Passenger Retail ARPU 2022-2032 (USD$ per Month)
- 2.12. Passenger Service Revenues ($M) - GEO-HTS vs NGSO
- 2.13. Percentage of Addressable Passenger vessels
- 2.14. Offshore Retail ARPU 2022-2032 (USD$ per Month)
- 2.15. Offshore Service Revenues ($M) - GEO-HTS vs NGSO
- 2.16. Percentage of Addressable Offshore vessels
- 2.17. Fishing Retail ARPU 2022-2032 (USD$ per Month)
- 2.18. Fishing Service Revenues ($M) - GEO-HTS vs NGSO
- 2.19. Percentage of Addressable Fishing vessels
- 2.20. Leisure Retail ARPU 2022-2032 (USD$ per Month)
- 2.21. Leisure Service Revenues ($M) - GEO-HTS vs NGSO
- 2.22. Percentage of Addressable Leisure vessels
3. Challenges and Recommendations
- 3.1. Average VSAT Mbps Demand Per Vessel by Market
- 3.2. NGSO Maritime SATCOM Market Breakdown
- 3.3. Global Maritime SATCOM NGSO Capacity Revenues ($M)
- 3.4. Global Maritime SATCOM NGSO Capacity Demand Breakdown
4. Appendix
- 4.1. Global
- 4.1.1. Global Maritime Market Retail Revenues (USD Billions)
- 4.1.2. Global Maritime Market In-Service Units
- 4.1.3. Global Maritime Market Capacity Demand
- 4.2. Merchant Forecast
- 4.2.1. In-Service Units, 2022 to 2032
- 4.2.2. Retail Revenues (USD Million), 2022 to 2032
- 4.2.3. Capacity Demand (FSS, GEO-HTS & NGSO)
- 4.2.4. Cumulative Capacity Revenues (USD Billions), '22 to '32
- 4.2.5. Capacity Revenues (USD Millions)
- 4.2.6. Regional In-Service Units
- 4.2.7. Regional Retail Revenues (USD Billions)
- 4.2.8. Regional Capacity Demand (FSS, GEO-HTS & NGSO)
- 4.3. Passenger Forecast
- 4.3.1. In-Service Units, 2022 to 2032
- 4.3.2. Retail Revenues (USD Million), 2022 to 2032
- 4.3.3. Capacity Demand (FSS, GEO-HTS & NGSO)
- 4.3.4. Cumulative Capacity Revenues (USD Billions), '22 to '32
- 4.3.5. Capacity Revenues (USD Millions)
- 4.3.6. Regional In-Service Units
- 4.3.7. Regional Retail Revenues (USD Billions)
- 4.3.8. Regional Capacity Demand (FSS, GEO-HTS & NGSO)
- 4.4. Offshore Forecast
- 4.4.1. In-Service Units, 2022 to 2032
- 4.4.2. Retail Revenues (USD Million), 2022 to 2032
- 4.4.3. Capacity Demand (FSS, GEO-HTS & NGSO)
- 4.4.4. Cumulative Capacity Revenues (USD Billions), '22 to '32
- 4.4.5. Capacity Revenues (USD Millions)
- 4.4.6. Regional In-Service Units
- 4.4.7. Regional Retail Revenues (USD Billions)
- 4.4.8. Regional Capacity Demand (FSS, GEO-HTS & NGSO)
- 4.5. Fishing Forecast
- 4.5.1. In-Service Units, 2022 to 2032
- 4.5.2. Retail Revenues (USD Million), 2022 to 2032
- 4.5.3. Capacity Demand (FSS, GEO-HTS & NGSO)
- 4.5.4. Cumulative Capacity Revenues (USD Billions), '22 to '32
- 4.5.5. Capacity Revenues (USD Millions)
- 4.5.6. Regional In-Service Units
- 4.5.7. Regional Retail Revenues (USD Billions)
- 4.5.8. Regional Capacity Demand (FSS, GEO-HTS & NGSO)
- 4.6. Leisure Forecast
- 4.6.1. In-Service Units, 2022 to 2032
- 4.6.2. Retail Revenues (USD Million), 2022 to 2032
- 4.6.3. Capacity Demand (FSS, GEO-HTS & NGSO)
- 4.6.4. Cumulative Capacity Revenues (USD Billions), '22 to '32
- 4.6.5. Capacity Revenues (USD Millions)
- 4.6.6. Regional In-Service Units
- 4.6.7. Regional Retail Revenues (USD Billions)
- 4.6.8. Regional Capacity Demand (FSS, GEO-HTS & NGSO)