|
|
市場調査レポート
商品コード
1647409
ウェアラブルヘルスケア機器市場の評価、タイプ別、製品別、用途別、グレード別、流通チャネル別、地域別、機会および予測、2018~2032年Wearable Healthcare Devices Market Assessment, By Type, By Product, By Application, By Grade, By Distribution Channel, By Region, Opportunities and Forecast, 2018-2032F |
||||||
|
|||||||
カスタマイズ可能
|
|||||||


| ウェアラブルヘルスケア機器市場の評価、タイプ別、製品別、用途別、グレード別、流通チャネル別、地域別、機会および予測、2018~2032年 |
|
出版日: 2025年02月03日
発行: Markets & Data
ページ情報: 英文 225 Pages
納期: 3~5営業日
|

全表示
- 概要
- 図表
- 目次
ウェアラブルヘルスケア機器の世界市場は、2025~2032年の予測期間中にCAGR 17.47%を記録し、2024年の430億7,000万米ドルから2032年には1,561億3,000万米ドルに成長すると予測されています。市場の成長には、健康問題に対する消費者の意識の高まり、医療機器開発企業への投資の増加、斬新な製品機能の実装促進など、いくつかの要因があります。さらに、特に高齢化社会における慢性疾患の蔓延が、この市場拡大に寄与しています。その他の重要な要因としては、遠隔患者モニタリング、在宅ヘルスケアソリューションの需要、健康技術の採用を促進する政府の取り組みなどが挙げられます。
慢性疾患の増加はウェアラブル・ヘルスケア市場に拍車をかけています。糖尿病、高血圧、心血管疾患は最も一般的な疾患であり、座りがちなライフスタイルや高齢化によって有病率が増加しています。このような有病率の増加により、より優れた疾病管理ソリューションが求められており、スマートウォッチやフィットネストラッカーなどのウェアラブルデバイスからのリアルタイムの健康データは、ユーザーの健康状態をモニターするのに役立っています。例えば、持続グルコース・モニター(CGM)は糖尿病管理に不可欠であり、ユーザーは血糖値を追跡し、食事や投薬について十分な情報を得た上で選択することができます。ウェアラブル技術は、患者が健康管理の改善を求め、ヘルスケア・システムが費用対効果の高いソリューションを模索する中で、慢性疾患管理をより積極的で患者に焦点を当てたものにしています。
さらに、フィットネスや健康に対する意識の高まりがウェアラブルヘルスケア機器市場を牽引しています。消費者は自分の健康をモニターすることをますます求めるようになっており、企業はこの需要に応えるべく技術革新を進めています。ウェアラブルヘルスケア機器企業は、このような個人の健康管理需要の高まりに対応するため、心拍数トラッキングや睡眠分析などの高度な機能を備えた製品ラインを拡充しています。例えば、2024年9月、WHOOP Inc.はFlipkartを通じてインド市場で先進的なヘルス・フィットネス・ウェアラブルを発売しました。WHOOPは最先端機能とEMI無料などの魅力的なキャンペーンで、高性能アスリートやウェルネス愛好家に対応し、最先端技術とリアルタイムの健康インサイトを通じて、成長するウェアラブルヘルスケア機器市場を強化しています。
目次
第1章 プロジェクトの範囲と定義
第2章 調査手法
第3章 エグゼクティブサマリー
第4章 世界のウェアラブルヘルスケア機器市場の展望、2018年~2032年
- 市場規模の分析と予測
- 金額別
- 数量別
- 市場シェア分析と予測
- タイプ別
- 診断装置
- 治療機器
- 製品別
- フィットネストラッカー
- スマートウォッチ
- スマートな服
- ヒアラブル
- その他
- 用途別
- スポーツとフィットネス
- 在宅ヘルスケア
- 遠隔患者モニタリング
- グレード別
- 消費者向けグレード
- 臨床グレード
- 流通チャネル別
- 小売薬局
- オンラインチャンネル
- その他
- 地域別
- 北米
- 欧州
- アジア太平洋
- 南米
- 中東およびアフリカ
- 企業別市場シェア分析(上位5社およびその他- 金額別、2024年)
- タイプ別
- 市場マップ分析、2024年
- タイプ別
- 製品別
- 用途別
- グレード別
- 流通チャネル別
- 地域別
第5章 北米のウェアラブルヘルスケア機器市場の展望、2018年~2032年
- 市場規模の分析と予測
- 金額別
- 数量別
- 市場シェア分析と予測
- タイプ別
- 診断装置
- 治療機器
- 製品別
- フィットネストラッカー
- スマートウォッチ
- スマート・ウェア
- ヒアラブル
- その他
- 用途別
- スポーツとフィットネス
- 在宅ヘルスケア
- 遠隔患者モニタリング
- グレード別
- 消費者向けグレード
- 臨床グレード
- 流通チャネル別
- 小売薬局
- オンラインチャンネル
- その他
- 国別シェア
- 米国
- カナダ
- メキシコ
- タイプ別
- 国別市場評価
- 米国のウェアラブルヘルスケア機器市場の見通し、2018年~2032年
- 市場規模の分析と予測
- 市場シェア分析と予測
- カナダ
- メキシコ
- 米国のウェアラブルヘルスケア機器市場の見通し、2018年~2032年
すべてのセグメントは、対象となるすべての地域と国で提供されます。
第6章 欧州のウェアラブルヘルスケア機器市場の展望、2018年~2032年
- ドイツ
- フランス
- イタリア
- 英国
- ロシア
- オランダ
- スペイン
- ポーランド
第7章 アジア太平洋のウェアラブルヘルスケア機器市場の展望、2018年~2032年
- インド
- 中国
- 日本
- オーストラリア
- ベトナム
- 韓国
- インドネシア
- フィリピン
第8章 南米のウェアラブルヘルスケア機器市場の展望、2018年~2032年
- ブラジル
- アルゼンチン
第9章 中東およびアフリカのウェアラブルヘルスケア機器市場の見通し、2018年~2032年
- サウジアラビア
- アラブ首長国連邦
- 南アフリカ
- イスラエル
第10章 需要供給分析
第11章 輸入と輸出の分析
第12章 バリューチェーン分析
第13章 ポーターのファイブフォース分析
第14章 PESTLE分析
第15章 価格分析
第16章 市場力学
- 市場促進要因
- 市場の課題
第17章 市場の動向と発展
第18章 規制枠組みとイノベーション
- 規制当局の承認
第19章 特許の情勢
第20章 ケーススタディ
第21章 競合情勢
- 市場リーダー上位5社の競合マトリックス
- 上位5社企業のSWOT分析
- 主要企業上位10社の市場情勢
- Koninklijke Philips NV
- 会社概要
- 主要経営陣
- 製品とサービス
- 財務状況(報告通り)
- 主な市場フォーカスと地理的プレゼンス
- 最近の動向/コラボレーション/ パートナーシップ/合併と買収
- Medtronic Inc.
- Abbott Laboratories
- Fitbit, Inc.
- Dexcom, Inc.
- Huawei Device Co., Ltd.
- Garmin Ltd.
- Sotera Wireless, Inc.
- Ypsomed AG
- NeuroMetrix, Inc.
上記の企業は市場シェアに基づいて注文を保留しておらず、調査作業中に入手可能な情報に基づいて変更される可能性があります。
第22章 戦略的提言
第23章 調査会社について・免責事項
List of Tables
- Table 1. Competition Matrix of Top 5 Market Leaders
- Table 2. Mergers & Acquisitions/ Joint Ventures (If Applicable)
- Table 3. About Us - Regions and Countries Where We Have Executed Client Projects
List of Figures
- Figure 1. Global Wearable Healthcare Devices Market, By Value, In USD Billion, 2018-2032F
- Figure 2. Global Wearable Healthcare Devices Market, By Volume, In Unit Million, 2018-2032F
- Figure 3. Global Wearable Healthcare Devices Market Share (%), By Type, 2018-2032F
- Figure 4. Global Wearable Healthcare Devices Market Share (%), By Product, 2018-2032F
- Figure 5. Global Wearable Healthcare Devices Market Share (%), By Application, 2018-2032F
- Figure 6. Global Wearable Healthcare Devices Market Share (%), By Grade, 2018-2032F
- Figure 7. Global Wearable Healthcare Devices Market Share (%), By Distribution Channel, 2018-2032F
- Figure 8. Global Wearable Healthcare Devices Market Share (%), By Region, 2018-2032F
- Figure 9. North America Wearable Healthcare Devices Market, By Value, In USD Billion, 2018-2032F
- Figure 10. North America Wearable Healthcare Devices Market, By Volume, In Unit Million, 2018-2032F
- Figure 11. North America Wearable Healthcare Devices Market Share (%), By Type, 2018-2032F
- Figure 12. North America Wearable Healthcare Devices Market Share (%), By Product, 2018-2032F
- Figure 13. North America Wearable Healthcare Devices Market Share (%), By Application, 2018-2032F
- Figure 14. North America Wearable Healthcare Devices Market Share (%), By Grade, 2018-2032F
- Figure 15. North America Wearable Healthcare Devices Market Share (%), By Distribution Channel, 2018-2032F
- Figure 16. North America Wearable Healthcare Devices Market Share (%), By Country, 2018-2032F
- Figure 17. United States Wearable Healthcare Devices Market, By Value, In USD Billion, 2018-2032F
- Figure 18. United States Wearable Healthcare Devices Market, By Volume, In Unit Million, 2018-2032F
- Figure 19. United States Wearable Healthcare Devices Market Share (%), By Type, 2018-2032F
- Figure 20. United States Wearable Healthcare Devices Market Share (%), By Product, 2018-2032F
- Figure 21. United States Wearable Healthcare Devices Market Share (%), By Application, 2018-2032F
- Figure 22. United States Wearable Healthcare Devices Market Share (%), By Grade, 2018-2032F
- Figure 23. United States Wearable Healthcare Devices Market Share (%), By Distribution Channel, 2018-2032F
- Figure 24. Canada Wearable Healthcare Devices Market, By Value, In USD Billion, 2018-2032F
- Figure 25. Canada Wearable Healthcare Devices Market, By Volume, In Unit Million, 2018-2032F
- Figure 26. Canada Wearable Healthcare Devices Market Share (%), By Type, 2018-2032F
- Figure 27. Canada Wearable Healthcare Devices Market Share (%), By Product, 2018-2032F
- Figure 28. Canada Wearable Healthcare Devices Market Share (%), By Application, 2018-2032F
- Figure 29. Canada Wearable Healthcare Devices Market Share (%), By Grade, 2018-2032F
- Figure 30. Canada Wearable Healthcare Devices Market Share (%), By Distribution Channel, 2018-2032F
- Figure 31. Mexico Wearable Healthcare Devices Market, By Value, In USD Billion, 2018-2032F
- Figure 32. Mexico Wearable Healthcare Devices Market, By Volume, In Unit Million, 2018-2032F
- Figure 33. Mexico Wearable Healthcare Devices Market Share (%), By Type, 2018-2032F
- Figure 34. Mexico Wearable Healthcare Devices Market Share (%), By Product, 2018-2032F
- Figure 35. Mexico Wearable Healthcare Devices Market Share (%), By Application, 2018-2032F
- Figure 36. Mexico Wearable Healthcare Devices Market Share (%), By Grade, 2018-2032F
- Figure 37. Mexico Wearable Healthcare Devices Market Share (%), By Distribution Channel, 2018-2032F
- Figure 38. Europe Wearable Healthcare Devices Market, By Value, In USD Billion, 2018-2032F
- Figure 39. Europe Wearable Healthcare Devices Market, By Volume, In Unit Million, 2018-2032F
- Figure 40. Europe Wearable Healthcare Devices Market Share (%), By Type, 2018-2032F
- Figure 41. Europe Wearable Healthcare Devices Market Share (%), By Product, 2018-2032F
- Figure 42. Europe Wearable Healthcare Devices Market Share (%), By Application, 2018-2032F
- Figure 43. Europe Wearable Healthcare Devices Market Share (%), By Grade, 2018-2032F
- Figure 44. Europe Wearable Healthcare Devices Market Share (%), By Distribution Channel, 2018-2032F
- Figure 45. Europe Wearable Healthcare Devices Market Share (%), By Country, 2018-2032F
- Figure 46. Germany Wearable Healthcare Devices Market, By Value, In USD Billion, 2018-2032F
- Figure 47. Germany Wearable Healthcare Devices Market, By Volume, In Unit Million, 2018-2032F
- Figure 48. Germany Wearable Healthcare Devices Market Share (%), By Type, 2018-2032F
- Figure 49. Germany Wearable Healthcare Devices Market Share (%), By Product, 2018-2032F
- Figure 50. Germany Wearable Healthcare Devices Market Share (%), By Application, 2018-2032F
- Figure 51. Germany Wearable Healthcare Devices Market Share (%), By Grade, 2018-2032F
- Figure 52. Germany Wearable Healthcare Devices Market Share (%), By Distribution Channel, 2018-2032F
- Figure 53. France Wearable Healthcare Devices Market, By Value, In USD Billion, 2018-2032F
- Figure 54. France Wearable Healthcare Devices Market, By Volume, In Unit Million, 2018-2032F
- Figure 55. France Wearable Healthcare Devices Market Share (%), By Type, 2018-2032F
- Figure 56. France Wearable Healthcare Devices Market Share (%), By Product, 2018-2032F
- Figure 57. France Wearable Healthcare Devices Market Share (%), By Application, 2018-2032F
- Figure 58. France Wearable Healthcare Devices Market Share (%), By Grade, 2018-2032F
- Figure 59. France Wearable Healthcare Devices Market Share (%), By Distribution Channel, 2018-2032F
- Figure 60. Italy Wearable Healthcare Devices Market, By Value, In USD Billion, 2018-2032F
- Figure 61. Italy Wearable Healthcare Devices Market, By Volume, In Unit Million, 2018-2032F
- Figure 62. Italy Wearable Healthcare Devices Market Share (%), By Type, 2018-2032F
- Figure 63. Italy Wearable Healthcare Devices Market Share (%), By Product, 2018-2032F
- Figure 64. Italy Wearable Healthcare Devices Market Share (%), By Application, 2018-2032F
- Figure 65. Italy Wearable Healthcare Devices Market Share (%), By Grade, 2018-2032F
- Figure 66. Italy Wearable Healthcare Devices Market Share (%), By Distribution Channel, 2018-2032F
- Figure 67. United Kingdom Wearable Healthcare Devices Market, By Value, In USD Billion, 2018-2032F
- Figure 68. United Kingdom Wearable Healthcare Devices Market, By Volume, In Unit Million, 2018-2032F
- Figure 69. United Kingdom Wearable Healthcare Devices Market Share (%), By Type, 2018-2032F
- Figure 70. United Kingdom Wearable Healthcare Devices Market Share (%), By Product, 2018-2032F
- Figure 71. United Kingdom Wearable Healthcare Devices Market Share (%), By Application, 2018-2032F
- Figure 72. United Kingdom Wearable Healthcare Devices Market Share (%), By Grade, 2018-2032F
- Figure 73. United Kingdom Wearable Healthcare Devices Market Share (%), By Distribution Channel, 2018-2032F
- Figure 74. Russia Wearable Healthcare Devices Market, By Value, In USD Billion, 2018-2032F
- Figure 75. Russia Wearable Healthcare Devices Market, By Volume, In Unit Million, 2018-2032F
- Figure 76. Russia Wearable Healthcare Devices Market Share (%), By Type, 2018-2032F
- Figure 77. Russia Wearable Healthcare Devices Market Share (%), By Product, 2018-2032F
- Figure 78. Russia Wearable Healthcare Devices Market Share (%), By Application, 2018-2032F
- Figure 79. Russia Wearable Healthcare Devices Market Share (%), By Grade, 2018-2032F
- Figure 80. Russia Wearable Healthcare Devices Market Share (%), By Distribution Channel, 2018-2032F
- Figure 81. Netherlands Wearable Healthcare Devices Market, By Value, In USD Billion, 2018-2032F
- Figure 82. Netherlands Wearable Healthcare Devices Market, By Volume, In Unit Million, 2018-2032F
- Figure 83. Netherlands Wearable Healthcare Devices Market Share (%), By Type, 2018-2032F
- Figure 84. Netherlands Wearable Healthcare Devices Market Share (%), By Product, 2018-2032F
- Figure 85. Netherlands Wearable Healthcare Devices Market Share (%), By Application, 2018-2032F
- Figure 86. Netherlands Wearable Healthcare Devices Market Share (%), By Grade, 2018-2032F
- Figure 87. Netherlands Wearable Healthcare Devices Market Share (%), By Distribution Channel, 2018-2032F
- Figure 88. Spain Wearable Healthcare Devices Market, By Value, In USD Billion, 2018-2032F
- Figure 89. Spain Wearable Healthcare Devices Market, By Volume, In Unit Million, 2018-2032F
- Figure 90. Spain Wearable Healthcare Devices Market Share (%), By Type, 2018-2032F
- Figure 91. Spain Wearable Healthcare Devices Market Share (%), By Product, 2018-2032F
- Figure 92. Spain Wearable Healthcare Devices Market Share (%), By Application, 2018-2032F
- Figure 93. Spain Wearable Healthcare Devices Market Share (%), By Grade, 2018-2032F
- Figure 94. Spain Wearable Healthcare Devices Market Share (%), By Distribution Channel, 2018-2032F
- Figure 95. Turkey Wearable Healthcare Devices Market, By Value, In USD Billion, 2018-2032F
- Figure 96. Turkey Wearable Healthcare Devices Market, By Volume, In Unit Million, 2018-2032F
- Figure 97. Turkey Wearable Healthcare Devices Market Share (%), By Type, 2018-2032F
- Figure 98. Turkey Wearable Healthcare Devices Market Share (%), By Product, 2018-2032F
- Figure 99. Turkey Wearable Healthcare Devices Market Share (%), By Application, 2018-2032F
- Figure 100. Turkey Wearable Healthcare Devices Market Share (%), By Grade, 2018-2032F
- Figure 101. Turkey Wearable Healthcare Devices Market Share (%), By Distribution Channel, 2018-2032F
- Figure 102. Poland Wearable Healthcare Devices Market, By Value, In USD Billion, 2018-2032F
- Figure 103. Poland Wearable Healthcare Devices Market, By Volume, In Unit Million, 2018-2032F
- Figure 104. Poland Wearable Healthcare Devices Market Share (%), By Type, 2018-2032F
- Figure 105. Poland Wearable Healthcare Devices Market Share (%), By Product, 2018-2032F
- Figure 106. Poland Wearable Healthcare Devices Market Share (%), By Application, 2018-2032F
- Figure 107. Poland Wearable Healthcare Devices Market Share (%), By Grade, 2018-2032F
- Figure 108. Poland Wearable Healthcare Devices Market Share (%), By Distribution Channel, 2018-2032F
- Figure 109. South America Wearable Healthcare Devices Market, By Value, In USD Billion, 2018-2032F
- Figure 110. South America Wearable Healthcare Devices Market, By Volume, In Unit Million, 2018-2032F
- Figure 111. South America Wearable Healthcare Devices Market Share (%), By Type, 2018-2032F
- Figure 112. South America Wearable Healthcare Devices Market Share (%), By Product, 2018-2032F
- Figure 113. South America Wearable Healthcare Devices Market Share (%), By Application, 2018-2032F
- Figure 114. South America Wearable Healthcare Devices Market Share (%), By Grade, 2018-2032F
- Figure 115. South America Wearable Healthcare Devices Market Share (%), By Distribution Channel, 2018-2032F
- Figure 116. South America Wearable Healthcare Devices Market Share (%), By Country, 2018-2032F
- Figure 117. Brazil Wearable Healthcare Devices Market, By Value, In USD Billion, 2018-2032F
- Figure 118. Brazil Wearable Healthcare Devices Market, By Volume, In Unit Million, 2018-2032F
- Figure 119. Brazil Wearable Healthcare Devices Market Share (%), By Type, 2018-2032F
- Figure 120. Brazil Wearable Healthcare Devices Market Share (%), By Product, 2018-2032F
- Figure 121. Brazil Wearable Healthcare Devices Market Share (%), By Application, 2018-2032F
- Figure 122. Brazil Wearable Healthcare Devices Market Share (%), By Grade, 2018-2032F
- Figure 123. Brazil Wearable Healthcare Devices Market Share (%), By Distribution Channel, 2018-2032F
- Figure 124. Argentina Wearable Healthcare Devices Market, By Value, In USD Billion, 2018-2032F
- Figure 125. Argentina Wearable Healthcare Devices Market, By Volume, In Unit Million, 2018-2032F
- Figure 126. Argentina Wearable Healthcare Devices Market Share (%), By Type, 2018-2032F
- Figure 127. Argentina Wearable Healthcare Devices Market Share (%), By Product, 2018-2032F
- Figure 128. Argentina Wearable Healthcare Devices Market Share (%), By Application, 2018-2032F
- Figure 129. Argentina Wearable Healthcare Devices Market Share (%), By Grade, 2018-2032F
- Figure 130. Argentina Wearable Healthcare Devices Market Share (%), By Distribution Channel, 2018-2032F
- Figure 131. Asia-Pacific Wearable Healthcare Devices Market, By Value, In USD Billion, 2018-2032F
- Figure 132. Asia-Pacific Wearable Healthcare Devices Market, By Volume, In Unit Million, 2018-2032F
- Figure 133. Asia-Pacific Wearable Healthcare Devices Market Share (%), By Type, 2018-2032F
- Figure 134. Asia-Pacific Wearable Healthcare Devices Market Share (%), By Product, 2018-2032F
- Figure 135. Asia-Pacific Wearable Healthcare Devices Market Share (%), By Application, 2018-2032F
- Figure 136. Asia-Pacific Wearable Healthcare Devices Market Share (%), By Grade, 2018-2032F
- Figure 137. Asia- Pacific Wearable Healthcare Devices Market Share (%), By Distribution Channel, 2018-2032F
- Figure 138. Asia-Pacific Wearable Healthcare Devices Market Share (%), By Country, 2018-2032F
- Figure 139. India Wearable Healthcare Devices Market, By Value, In USD Billion, 2018-2032F
- Figure 140. India Wearable Healthcare Devices Market, By Volume, In Unit Million, 2018-2032F
- Figure 141. India Wearable Healthcare Devices Market Share (%), By Type, 2018-2032F
- Figure 142. India Wearable Healthcare Devices Market Share (%), By Product, 2018-2032F
- Figure 143. India Wearable Healthcare Devices Market Share (%), By Application, 2018-2032F
- Figure 144. India Wearable Healthcare Devices Market Share (%), By Grade, 2018-2032F
- Figure 145. India Wearable Healthcare Devices Market Share (%), By Distribution Channel, 2018-2032F
- Figure 146. China Wearable Healthcare Devices Market, By Value, In USD Billion, 2018-2032F
- Figure 147. China Wearable Healthcare Devices Market, By Volume, In Unit Million, 2018-2032F
- Figure 148. China Wearable Healthcare Devices Market Share (%), By Type, 2018-2032F
- Figure 149. China Wearable Healthcare Devices Market Share (%), By Product, 2018-2032F
- Figure 150. China Wearable Healthcare Devices Market Share (%), By Application, 2018-2032F
- Figure 151. China Wearable Healthcare Devices Market Share (%), By Grade, 2018-2032F
- Figure 152. China Wearable Healthcare Devices Market Share (%), By Distribution Channel, 2018-2032F
- Figure 153. Japan Wearable Healthcare Devices Market, By Value, In USD Billion, 2018-2032F
- Figure 154. Japan Wearable Healthcare Devices Market, By Volume, In Unit Million, 2018-2032F
- Figure 155. Japan Wearable Healthcare Devices Market Share (%), By Type, 2018-2032F
- Figure 156. Japan Wearable Healthcare Devices Market Share (%), By Product, 2018-2032F
- Figure 157. Japan Wearable Healthcare Devices Market Share (%), By Application, 2018-2032F
- Figure 158. Japan Wearable Healthcare Devices Market Share (%), By Grade, 2018-2032F
- Figure 159. Japan Wearable Healthcare Devices Market Share (%), By Distribution Channel, 2018-2032F
- Figure 160. Australia Wearable Healthcare Devices Market, By Value, In USD Billion, 2018-2032F
- Figure 161. Australia Wearable Healthcare Devices Market, By Volume, In Unit Million, 2018-2032F
- Figure 162. Australia Wearable Healthcare Devices Market Share (%), By Type, 2018-2032F
- Figure 163. Australia Wearable Healthcare Devices Market Share (%), By Product, 2018-2032F
- Figure 164. Australia Wearable Healthcare Devices Market Share (%), By Application, 2018-2032F
- Figure 165. Australia Wearable Healthcare Devices Market Share (%), By Grade, 2018-2032F
- Figure 166. Australia Wearable Healthcare Devices Market Share (%), By Distribution Channel, 2018-2032F
- Figure 167. Vietnam Wearable Healthcare Devices Market, By Value, In USD Billion, 2018-2032F
- Figure 168. Vietnam Wearable Healthcare Devices Market, By Volume, In Unit Million, 2018-2032F
- Figure 169. Vietnam Wearable Healthcare Devices Market Share (%), By Type, 2018-2032F
- Figure 170. Vietnam Wearable Healthcare Devices Market Share (%), By Product, 2018-2032F
- Figure 171. Vietnam Wearable Healthcare Devices Market Share (%), By Application, 2018-2032F
- Figure 172. Vietnam Wearable Healthcare Devices Market Share (%), By Grade, 2018-2032F
- Figure 173. Vietnam Wearable Healthcare Devices Market Share (%), By Distribution Channel, 2018-2032F
- Figure 174. South Korea Wearable Healthcare Devices Market, By Value, In USD Billion, 2018-2032F
- Figure 175. South Korea Wearable Healthcare Devices Market, By Volume, In Unit Million, 2018-2032F
- Figure 176. South Korea Wearable Healthcare Devices Market Share (%), By Type, 2018-2032F
- Figure 177. South Korea Wearable Healthcare Devices Market Share (%), By Product, 2018-2032F
- Figure 178. South Korea Wearable Healthcare Devices Market Share (%), By Application, 2018-2032F
- Figure 179. South Korea Wearable Healthcare Devices Market Share (%), By Grade, 2018-2032F
- Figure 180. South Korea Wearable Healthcare Devices Market Share (%), By Distribution Channel, 2018-2032F
- Figure 181. Indonesia Wearable Healthcare Devices Market, By Value, In USD Billion, 2018-2032F
- Figure 182. Indonesia Wearable Healthcare Devices Market, By Volume, In Unit Million, 2018-2032F
- Figure 183. Indonesia Wearable Healthcare Devices Market Share (%), By Type, 2018-2032F
- Figure 184. Indonesia Wearable Healthcare Devices Market Share (%), By Product, 2018-2032F
- Figure 185. Indonesia Wearable Healthcare Devices Market Share (%), By Application, 2018-2032F
- Figure 186. Indonesia Wearable Healthcare Devices Market Share (%), By Grade, 2018-2032F
- Figure 187. Indonesia Wearable Healthcare Devices Market Share (%), By Distribution Channel, 2018-2032F
- Figure 188. Philippines Wearable Healthcare Devices Market, By Value, In USD Billion, 2018-2032F
- Figure 189. Philippines Wearable Healthcare Devices Market, By Volume, In Unit Million, 2018-2032F
- Figure 190. Philippines Wearable Healthcare Devices Market Share (%), By Type, 2018-2032F
- Figure 191. Philippines Wearable Healthcare Devices Market Share (%), By Product, 2018-2032F
- Figure 192. Philippines Wearable Healthcare Devices Market Share (%), By Application, 2018-2032F
- Figure 193. Philippines Wearable Healthcare Devices Market Share (%), By Grade, 2018-2032F
- Figure 194. Philippines Wearable Healthcare Devices Market Share (%), By Distribution Channel, 2018-2032F
- Figure 195. Middle East & Africa Wearable Healthcare Devices Market, By Value, In USD Billion, 2018-2032F
- Figure 196. Middle East & Africa Wearable Healthcare Devices Market, By Volume, In Unit Million, 2018-2032F
- Figure 197. Middle East & Africa Wearable Healthcare Devices Market Share (%), By Type, 2018-2032F
- Figure 198. Middle East & Africa Wearable Healthcare Devices Market Share (%), By Product, 2018-2032F
- Figure 199. Middle East & Africa Wearable Healthcare Devices Market Share (%), By Application, 2018-2032F
- Figure 200. Middle East & Africa Wearable Healthcare Devices Market Share (%), By Grade, 2018-2032F
- Figure 201. Middle East & Africa Wearable Healthcare Devices Market Share (%), By Distribution Channel, 2018-2032F
- Figure 202. Middle East & Africa Wearable Healthcare Devices Market Share (%), By Country, 2018-2032F
- Figure 203. Saudi Arabia Wearable Healthcare Devices Market, By Value, In USD Billion, 2018-2032F
- Figure 204. Saudi Arabia Wearable Healthcare Devices Market, By Volume, In Unit Million, 2018-2032F
- Figure 205. Saudi Arabia Wearable Healthcare Devices Market Share (%), By Type, 2018-2032F
- Figure 206. Saudi Arabia Wearable Healthcare Devices Market Share (%), By Product, 2018-2032F
- Figure 207. Saudi Arabia Wearable Healthcare Devices Market Share (%), By Application, 2018-2032F
- Figure 208. Saudi Arabia Wearable Healthcare Devices Market Share (%), By Grade, 2018-2032F
- Figure 209. Saudi Arabia Wearable Healthcare Devices Market Share (%), By Distribution Channel, 2018-2032F
- Figure 210. UAE Wearable Healthcare Devices Market, By Value, In USD Billion, 2018-2032F
- Figure 211. UAE Wearable Healthcare Devices Market, By Volume, In Unit Million, 2018-2032F
- Figure 212. UAE Wearable Healthcare Devices Market Share (%), By Type, 2018-2032F
- Figure 213. UAE Wearable Healthcare Devices Market Share (%), By Product, 2018-2032F
- Figure 214. UAE Wearable Healthcare Devices Market Share (%), By Application, 2018-2032F
- Figure 215. UAE Wearable Healthcare Devices Market Share (%), By Grade, 2018-2032F
- Figure 216. UAE Wearable Healthcare Devices Market Share (%), By Distribution Channel, 2018-2032F
- Figure 217. South Africa Wearable Healthcare Devices Market, By Value, In USD Billion, 2018-2032F
- Figure 218. South Africa Wearable Healthcare Devices Market, By Volume, In Unit Million, 2018-2032F
- Figure 219. South Africa Wearable Healthcare Devices Market Share (%), By Type, 2018-2032F
- Figure 220. South Africa Wearable Healthcare Devices Market Share (%), By Product, 2018-2032F
- Figure 221. South Africa Wearable Healthcare Devices Market Share (%), By Application, 2018-2032F
- Figure 222. South Africa Wearable Healthcare Devices Market Share (%), By Grade, 2018-2032F
- Figure 223. South Africa Wearable Healthcare Devices Market Share (%), By Distribution Channel, 2018-2032F
- Figure 224. By Type Map-Market Size (USD Billion) & Growth Rate (%), 2024
- Figure 225. By Product Map-Market Size (USD Billion) & Growth Rate (%), 2024
- Figure 226. By Application Map-Market Size (USD Billion) & Growth Rate (%), 2024
- Figure 227. By Grade Map-Market Size (USD Billion) & Growth Rate (%), 2024
- Figure 228. By Distribution Channel Map-Market Size (USD Billion) & Growth Rate (%), 2024
- Figure 229. By Region Map-Market Size (USD Billion) & Growth Rate (%), 2024
Global wearable healthcare devices market is projected to witness a CAGR of 17.47% during the forecast period 2025-2032, growing from USD 43.07 billion in 2024 to USD 156.13 billion in 2032. The market's growth is fueled by several factors, including increasing consumer awareness about health issues, increasing investment in companies developing medical devices, and facilitating the implementation of novel product features. Moreover, the growing prevalence of chronic diseases, especially among the aging population, contributes to this expansion. Other important factors include the demand for remote patient monitoring, home healthcare solutions, and government initiatives promoting health technology adoption.
The rising chronic diseases fuel the wearable healthcare market. Diabetes, hypertension, and cardiovascular diseases are the most common ones, as sedentary lifestyles and an aging population increase their prevalence. This increased prevalence demands a better disease management solution, and real-time health data from wearable devices such as smartwatches and fitness trackers help users monitor their well-being. For example, continuous glucose monitors (CGMs) are vital for diabetes management, allowing users to track blood sugar levels and make informed choices about diet and medication. Wearable technologies are making chronic disease management more proactive and patient-focused as patients seek improved health management and healthcare systems look for cost-effective solutions.
Furthermore, growing fitness and health awareness drives the wearable healthcare devices market. Consumers are increasingly looking to monitor their health, and companies are innovating to meet this demand. Wearable healthcare device companies are expanding their product lines with advanced features like heart rate tracking and sleep analysis to meet this rising demand for personal health management. For example, in September 2024, WHOOP Inc. launched its advanced health and fitness wearables in the Indian market through Flipkart. With cutting-edge features and attractive offers like no-cost EMI, WHOOP caters to high-performance athletes and wellness enthusiasts, bolstering the growing wearable healthcare devices market through its state-of-the-art technology and real-time health insights.
Rising Investments Boost the Market Demand
The growing investments in healthcare are significantly driving the demand for wearable healthcare devices. As governments and private sectors continue to increase their investment in health technology, the development of innovative wearable solutions accelerates. This investment enhances research and development and supports integrating advanced technologies like AI and IoT into wearable devices, improving their functionality and user experience. Moreover, with increased funding, telehealth services are becoming more prevalent, and wearables can be easily integrated into healthcare systems, which promotes proactive health management. This combination of investment and innovation is crucial for meeting the growing consumer demand for effective health monitoring solutions. Such strong demand has prompted key players and other companies to expand offerings to include chronic disease management, tracking fitness, and health monitoring features. These firms also dedicate time to partnerships with healthcare providers to facilitate data exchange and enhance patient care. For instance, in October 2024, Alimetry Ltd. recently raised USD 8 million to commercialize its AI-powered gut health wearable, following increased adoption by U.S. hospitals. This funding is led by GD1 and other leading investors that will support swift and accurate diagnostics for gut disorders. This investment in wearable healthcare devices boosts market demand by emphasizing clinical value and adoption.
Technological Advancements in Wearable Devices Support Market Expansion
Technological advancements in wearable healthcare devices are expanding rapidly, enabling more innovative and efficient health monitoring and management. These devices provide real-time insights, early diagnosis, and personalized care, meeting the rising demand for proactive healthcare solutions by integrating AI, machine learning, and advanced biosensors. For example, in July 2024, SoundHealth Inc. launched SONU, the first FDA De Novo-approved AI-enabled wearable for nasal congestion treatment. Backed by USD 7 million in seed funding, SoundHealth is looking to increase SONU's market footprint and seek more regulatory clearances, reflecting the intensifying influence of technological innovation on the wearable healthcare devices market.
Consumer Grade Segments Account for a Significant Share of the Market
Some important factors that boost the growth of the consumer-grade segment of the wearable healthcare devices market include consumers' growing health consciousness, which has fueled the need for user-friendly and affordable devices to monitor their health and fitness levels. Also, technological advances, such as better sensor technology and connectivity options, enhance the utility of these devices and make them more attractive to a broader section of consumers. The ever-rising lifestyle disease burden and monitoring requirements only accelerate the demand for wearable devices. In July 2024, Samsung Electronics Co., Ltd. (Samsung) released the Galaxy Ring, the company's first intelligent ring that tracks health metrics with the help of AI. The latest offer is for fitness and health enthusiasts, whereby consumer interest in wearable healthcare devices has increased considerably. Through mainstreaming smart rings, Samsung is driving the growth of the consumer-grade wearable technology market. Such products would integrate artificial intelligence and data analytics to present personalized health insights, promoting proactive health management. Furthermore, the growing ecosystem of mobile applications and digital health platforms helps make these wearables more helpful to the end user in the pursuit of their health information tracking, its infusion in daily life, and, consequently, enhancing the growth pattern of the segment.
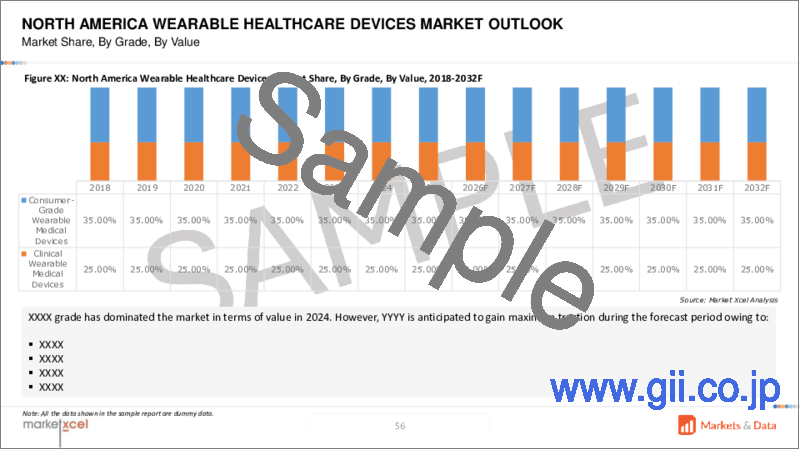
North America Holds Major Market Share
North America accounts for a larger share of wearable healthcare devices, primarily because of higher per capita investments in advanced technologies and their wide adoption. The United States has numerous companies actively introducing innovative products, and many wearable device manufacturers are investing in domestic production. This investment in U.S. manufacturing increases the efficiency of the supply chain and ensures adherence to stringent regulatory standards. For instance, Ultrahuman Healthcare Pvt Ltd, in April 2024, announced the production of wearable smart rings at UltraFactory in Indiana, U.S., through an investment of USD 35 million. This is expected to boost manufacturing and research into health tracking rings. This further improves North America's dominant position in the wearable healthcare devices market with better local manufacturing and innovation. Integration of wearables into routine health management would be easier because of the substantial health infrastructure and tech-friendly population. Growing chronic diseases and an aging population make it even more essential to maintain constant health surveillance, making North America one of the prime destinations for promising markets like wearable healthcare devices. These factors collectively support the region's dominance and position in determining the future of wearable healthcare technology.
Future Market Scenario (2025-2032F)
The wearable health devices market is growing immensely due to the proliferation of chronic diseases, AI advancements for better data analysis, and the development of personalized healthcare insights. These factors are strengthened by mobile health applications and personal preferences for at-home care delivery, creating an environment that demands innovation and expansions in wearable health technologies.
Moreover, digital companies investing in innovative product launches boost market growth. For instance, in July 2024, KORE Group Holdings Inc. and mCare Digital Pty Ltd launched the mCareWatch 241, a smartwatch for virtual patient monitoring. This smartwatch's target market includes people who need immediate assistance, such as seniors and people with disabilities. This innovation shows the opportunities in the wearable healthcare devices market. The focus is on the increasing demand for reliable, technology-based patient care.
Furthermore, in April 2024, Movano Inc. announced a strategic investment from a leading medical device company, indicating the enormous potential of its wearable health technology. The investment will support the development and commercialization of Movano's innovative solutions, including the Evie Ring and Evie Med. Such investments highlight the lucrative opportunities in the wearable healthcare devices market, driving technological advancements and expanding market reach.
Key Players Landscape and Outlook
The market for wearable healthcare devices is diversified and highly competitive. Many companies drive the market through innovation and advanced product releases. With the entry of new firms, competition intensifies, thus augmenting technological development and features. Strategic collaborations among technology companies and healthcare service providers are also integrating wearable devices into health management systems. The companies are investing in more research and development to address individual health requirements; therefore, the market will change dynamically for new opportunities in wearable healthcare technologies.
In November 2024, DexCom, Inc. and Oura Health Oy formed a strategic partnership that combines Dexcom glucose data with the health metrics of Oura Ring (smart ring) to provide users with a holistic view of their health. Dexcom's USD 75 million investment in Oura has highlighted this collaboration's potential to improve wearable healthcare devices. The company will co-market its products and introduce app integrations by mid-2025, thus expanding its market and putting itself at the top of the wearable health tech industry.
In January 2024, Medtronic plc and Cardiac Design Labs collaborated to launch and scale Padma Rhythms, an ELR patch for heart monitoring in India. Medtronic will be an exclusive distributor, and the two companies will develop exclusive training programs. Partnerships strengthen Medtronic's standing in wearable healthcare devices, open avenues for new, advanced heart monitoring technology to numerous customers, and drive market growth.
Table of Contents
1. Project Scope and Definitions
2. Research Methodology
3. Executive Summary
4. Global Wearable Healthcare Devices Market Outlook, 2018-2032F
- 4.1. Market Size Analysis & Forecast
- 4.1.1. By Value
- 4.1.2. By Volume
- 4.2. Market Share Analysis & Forecast
- 4.2.1. By Type
- 4.2.1.1. Diagnostic Devices
- 4.2.1.1.1. Vital Sign Monitoring Devices
- 4.2.1.1.2. Sleep Monitoring Devices
- 4.2.1.1.3. Electrocardiographs Fetal and Obstetric Devices
- 4.2.1.1.4. Neuromonitoring Devices
- 4.2.1.2. Therapeutic Devices
- 4.2.1.2.1. Pain Management Devices
- 4.2.1.2.2. Insulin/Glucose Monitoring Devices
- 4.2.1.2.3. Respiratory Therapy Devices
- 4.2.1.2.4. Others
- 4.2.1.1. Diagnostic Devices
- 4.2.2. By Product
- 4.2.2.1. Fitness Trackers
- 4.2.2.2. Smartwatches
- 4.2.2.3. Smart Clothing
- 4.2.2.4. Hearables
- 4.2.2.5. Others
- 4.2.3. By Application
- 4.2.3.1. Sports and Fitness
- 4.2.3.2. Home Healthcare
- 4.2.3.3. Remote Patient Monitoring
- 4.2.4. By Grade
- 4.2.4.1. Consumer Grade
- 4.2.4.2. Clinical Grade
- 4.2.5. By Distribution Channel
- 4.2.5.1. Retail Pharmacies
- 4.2.5.2. Online Channels
- 4.2.5.3. Others
- 4.2.6. By Region
- 4.2.6.1. North America
- 4.2.6.2. Europe
- 4.2.6.3. Asia-Pacific
- 4.2.6.4. South America
- 4.2.6.5. Middle East and Africa
- 4.2.7. By Company Market Share Analysis (Top 5 Companies and Others - By Value, 2024)
- 4.2.1. By Type
- 4.3. Market Map Analysis, 2024
- 4.3.1. By Type
- 4.3.2. By Product
- 4.3.3. By Application
- 4.3.4. By Grade
- 4.3.5. By Distribution Channel
- 4.3.6. By Region
5. North America Wearable Healthcare Devices Market Outlook, 2018-2032F*
- 5.1. Market Size Analysis & Forecast
- 5.1.1. By Value
- 5.1.2. By Volume
- 5.2. Market Share Analysis & Forecast
- 5.2.1. By Type
- 5.2.1.1. Diagnostic Devices
- 5.2.1.1.1. Vital Sign Monitoring Devices
- 5.2.1.1.2. Sleep Monitoring Devices
- 5.2.1.1.3. Electrocardiographs Fetal and Obstetric Devices
- 5.2.1.1.4. Neuromonitoring Devices
- 5.2.1.2. Therapeutic Devices
- 5.2.1.2.1. Pain Management Devices
- 5.2.1.2.2. Insulin/Glucose Monitoring Devices
- 5.2.1.2.3. Respiratory Therapy Devices
- 5.2.1.2.4. Others
- 5.2.1.1. Diagnostic Devices
- 5.2.2. By Product
- 5.2.2.1. Fitness Trackers
- 5.2.2.2. Smartwatches
- 5.2.2.3. Smart Clothing
- 5.2.2.4. Hearables
- 5.2.2.5. Others
- 5.2.3. By Application
- 5.2.3.1. Sports and Fitness
- 5.2.3.2. Home Healthcare
- 5.2.3.3. Remote Patient Monitoring
- 5.2.4. By Grade
- 5.2.4.1. Consumer Grade
- 5.2.4.2. Clinical Grade
- 5.2.5. By Distribution Channel
- 5.2.5.1. Retail Pharmacies
- 5.2.5.2. Online Channels
- 5.2.5.3. Others
- 5.2.6. By Country Share
- 5.2.6.1. United States
- 5.2.6.2. Canada
- 5.2.6.3. Mexico
- 5.2.1. By Type
- 5.3. Country Market Assessment
- 5.3.1. United States Wearable Healthcare Devices Market Outlook, 2018-2032F*
- 5.3.1.1. Market Size Analysis & Forecast
- 5.3.1.1.1. By Value
- 5.3.1.1.2. By Volume
- 5.3.1.2. Market Share Analysis & Forecast
- 5.3.1.2.1. By Type
- 5.3.1.2.1.1. Diagnostic Devices
- 5.3.1.2.1.1.1. Vital Sign Monitoring Devices
- 5.3.1.2.1.1.2. Sleep Monitoring Devices
- 5.3.1.2.1.1.3. Electrocardiographs Fetal and Obstetric Devices
- 5.3.1.2.1.1.4. Neuromonitoring Devices
- 5.3.1.2.1.2. Therapeutic Devices
- 5.3.1.2.1.2.1. Pain Management Devices
- 5.3.1.2.1.2.2. Insulin/Glucose Monitoring Devices
- 5.3.1.2.1.2.3. Respiratory Therapy Devices
- 5.3.1.2.1.2.4. Others
- 5.3.1.2.2. By Product
- 5.3.1.2.2.1. Fitness Trackers
- 5.3.1.2.2.2. Smartwatches
- 5.3.1.2.2.3. Smart Clothing
- 5.3.1.2.2.4. Hearables
- 5.3.1.2.2.5. Others
- 5.3.1.2.3. By Application
- 5.3.1.2.3.1. Sports and Fitness
- 5.3.1.2.3.2. Home Healthcare
- 5.3.1.2.3.3. Remote Patient Monitoring
- 5.3.1.2.4. By Grade
- 5.3.1.2.4.1. Consumer Grade
- 5.3.1.2.4.2. Clinical Grade
- 5.3.1.2.5. By Distribution Channel
- 5.3.1.2.5.1. Retail Pharmacies
- 5.3.1.2.5.2. Online Channels
- 5.3.1.2.5.3. Others
- 5.3.1.2.1. By Type
- 5.3.1.1. Market Size Analysis & Forecast
- 5.3.2. Canada
- 5.3.3. Mexico
- 5.3.1. United States Wearable Healthcare Devices Market Outlook, 2018-2032F*
All segments will be provided for all regions and countries covered
6. Europe Wearable Healthcare Devices Market Outlook, 2018-2032F
- 6.1. Germany
- 6.2. France
- 6.3. Italy
- 6.4. United Kingdom
- 6.5. Russia
- 6.6. Netherlands
- 6.7. Spain
- 6.8. Poland
7. Asia-Pacific Wearable Healthcare Devices Market Outlook, 2018-2032F
- 7.1. India
- 7.2. China
- 7.3. Japan
- 7.4. Australia
- 7.5. Vietnam
- 7.6. South Korea
- 7.7. Indonesia
- 7.8. Philippines
8. South America Wearable Healthcare Devices Market Outlook, 2018-2032F
- 8.1. Brazil
- 8.2. Argentina
9. Middle East and Africa Wearable Healthcare Devices Market Outlook, 2018-2032F
- 9.1. Saudi Arabia
- 9.2. UAE
- 9.3. South Africa
- 9.4. Israel
10. Demand Supply Analysis
11. Import and Export Analysis
12. Value Chain Analysis
13. Porter's Five Forces Analysis
14. PESTLE Analysis
15. Pricing Analysis
16. Market Dynamics
- 16.1. Market Drivers
- 16.2. Market Challenges
17. Market Trends and Developments
18. Regulatory Framework and Innovation
- 18.1. Regulatory Approvals
19. Patent Landscape
20. Case Studies
21. Competitive Landscape
- 21.1. Competition Matrix of Top 5 Market Leaders
- 21.2. SWOT Analysis for Top 5 Players
- 21.3. Key Players Landscape for Top 10 Market Players
- 21.3.1. Koninklijke Philips N.V.
- 21.3.1.1. Company Details
- 21.3.1.2. Key Management Personnel
- 21.3.1.3. Products and Services
- 21.3.1.4. Financials (As Reported)
- 21.3.1.5. Key Market Focus and Geographical Presence
- 21.3.1.6. Recent Developments/Collaborations/Partnerships/Mergers and Acquisition
- 21.3.2. Medtronic Inc.
- 21.3.3. Abbott Laboratories
- 21.3.4. Fitbit, Inc.
- 21.3.5. Dexcom, Inc.
- 21.3.6. Huawei Device Co., Ltd.
- 21.3.7. Garmin Ltd.
- 21.3.8. Sotera Wireless, Inc.
- 21.3.9. Ypsomed AG
- 21.3.10. NeuroMetrix, Inc.
- 21.3.1. Koninklijke Philips N.V.
Companies mentioned above DO NOT hold any order as per market share and can be changed as per information available during research work.

