|
|
市場調査レポート
商品コード
1642372
電気乗用車タイヤ市場の評価:推進区分・販売チャネル・地域別の機会および予測 (2018-2032年)Passenger Electric Vehicle Tires Market Assessment, By Propulsion, By Sales Channel, By Region, Opportunities and Forecast, 2018-2032F |
||||||

|
|||||||
カスタマイズ可能
|
|||||||


| 電気乗用車タイヤ市場の評価:推進区分・販売チャネル・地域別の機会および予測 (2018-2032年) |
|
出版日: 2025年01月27日
発行: Markets & Data
ページ情報: 英文 226 Pages
納期: 3~5営業日
|

全表示
- 概要
- 図表
- 目次
世界の電気乗用車タイヤの市場規模は、2024年の273億6,000万米ドルから、予測期間中はCAGR 10.32%で推移し、2032年には600億2,000万米ドルに成長すると予測されています。
同市場は近年著しい成長を遂げており、世界の電気乗用車の普及拡大、政府の奨励策、タイヤ技術の進歩により、今後も拡大が続くと予想されます。より多くの消費者と企業がEVに乗り換えたため、電気乗用車へのシフトがタイヤ需要の主な要因となっています。また、電気自動車の普及を促進するために、税金の積立金や厳しい排出基準など、さまざまな手段で政府のインセンティブや規制による支援が行われています。さらに、エネルギー効率を最適化し、電気自動車の走行距離を拡大するためには、低転がり抵抗、優れたグリップ力、耐久性などの性能特性におけるタイヤ技術の進歩が不可欠です。
また、自動車業界は、環境目標に適した再生可能な材料やリサイクル可能な材料を使用した環境に優しいタイヤを開発することで、持続可能性に注力しています。電気自動車は、より重いバッテリーを搭載し、より高いトルクを発生するなど、その特殊性により、独自のタイヤ要件をもたらしています。そのため、重量増に対応し、より優れたトラクションを発揮するタイヤが必要となり、特殊なタイヤソリューションが求められます。
さらに、EV充電インフラが世界的に拡大していることも、消費者の電動モビリティの普及を後押ししており、EV用タイヤの需要増加を反映しています。そのため、消費者がEVタイヤに関連する安全性、耐久性、低メンテナンスコストなどの性能を優先する中で、製造業者は研究開発に投資し、電気自動車に特化した高性能オプションを開発しています。
当レポートでは、世界の電気乗用車タイヤの市場を調査し、市場の定義と概要、市場規模の推移・予測、各種区分別の詳細分析、市場成長への影響因子の分析、ケーススタディ、競合情勢、主要企業のプロファイルなどをまとめています。
目次
第1章 プロジェクトの範囲と定義
第2章 調査手法
第3章 エグゼクティブサマリー
第4章 顧客の声
- 製品および市場のインテリジェンス
- ブランド認知
- 購入決定時に考慮される要素
第5章 世界の電気乗用車タイヤ市場の展望
- 市場規模の分析・予測
- 市場シェアの分析・予測
- 推進区分別
- 販売チャネル別
- 地域別
- 企業シェア分析(上位5社およびその他)
- 市場マップ分析
第5章 北米の電気乗用車タイヤ市場の展望
- 市場規模の分析・予測
- 市場シェアの分析・予測
- 国別市場評価
- 米国
- カナダ
- メキシコ
第7章 欧州の電気乗用車タイヤ市場の展望
- ドイツ
- フランス
- イタリア
- 英国
- ロシア
- オランダ
- スペイン
- トルコ
- ポーランド
第8章 アジア太平洋の電気乗用車タイヤ市場の展望
- インド
- 中国
- 日本
- オーストラリア
- ベトナム
- 韓国
- インドネシア
- フィリピン
第9章 南米の電気乗用車タイヤ市場の展望
- ブラジル
- アルゼンチン
第10章 中東・アフリカの電気乗用車タイヤ市場の展望
- サウジアラビア
- UAE
- 南アフリカ
第11章 需給分析
第12章 輸出入分析
第13章 バリューチェーン分析
第14章 ポーターのファイブフォース分析
第15章 PESTLE分析
第16章 価格分析
第17章 市場力学
- 市場促進要因
- 市場の課題
第18章 市場動向・展開
第19章 ケーススタディ
第20章 競合情勢
- 上位5社の競合マトリックス
- 上位5社のSWOT分析
- 上位10社の情勢
- Bridgestone Corporation
- Goodyear Tire & Rubber Company
- Continental Reifen Deutschland GmbH
- Pirelli & C. S.p.A
- Michelin
- Sumitomo Rubber Industries, Ltd.
- Nokian Tyres plc
- Toyo Tire Corporation
- Yokohama Rubber Co., Ltd.
- Hankook Tire & Technology Co., Ltd.
第21章 戦略的提言
第22章 調査会社について・免責事項
List of Tables
- Table 1. Pricing Analysis of Products from Key Players
- Table 2. Competition Matrix of Top 5 Market Leaders
- Table 3. Mergers & Acquisitions/ Joint Ventures (If Applicable)
- Table 4. About Us - Regions and Countries Where We Have Executed Client Projects
List of Figures
- Figure 1. Global Passenger Electric Vehicle Tires Market, By Value, In USD Billion, 2018-2032F
- Figure 2. Global Passenger Electric Vehicle Tires Market, By Volume, in Units, 2018-2032F
- Figure 3. Global Passenger Electric Vehicle Tires Market Share (%), By Propulsion, 2018-2032F
- Figure 4. Global Passenger Electric Vehicle Tires Market Share (%), By Sales Channel, 2018-2032F
- Figure 5. Global Passenger Electric Vehicle Tires Market Share (%), By Region, 2018-2032F
- Figure 6. North America Passenger Electric Vehicle Tires Market, By Value, In USD Billion, 2018-2032F
- Figure 7. North America Passenger Electric Vehicle Tires Market, By Volume, in Units, 2018-2032F
- Figure 8. North America Passenger Electric Vehicle Tires Market Share (%), By Propulsion, 2018-2032F
- Figure 9. North America Passenger Electric Vehicle Tires Market Share (%), By Sales Channel, 2018-2032F
- Figure 10. North America Passenger Electric Vehicle Tires Market Share (%), By Country, 2018-2032F
- Figure 11. United States Passenger Electric Vehicle Tires Market, By Value, In USD Billion, 2018-2032F
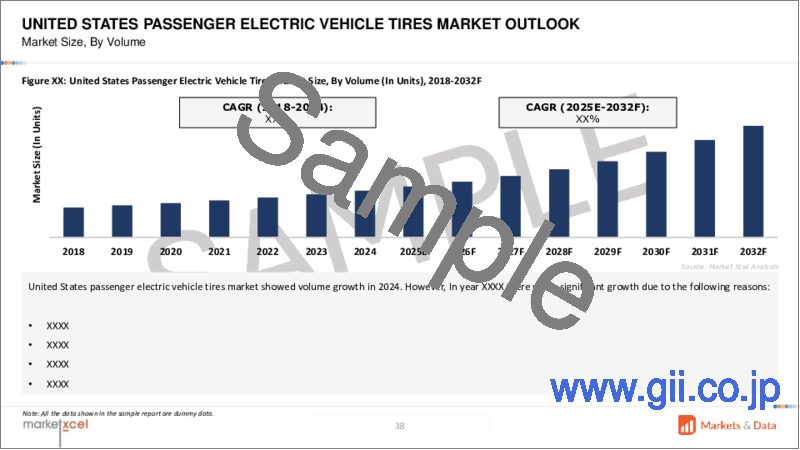
- Figure 12. United States Passenger Electric Vehicle Tires Market, By Volume, in Units, 2018-2032F
- Figure 13. United States Passenger Electric Vehicle Tires Market Share (%), By Propulsion, 2018-2032F
- Figure 14. United States Passenger Electric Vehicle Tires Market Share (%), By Sales Channel, 2018-2032F
- Figure 15. Canada Passenger Electric Vehicle Tires Market, By Value, In USD Billion, 2018-2032F
- Figure 16. Canada Passenger Electric Vehicle Tires Market, By Volume, in Units, 2018-2032F
- Figure 17. Canada Passenger Electric Vehicle Tires Market Share (%), By Propulsion, 2018-2032F
- Figure 18. Canada Passenger Electric Vehicle Tires Market Share (%), By Sales Channel, 2018-2032F
- Figure 19. Mexico Passenger Electric Vehicle Tires Market, By Value, In USD Billion, 2018-2032F
- Figure 20. Mexico Passenger Electric Vehicle Tires Market, By Volume, in Units, 2018-2032F
- Figure 21. Mexico Passenger Electric Vehicle Tires Market Share (%), By Propulsion, 2018-2032F
- Figure 22. Mexico Passenger Electric Vehicle Tires Market Share (%), By Sales Channel, 2018-2032F
- Figure 23. Europe Passenger Electric Vehicle Tires Market, By Value, In USD Billion, 2018-2032F
- Figure 24. Europe Passenger Electric Vehicle Tires Market, By Volume, in Units, 2018-2032F
- Figure 25. Europe Passenger Electric Vehicle Tires Market Share (%), By Propulsion, 2018-2032F
- Figure 26. Europe Passenger Electric Vehicle Tires Market Share (%), By Sales Channel, 2018-2032F
- Figure 27. Europe Passenger Electric Vehicle Tires Market Share (%), By Country, 2018-2032F
- Figure 28. Germany Passenger Electric Vehicle Tires Market, By Value, In USD Billion, 2018-2032F
- Figure 29. Germany Passenger Electric Vehicle Tires Market, By Volume, in Units, 2018-2032F
- Figure 30. Germany Passenger Electric Vehicle Tires Market Share (%), By Propulsion, 2018-2032F
- Figure 31. Germany Passenger Electric Vehicle Tires Market Share (%), By Sales Channel, 2018-2032F
- Figure 32. France Passenger Electric Vehicle Tires Market, By Value, In USD Billion, 2018-2032F
- Figure 33. France Passenger Electric Vehicle Tires Market, By Volume, in Units, 2018-2032F
- Figure 34. France Passenger Electric Vehicle Tires Market Share (%), By Propulsion, 2018-2032F
- Figure 35. France Passenger Electric Vehicle Tires Market Share (%), By Sales Channel, 2018-2032F
- Figure 36. Italy Passenger Electric Vehicle Tires Market, By Value, In USD Billion, 2018-2032F
- Figure 37. Italy Passenger Electric Vehicle Tires Market, By Volume, in Units, 2018-2032F
- Figure 38. Italy Passenger Electric Vehicle Tires Market Share (%), By Propulsion, 2018-2032F
- Figure 39. Italy Passenger Electric Vehicle Tires Market Share (%), By Sales Channel, 2018-2032F
- Figure 40. United Kingdom Passenger Electric Vehicle Tires Market, By Value, In USD Billion, 2018-2032F
- Figure 41. United Kingdom Passenger Electric Vehicle Tires Market, By Volume, in Units, 2018-2032F
- Figure 42. United Kingdom Passenger Electric Vehicle Tires Market Share (%), By Propulsion, 2018-2032F
- Figure 43. United Kingdom Passenger Electric Vehicle Tires Market Share (%), By Sales Channel, 2018-2032F
- Figure 44. Russia Passenger Electric Vehicle Tires Market, By Value, In USD Billion, 2018-2032F
- Figure 45. Russia Passenger Electric Vehicle Tires Market, By Volume, in Units, 2018-2032F
- Figure 46. Russia Passenger Electric Vehicle Tires Market Share (%), By Propulsion, 2018-2032F
- Figure 47. Russia Passenger Electric Vehicle Tires Market Share (%), By Sales Channel, 2018-2032F
- Figure 48. Netherlands Passenger Electric Vehicle Tires Market, By Value, In USD Billion, 2018-2032F
- Figure 49. Netherlands Passenger Electric Vehicle Tires Market, By Volume, in Units, 2018-2032F
- Figure 50. Netherlands Passenger Electric Vehicle Tires Market Share (%), By Propulsion, 2018-2032F
- Figure 51. Netherlands Passenger Electric Vehicle Tires Market Share (%), By Sales Channel, 2018-2032F
- Figure 52. Spain Passenger Electric Vehicle Tires Market, By Value, In USD Billion, 2018-2032F
- Figure 53. Spain Passenger Electric Vehicle Tires Market, By Volume, in Units, 2018-2032F
- Figure 54. Spain Passenger Electric Vehicle Tires Market Share (%), By Propulsion, 2018-2032F
- Figure 55. Spain Passenger Electric Vehicle Tires Market Share (%), By Sales Channel, 2018-2032F
- Figure 56. Turkey Passenger Electric Vehicle Tires Market, By Value, In USD Billion, 2018-2032F
- Figure 57. Turkey Passenger Electric Vehicle Tires Market, By Volume, in Units, 2018-2032F
- Figure 58. Turkey Passenger Electric Vehicle Tires Market Share (%), By Propulsion, 2018-2032F
- Figure 59. Turkey Passenger Electric Vehicle Tires Market Share (%), By Sales Channel, 2018-2032F
- Figure 60. Poland Passenger Electric Vehicle Tires Market, By Value, In USD Billion, 2018-2032F
- Figure 61. Poland Passenger Electric Vehicle Tires Market, By Volume, in Units, 2018-2032F
- Figure 62. Poland Passenger Electric Vehicle Tires Market Share (%), By Propulsion, 2018-2032F
- Figure 63. Poland Passenger Electric Vehicle Tires Market Share (%), By Sales Channel, 2018-2032F
- Figure 64. South America Passenger Electric Vehicle Tires Market, By Value, In USD Billion, 2018-2032F
- Figure 65. South America Passenger Electric Vehicle Tires Market, By Volume, in Units, 2018-2032F
- Figure 66. South America Passenger Electric Vehicle Tires Market Share (%), By Propulsion, 2018-2032F
- Figure 67. South America Passenger Electric Vehicle Tires Market Share (%), By Sales Channel, 2018-2032F
- Figure 68. South America Passenger Electric Vehicle Tires Market Share (%), By Country, 2018-2032F
- Figure 69. Brazil Passenger Electric Vehicle Tires Market, By Value, In USD Billion, 2018-2032F
- Figure 70. Brazil Passenger Electric Vehicle Tires Market, By Volume, in Units, 2018-2032F
- Figure 71. Brazil Passenger Electric Vehicle Tires Market Share (%), By Propulsion, 2018-2032F
- Figure 72. Brazil Passenger Electric Vehicle Tires Market Share (%), By Sales Channel, 2018-2032F
- Figure 73. Argentina Passenger Electric Vehicle Tires Market, By Value, In USD Billion, 2018-2032F
- Figure 74. Argentina Passenger Electric Vehicle Tires Market, By Volume, in Units, 2018-2032F
- Figure 75. Argentina Passenger Electric Vehicle Tires Market Share (%), By Propulsion, 2018-2032F
- Figure 76. Argentina Passenger Electric Vehicle Tires Market Share (%), By Sales Channel, 2018-2032F
- Figure 77. Asia-Pacific Passenger Electric Vehicle Tires Market, By Value, In USD Billion, 2018-2032F
- Figure 78. Asia-Pacific Passenger Electric Vehicle Tires Market, By Volume, in Units, 2018-2032F
- Figure 79. Asia-Pacific Passenger Electric Vehicle Tires Market Share (%), By Propulsion, 2018-2032F
- Figure 80. Asia-Pacific Passenger Electric Vehicle Tires Market Share (%), By Sales Channel, 2018-2032F
- Figure 81. Asia-Pacific Passenger Electric Vehicle Tires Market Share (%), By Country, 2018-2032F
- Figure 82. India Passenger Electric Vehicle Tires Market, By Value, In USD Billion, 2018-2032F
- Figure 83. India Passenger Electric Vehicle Tires Market, By Volume, in Units, 2018-2032F
- Figure 84. India Passenger Electric Vehicle Tires Market Share (%), By Propulsion, 2018-2032F
- Figure 85. India Passenger Electric Vehicle Tires Market Share (%), By Sales Channel, 2018-2032F
- Figure 86. China Passenger Electric Vehicle Tires Market, By Value, In USD Billion, 2018-2032F
- Figure 87. China Passenger Electric Vehicle Tires Market, By Volume, in Units, 2018-2032F
- Figure 88. China Passenger Electric Vehicle Tires Market Share (%), By Propulsion, 2018-2032F
- Figure 89. China Passenger Electric Vehicle Tires Market Share (%), By Sales Channel, 2018-2032F
- Figure 90. Japan Passenger Electric Vehicle Tires Market, By Value, In USD Billion, 2018-2032F
- Figure 91. Japan Passenger Electric Vehicle Tires Market, By Volume, in Units, 2018-2032F
- Figure 92. Japan Passenger Electric Vehicle Tires Market Share (%), By Propulsion, 2018-2032F
- Figure 93. Japan Passenger Electric Vehicle Tires Market Share (%), By Sales Channel, 2018-2032F
- Figure 94. Australia Passenger Electric Vehicle Tires Market, By Value, In USD Billion, 2018-2032F
- Figure 95. Australia Passenger Electric Vehicle Tires Market, By Volume, in Units, 2018-2032F
- Figure 96. Australia Passenger Electric Vehicle Tires Market Share (%), By Propulsion, 2018-2032F
- Figure 97. Australia Passenger Electric Vehicle Tires Market Share (%), By Sales Channel, 2018-2032F
- Figure 98. Vietnam Passenger Electric Vehicle Tires Market, By Value, In USD Billion, 2018-2032F
- Figure 99. Vietnam Passenger Electric Vehicle Tires Market, By Volume, in Units, 2018-2032F
- Figure 100. Vietnam Passenger Electric Vehicle Tires Market Share (%), By Propulsion, 2018-2032F
- Figure 101. Vietnam Passenger Electric Vehicle Tires Market Share (%), By Sales Channel, 2018-2032F
- Figure 102. South Korea Passenger Electric Vehicle Tires Market, By Value, In USD Billion, 2018-2032F
- Figure 103. South Korea Passenger Electric Vehicle Tires Market, By Volume, in Units, 2018-2032F
- Figure 104. South Korea Passenger Electric Vehicle Tires Market Share (%), By Propulsion, 2018-2032F
- Figure 105. South Korea Passenger Electric Vehicle Tires Market Share (%), By Sales Channel, 2018-2032F
- Figure 106. Indonesia Passenger Electric Vehicle Tires Market, By Value, In USD Billion, 2018-2032F
- Figure 107. Indonesia Passenger Electric Vehicle Tires Market, By Volume, in Units, 2018-2032F
- Figure 108. Indonesia Passenger Electric Vehicle Tires Market Share (%), By Propulsion, 2018-2032F
- Figure 109. Indonesia Passenger Electric Vehicle Tires Market Share (%), By Sales Channel, 2018-2032F
- Figure 110. Philippines Passenger Electric Vehicle Tires Market, By Value, In USD Billion, 2018-2032F
- Figure 111. Philippines Passenger Electric Vehicle Tires Market, By Volume, in Units, 2018-2032F
- Figure 112. Philippines Passenger Electric Vehicle Tires Market Share (%), By Propulsion, 2018-2032F
- Figure 113. Philippines Passenger Electric Vehicle Tires Market Share (%), By Sales Channel, 2018-2032F
- Figure 114. Middle East & Africa Passenger Electric Vehicle Tires Market, By Value, In USD Billion, 2018-2032F
- Figure 115. Middle East & Africa Passenger Electric Vehicle Tires Market, By Volume, in Units, 2018-2032F
- Figure 116. Middle East & Africa Passenger Electric Vehicle Tires Market Share (%), By Propulsion, 2018-2032F
- Figure 117. Middle East & Africa Passenger Electric Vehicle Tires Market Share (%), By Sales Channel, 2018-2032F
- Figure 118. Middle East & Africa Passenger Electric Vehicle Tires Market Share (%), By Country, 2018-2032F
- Figure 119. Saudi Arabia Passenger Electric Vehicle Tires Market, By Value, In USD Billion, 2018-2032F
- Figure 120. Saudi Arabia Passenger Electric Vehicle Tires Market, By Volume, in Units, 2018-2032F
- Figure 121. Saudi Arabia Passenger Electric Vehicle Tires Market Share (%), By Propulsion, 2018-2032F
- Figure 122. Saudi Arabia Passenger Electric Vehicle Tires Market Share (%), By Sales Channel, 2018-2032F
- Figure 123. UAE Passenger Electric Vehicle Tires Market, By Value, In USD Billion, 2018-2032F
- Figure 124. UAE Passenger Electric Vehicle Tires Market, By Volume, in Units, 2018-2032F
- Figure 125. UAE Passenger Electric Vehicle Tires Market Share (%), By Propulsion, 2018-2032F
- Figure 126. UAE Passenger Electric Vehicle Tires Market Share (%), By Sales Channel, 2018-2032F
- Figure 127. South Africa Passenger Electric Vehicle Tires Market, By Value, In USD Billion, 2018-2032F
- Figure 128. South Africa Passenger Electric Vehicle Tires Market, By Volume, in Units, 2018-2032F
- Figure 129. South Africa Passenger Electric Vehicle Tires Market Share (%), By Propulsion, 2018-2032F
- Figure 130. South Africa Passenger Electric Vehicle Tires Market Share (%), By Sales Channel, 2018-2032F
- Figure 131. By Propulsion Map-Market Size (USD Billion) & Growth Rate (%), 2024
- Figure 132. By Sales Channel Map-Market Size (USD Billion) & Growth Rate (%), 2024
- Figure 133. By Region Map-Market Size (USD Billion) & Growth Rate (%), 2024
Global passenger electric vehicle tires market is projected to witness a CAGR of 10.32% during the forecast period 2025-2032, growing from USD 27.36 billion in 2024 to USD 60.02 billion in 2032. The market has experienced significant growth in recent years and is expected to continue expanding owing to the increasing adoption of passenger electric vehicles globally, government incentives, and advancements in tire technology. The shift towards passenger electric vehicles is the primary factor for the tire demand as more consumers and businesses have switched toward EVs. In addition, support through government incentives and regulations for promoting electric mobility through different means, such as reserves for taxes and rigorous emission standards to facilitate the acquisition of EVs. Furthermore, tire technology advancements in performance characteristics comprising low rolling resistance, better grip, and durability are essential to optimize energy efficiency and expand the travel distance of electric vehicles.
Moreover, the automotive industry emphasizes sustainability by developing environmentally friendly tires made with renewable and recyclable materials that suit environmental goals. Electric vehicles pose unique tire requirements due to their peculiar characteristics, such as carrying heavier batteries and producing higher torque outputs. This necessitates tires capable of handling increased weight and providing better traction, thus calling for specialized tire solutions. Furthermore, the global expansion of EV charger infrastructures also helps to boost consumer adoption of electric mobility, reflecting increased demand for EV tires. Therefore, as consumers prioritize performance features like safety, durability, and low maintenance costs associated with EV tires, manufacturers invest in research and development to create high-performance options tailored specifically for electric vehicles.
For instance, in October 2023, Toyo Tire Corporation introduced the new Open Country A/T III EV, an all-terrain replacement tire specifically designed for electric vehicles, catering to the rapidly expanding EV trucks and SUVs market.
Increased Adoption of Passenger Electric Vehicle Production is Expanding the Market Demand
The increased adoption of passenger electric vehicle (EV) production significantly increases the demand for global electric vehicle tires. Several factors are surging the adoption of passenger EVs, comprising empowered government financing, government pressure for emissions exhausts, and consumer preference towards sustainable mobility. By 2030, it is anticipated that electric vehicles could represent 66% of total car sales, depending on whether current policies or more ambitious targets are met. Rapid-scale production of EVs necessitates specialized tires designed to meet the unique performance requirements of electric vehicles, including handling increased weight from batteries and providing better traction due to higher torque outputs. Technology is also widening this development by involving manufacturers in producing tires that improve energy efficiency and range driving. The worldwide push for decarbonization and sustainability has further spurred investments in EV infrastructure, adding to consumer confidence in adopting electric vehicles. The combination of growing sales figures, supportive policies, and technological innovations positions the passenger electric vehicle tire market for robust growth in the coming years.
For instance, in March 2023, Sumitomo Rubber Industries, Ltd. introduced the FALKEN e. ZIEX, a new range of replacement tires specifically designed for electric vehicles (EV) in Europe, a market that is experiencing rapid growth.
Technological Advancements Propelling the Global Passenger Electric Vehicle Tires Market Growth
Technological advancements are a significant driving force for developing the global passenger electric vehicle tires market. Growing demand for electric vehicles (EVs) leads tire manufacturers to invest in research and development activities to produce new tire technologies exclusively for EV applications. These advancements focus on critical factors such as rolling resistance, noise reduction, and longevity, which are essential for optimizing the performance of passenger electric vehicles. For instance, low rolling resistance tires improve energy efficiency and allow EVs to travel further on a single charge, improving the battery's life and reducing the number of recharges. Innovation in technology includes the Internet of Things (IoT), allowing real-time monitoring of tire conditions such as pressure, temperature, and tread wear. This smart technology facilitates predictive maintenance, identifying potential tire issues proactively, thus improving safety and performance. Automotive manufacturers are increasingly adopting IoT solutions, and the demand for smart tires equipped with sensors is expected to rise, improving the market capitalization. Lastly, advances in material sciences have led to the design of better-wear-resistant tires, even under low rolling resistance conditions.
For instance, in January 2024, The Goodyear Tire & Rubber Company introduced a new addition to the ElectricDrive family at CES (Consumer Electronics Show) 2024: the Goodyear ElectricDrive 2. This all-season tire for electric vehicles (EVs) features sustainable materials, enhanced rolling resistance, and durable tread life, all designed to optimize EV performance for drivers.
Dominance of Battery Electric Vehicles in Global Passenger Electric Vehicle Tires Market
The dominance of battery electric vehicles in the global passenger electric vehicle (EV) tires market is a significant trend driven by various factors, including a strong consumer shift towards electric vehicles, environmental concerns, and government incentives promoting electric mobility. The increasing adoption of electric passenger vehicles is primarily attributed to favorable policies and rising disposable incomes, which encourage private vehicle ownership for daily commutes. This trend has led to an escalating fleet size of EVs worldwide, thereby flourishing the battery electric vehicle tire market for passenger cars. As consumers prioritize sustainability, the demand for specialized tires designed to meet the unique requirements of electric passenger vehicles has surged. Moreover, the ongoing development of advanced tire technologies is crucial for accommodating the specific needs of electric passenger vehicles. As a result, tire manufacturers are increasingly investing in research and development to create high-performance tires that meet the evolving needs of battery electric vehicles, solidifying their dominance in the global passenger EV tire market.
For instance, in November 2024, Yokohama Rubber Co., Ltd. announced that it would supply its 507U rib-lug tires for low-floor buses to Isuzu Motors Limited. These tires will be used as standard equipment on Isuzu's ERGA EV, a battery electric vehicle (BEV) designed for flat-floor routes, which was launched in May 2024.
North America Dominates Global Passenger Electric Vehicle Tires Market Share
North America is poised to dominate the global passenger electric vehicle (EV) tires market. The growth is largely fueled by the rapid adoption of electric vehicles across the region, supported by favorable government policies and a robust presence of major automakers and tire manufacturers. The United States and Canada are at the forefront of this expansion, with stringent regulations aimed at reducing carbon emissions driving the growth of the EV fleet. These regulations incentivize consumers to switch from internal combustion engine vehicles to electric alternatives, thereby increasing demand for specialized EV tires designed to meet the unique performance requirements of electric vehicles. Technological advancements in tire manufacturing are addressing the specific needs of EVs, such as handling heavier battery loads and providing enhanced durability and efficiency. The presence of significant tire manufacturers in North America further bolsters market growth as these companies invest in developing innovative tire technologies tailored for electric vehicles. In addition, strategic partnerships between tire manufacturers and automotive companies are creating new opportunities for growth within the region.
For instance, in October 2024, Uber Technologies Inc. formed a strategic partnership with ENSO, a finalist in The Earthshot Prize, to introduce their range-extending and low-emission electric vehicle (EV) tires in the United Kingdom and the United States.
Future Market Scenario (2025-2032F)
Technological advancements and strategic collaborations between tire manufacturers and automotive companies will enhance the development of specialized tires tailored for electric vehicles.
With stringent regulations on carbon emissions and a robust automotive industry shift towards electrification, the demand for specialized EV tires will likely grow exponentially.
The shift in consumer preferences toward sustainable transportation options will play a crucial role.
Key Players Landscape and Outlook
The global passenger electric vehicle (EV) tires market landscape is characterized by several key players and a promising outlook driven by increasing demand for electric vehicles. This growth is fueled by the increasing adoption of electric vehicles worldwide, necessitating specialized tires designed for enhanced durability and reduced rolling resistance to maximize range. Technological advancements are also a major driver, with developments in low rolling resistance compounds and aerodynamically optimized tread designs enhancing energy efficiency and extending battery life in EVs. As the market evolves, the emphasis on innovation, acquisition, merger, and collaboration between tire manufacturers and EV producers will create opportunities for differentiation and advancement in tire technology. Overall, the outlook for the global electric vehicle tires market remains robust, with significant growth anticipated as the automotive industry continues its shift toward electrification.
For instance, in October 2023, Bridgestone Corporation and TATA Power Distribution Limited partnered to set up EV chargers for four-wheelers at Bridgestone dealerships across India. Tata Power is installing DC fast chargers with a capacity of 25/30 kWh, which can charge a four-wheeler in about an hour, enabling the charging of 20 to 24 vehicles each day.
Table of Contents
1. Project Scope and Definitions
2. Research Methodology
3. Executive Summary
4. Voice of Customer
- 4.1. Product and Market Intelligence
- 4.2. Brand Awareness
- 4.3. Factors Considered in Purchase Decisions
- 4.3.1. Energy Efficiency
- 4.3.2. Durability
- 4.3.3. Tread Design
- 4.3.4. Cost and Availability
- 4.3.5. Maintenance Requirements
5. Global Passenger Electric Vehicle Tires Market Outlook, 2018-2032F
- 5.1. Market Size Analysis & Forecast
- 5.1.1. By Value
- 5.1.2. By Volume
- 5.2. Market Share Analysis & Forecast
- 5.2.1. By Propulsion
- 5.2.1.1. Battery Electric Vehicles
- 5.2.1.2. Plug-In Hybrid Electric Vehicles
- 5.2.1.3. Hybrid Electric Vehicles
- 5.2.1.4. Fuel Cell Electric Vehicles
- 5.2.2. By Sales Channel
- 5.2.2.1. Original Equipment Manufacturer
- 5.2.2.2. Aftermarket
- 5.2.3. By Region
- 5.2.3.1. North America
- 5.2.3.2. Europe
- 5.2.3.3. Asia-Pacific
- 5.2.3.4. South America
- 5.2.3.5. Middle East and Africa
- 5.2.4. By Company Market Share Analysis (Top 5 Companies and Others - By Value, 2024)
- 5.2.1. By Propulsion
- 5.3. Market Map Analysis, 2024
- 5.3.1. By Propulsion
- 5.3.2. By Sales Channel
- 5.3.3. By Region
6. North America Passenger Electric Vehicle Tires Market Outlook, 2018-2032F*
- 6.1. Market Size Analysis & Forecast
- 6.1.1. By Value
- 6.1.2. By Volume
- 6.2. Market Share Analysis & Forecast
- 6.2.1. By Propulsion
- 6.2.1.1. Battery Electric Vehicles
- 6.2.1.2. Plug-In Hybrid Electric Vehicles
- 6.2.1.3. Hybrid Electric Vehicles
- 6.2.1.4. Fuel Cell Electric Vehicles
- 6.2.2. By Sales Channel
- 6.2.2.1. Original Equipment Manufacturer
- 6.2.2.2. Aftermarket
- 6.2.3. By Country Share
- 6.2.3.1. United States
- 6.2.3.2. Canada
- 6.2.3.3. Mexico
- 6.2.1. By Propulsion
- 6.3. Country Market Assessment
- 6.3.1. United States Passenger Electric Vehicle Tires Market Outlook, 2018-2032F*
- 6.3.1.1. Market Size Analysis & Forecast
- 6.3.1.1.1. By Value
- 6.3.1.1.2. By Volume
- 6.3.1.2. Market Share Analysis & Forecast
- 6.3.1.2.1. By Propulsion
- 6.3.1.2.1.1. Battery Electric Vehicles
- 6.3.1.2.1.2. Plug-In Hybrid Electric Vehicles
- 6.3.1.2.1.3. Hybrid Electric Vehicles
- 6.3.1.2.1.4. Fuel Cell Electric Vehicles
- 6.3.1.2.2. By Sales Channel
- 6.3.1.2.2.1. Original Equipment Manufacturer
- 6.3.1.2.2.2. Aftermarket
- 6.3.1.2.1. By Propulsion
- 6.3.1.1. Market Size Analysis & Forecast
- 6.3.2. Canada
- 6.3.3. Mexico
- 6.3.1. United States Passenger Electric Vehicle Tires Market Outlook, 2018-2032F*
All segments will be provided for all regions and countries covered
7. Europe Passenger Electric Vehicle Tires Market Outlook, 2018-2032F
- 7.1. Germany
- 7.2. France
- 7.3. Italy
- 7.4. United Kingdom
- 7.5. Russia
- 7.6. Netherlands
- 7.7. Spain
- 7.8. Turkey
- 7.9. Poland
8. Asia-Pacific Passenger Electric Vehicle Tires Market Outlook, 2018-2032F
- 8.1. India
- 8.2. China
- 8.3. Japan
- 8.4. Australia
- 8.5. Vietnam
- 8.6. South Korea
- 8.7. Indonesia
- 8.8. Philippines
9. South America Passenger Electric Vehicle Tires Market Outlook, 2018-2032F
- 9.1. Brazil
- 9.2. Argentina
10. Middle East and Africa Passenger Electric Vehicle Tires Market Outlook, 2018-2032F
- 10.1. Saudi Arabia
- 10.2. UAE
- 10.3. South Africa
11. Demand Supply Analysis
12. Import and Export Analysis
13. Value Chain Analysis
14. Porter's Five Forces Analysis
15. PESTLE Analysis
16. Pricing Analysis
17. Market Dynamics
- 17.1. Market Drivers
- 17.2. Market Challenges
18. Market Trends and Developments
19. Case Studies
20. Competitive Landscape
- 20.1. Competition Matrix of Top 5 Market Leaders
- 20.2. SWOT Analysis for Top 5 Players
- 20.3. Key Players Landscape for Top 10 Market Players
- 20.3.1. Bridgestone Corporation
- 20.3.1.1. Company Details
- 20.3.1.2. Key Management Personnel
- 20.3.1.3. Products and Services
- 20.3.1.4. Financials (As Reported)
- 20.3.1.5. Key Market Focus and Geographical Presence
- 20.3.1.6. Recent Developments/Collaborations/Partnerships/Mergers and Acquisition
- 20.3.2. Goodyear Tire & Rubber Company
- 20.3.3. Continental Reifen Deutschland GmbH
- 20.3.4. Pirelli & C. S.p.A
- 20.3.5. Michelin
- 20.3.6. Sumitomo Rubber Industries, Ltd.
- 20.3.7. Nokian Tyres plc
- 20.3.8. Toyo Tire Corporation
- 20.3.9. Yokohama Rubber Co., Ltd.
- 20.3.10. Hankook Tire & Technology Co., Ltd.
- 20.3.1. Bridgestone Corporation
Companies mentioned above DO NOT hold any order as per market share and can be changed as per information available during research work.
