|
|
市場調査レポート
商品コード
1525472
高性能トラックの世界市場の評価:タイプ別、トランスミッション別、用途別、燃料タイプ別、出力別、地域別、機会、予測、2017年~2031年High-Performance Trucks Market Assessment, By Type, By Transmission, By Application, By Fuel Type, By Power Output, By Region, Opportunities and Forecast, 2017-2031F |
||||||

|
|||||||
カスタマイズ可能
|
|||||||

| 高性能トラックの世界市場の評価:タイプ別、トランスミッション別、用途別、燃料タイプ別、出力別、地域別、機会、予測、2017年~2031年 |
|
出版日: 2024年08月02日
発行: Markets & Data
ページ情報: 英文 234 Pages
納期: 3~5営業日
|

全表示
- 概要
- 図表
- 目次
世界の高性能トラックの市場規模は、予測期間の2024年~2031年に7.69%のCAGRで拡大し、2023年の865億米ドルから2031年には1,564億7,000万米ドルに上昇すると予測されます。市場は近年成長を遂げており、農業、鉱業、物流、その他を含むさまざまな産業における高性能トラックへの要求の高まり、技術進歩の上昇、eコマース産業の急速な拡大、規制支援の大幅な増加により、今後数年間も力強い拡大ペースを維持すると推定されます。高性能トラックへのニーズは、eコマースやその他の産業において効率的で一貫した輸送ソリューションを提供することから、著しく高まっています。
また、eコマース部門の拡大は、現在、より多くの顧客がオンラインショッピングを好むため、世界の高性能トラック市場の成長にプラスの影響を与えています。特殊用途および燃費効率の良い商品輸送のためのトラックに対する要求の高まりは、予測期間において、全世界の高性能トラック需要を急増させています。さらに、トラックの性能を向上させるために車両のカスタマイズやパーソナライゼーションへの投資が大幅に増加していることも、高性能トラック市場の拡大を促進しています。
さらに、新興国全体で、政府は道路インフラのアップグレードを進めており、これは、これらのトラックが重い荷物を確実に扱うことができ、より高速を維持できるため、強化された高速道路での長距離輸送に適していることを示唆しているため、商品輸送の効果を高めるのに役立つとみられています。
当レポートでは、世界の高性能トラック市場について調査し、市場の概要とともに、タイプ別、トランスミッション別、用途別、燃料タイプ別、出力別、地域別動向、および市場に参入する企業のプロファイルなどを提供しています。
目次
第1章 調査手法
第2章 プロジェクトの範囲と定義
第3章 エグゼクティブサマリー
第4章 顧客の声
第5章 世界の高性能トラック市場の見通し、2017年~2031年
- 市場規模と予測
- タイプ別
- トランスミッション別
- 用途別
- 燃料タイプ別
- 出力別
- 地域別
- 企業別市場シェア(%)、2023年
第6章 世界の高性能トラック市場の見通し、地域別、2017年~2031年
- 北米
- 欧州
- アジア太平洋
- 南米
- 中東・アフリカ
第7章 市場マッピング、2023年
第8章 マクロ環境と産業構造
- 需要供給分析
- 輸出入分析
- バリューチェーン分析
- PESTEL分析
- ポーターのファイブフォース分析
第9章 市場力学
第10章 主要参入企業の情勢
第11章 価格分析
第12章 ケーススタディ
第13章 主要参入企業の見通し
- Tata Motors Limited
- Ford Motor Company
- General Motors
- ISUZU MOTORS LIMITED
- Hino Motors, Ltd
- Mitsubishi Motors North America, Inc.
- Toyota Kirloskar Motor
- Dongfeng Motor Company
- Iveco Limited
- Volvo Group
- BMW AG
- Daimler Truck AG
第14章 戦略的提言
第15章 お問い合わせと免責事項
List of Tables
- Table 1. Pricing Analysis of Products from Key Players
- Table 2. Competition Matrix of Top 5 Market Leaders
- Table 3. Mergers & Acquisitions/ Joint Ventures (If Applicable)
- Table 4. About Us - Regions and Countries Where We Have Executed Client Projects
List of Figures
- Figure 1. Global High-Performance Trucks Market, By Value, In USD Billion, 2017-2031F
- Figure 2. Global High-Performance Trucks Market, By Volume, In Units, 2017-2031F
- Figure 3. Global High-Performance Trucks Market Share (%), By Type, 2017-2031F
- Figure 4. Global High-Performance Trucks Market Share (%), By Transmission, 2017-2031F
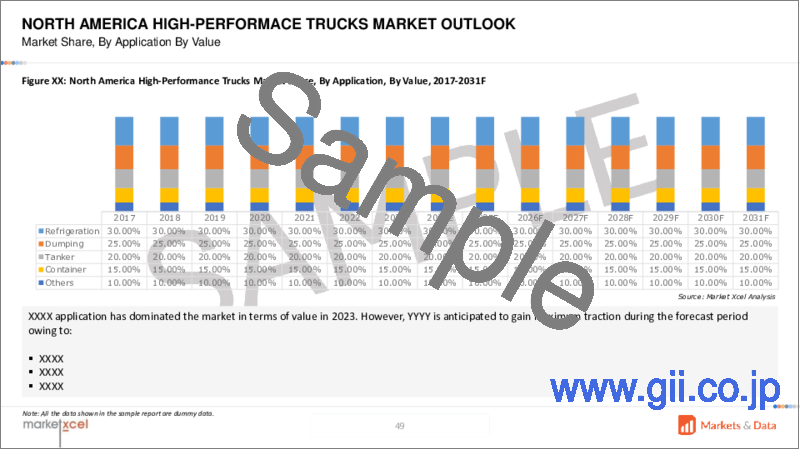
- Figure 5. Global High-Performance Trucks Market Share (%), By Application, 2017-2031F
- Figure 6. Global High-Performance Trucks Market Share (%), By Fuel Type, 2017-2031F
- Figure 7. Global High-Performance Trucks Market Share (%), By Power Output, 2017-2031F
- Figure 8. Global High-Performance Trucks Market Share (%), By Region, 2017-2031F
- Figure 9. North America High-Performance Trucks Market, By Value, In USD Billion, 2017-2031F
- Figure 10. North America High-Performance Trucks Market, By Volume, In Units, 2017-2031F
- Figure 11. North America High-Performance Trucks Market Share (%), By Type, 2017-2031F
- Figure 12. North America High-Performance Trucks Market Share (%), By Transmission, 2017-2031F
- Figure 13. North America High-Performance Trucks Market Share (%), By Application, 2017-2031F
- Figure 14. North America High-Performance Trucks Market Share (%), By Fuel Type, 2017-2031F
- Figure 15. North America High-Performance Trucks Market Share (%), By Power Output, 2017-2031F
- Figure 16. North America High-Performance Trucks Market Share (%), By Country, 2017-2031F
- Figure 17. United States High-Performance Trucks Market, By Value, In USD Billion, 2017-2031F
- Figure 18. United States High-Performance Trucks Market, By Volume, In Units, 2017-2031F
- Figure 19. United States High-Performance Trucks Market Share (%), By Type, 2017-2031F
- Figure 20. United States High-Performance Trucks Market Share (%), By Transmission, 2017-2031F
- Figure 21. United States High-Performance Trucks Market Share (%), By Application, 2017-2031F
- Figure 22. United States High-Performance Trucks Market Share (%), By Fuel Type, 2017-2031F
- Figure 23. United States High-Performance Trucks Market Share (%), By Power Output, 2017-2031F
- Figure 24. Canada High-Performance Trucks Market, By Value, In USD Billion, 2017-2031F
- Figure 25. Canada High-Performance Trucks Market, By Volume, In Units, 2017-2031F
- Figure 26. Canada High-Performance Trucks Market Share (%), By Type, 2017-2031F
- Figure 27. Canada High-Performance Trucks Market Share (%), By Transmission, 2017-2031F
- Figure 28. Canada High-Performance Trucks Market Share (%), By Application, 2017-2031F
- Figure 29. Canada High-Performance Trucks Market Share (%), By Fuel Type, 2017-2031F
- Figure 30. Canada High-Performance Trucks Market Share (%), By Power Output, 2017-2031F
- Figure 31. Mexico High-Performance Trucks Market, By Value, In USD Billion, 2017-2031F
- Figure 32. Mexico High-Performance Trucks Market, By Volume, In Units, 2017-2031F
- Figure 33. Mexico High-Performance Trucks Market Share (%), By Type, 2017-2031F
- Figure 34. Mexico High-Performance Trucks Market Share (%), By Transmission, 2017-2031F
- Figure 35. Mexico High-Performance Trucks Market Share (%), By Application, 2017-2031F
- Figure 36. Mexico High-Performance Trucks Market Share (%), By Fuel Type, 2017-2031F
- Figure 37. Mexico High-Performance Trucks Market Share (%), By Power Output, 2017-2031F
- Figure 38. Europe High-Performance Trucks Market, By Value, In USD Billion, 2017-2031F
- Figure 39. Europe High-Performance Trucks Market, By Volume, In Units, 2017-2031F
- Figure 40. Europe High-Performance Trucks Market Share (%), By Type, 2017-2031F
- Figure 41. Europe High-Performance Trucks Market Share (%), By Transmission, 2017-2031F
- Figure 42. Europe High-Performance Trucks Market Share (%), By Application, 2017-2031F
- Figure 43. Europe High-Performance Trucks Market Share (%), By Fuel Type, 2017-2031F
- Figure 44. Europe High-Performance Trucks Market Share (%), By Power Output, 2017-2031F
- Figure 45. Europe High-Performance Trucks Market Share (%), By Country, 2017-2031F
- Figure 46. Germany High-Performance Trucks Market, By Value, In USD Billion, 2017-2031F
- Figure 47. Germany High-Performance Trucks Market, By Volume, In Units, 2017-2031F
- Figure 48. Germany High-Performance Trucks Market Share (%), By Type, 2017-2031F
- Figure 49. Germany High-Performance Trucks Market Share (%), By Transmission, 2017-2031F
- Figure 50. Germany High-Performance Trucks Market Share (%), By Application, 2017-2031F
- Figure 51. Germany High-Performance Trucks Market Share (%), By Fuel Type, 2017-2031F
- Figure 52. Germany High-Performance Trucks Market Share (%), By Power Output, 2017-2031F
- Figure 53. France High-Performance Trucks Market, By Value, In USD Billion, 2017-2031F
- Figure 54. France High-Performance Trucks Market, By Volume, In Units, 2017-2031F
- Figure 55. France High-Performance Trucks Market Share (%), By Type, 2017-2031F
- Figure 56. France High-Performance Trucks Market Share (%), By Transmission, 2017-2031F
- Figure 57. France High-Performance Trucks Market Share (%), By Application, 2017-2031F
- Figure 58. France High-Performance Trucks Market Share (%), By Fuel Type, 2017-2031F
- Figure 59. France High-Performance Trucks Market Share (%), By Power Output, 2017-2031F
- Figure 60. Italy High-Performance Trucks Market, By Value, In USD Billion, 2017-2031F
- Figure 61. Italy High-Performance Trucks Market, By Volume, In Units, 2017-2031F
- Figure 62. Italy High-Performance Trucks Market Share (%), By Type, 2017-2031F
- Figure 63. Italy High-Performance Trucks Market Share (%), By Transmission, 2017-2031F
- Figure 64. Italy High-Performance Trucks Market Share (%), By Application, 2017-2031F
- Figure 65. Italy High-Performance Trucks Market Share (%), By Fuel Type, 2017-2031F
- Figure 66. Italy High-Performance Trucks Market Share (%), By Power Output, 2017-2031F
- Figure 67. United Kingdom High-Performance Trucks Market, By Value, In USD Billion, 2017-2031F
- Figure 68. United Kingdom High-Performance Trucks Market, By Volume, In Units, 2017-2031F
- Figure 69. United Kingdom High-Performance Trucks Market Share (%), By Type, 2017-2031F
- Figure 70. United Kingdom High-Performance Trucks Market Share (%), By Transmission, 2017-2031F
- Figure 71. United Kingdom High-Performance Trucks Market Share (%), By Application, 2017-2031F
- Figure 72. United Kingdom High-Performance Trucks Market Share (%), By Fuel Type, 2017-2031F
- Figure 73. United Kingdom High-Performance Trucks Market Share (%), By Power Output, 2017-2031F
- Figure 74. Russia High-Performance Trucks Market, By Value, In USD Billion, 2017-2031F
- Figure 75. Russia High-Performance Trucks Market, By Volume, In Units, 2017-2031F
- Figure 76. Russia High-Performance Trucks Market Share (%), By Type, 2017-2031F
- Figure 77. Russia High-Performance Trucks Market Share (%), By Transmission, 2017-2031F
- Figure 78. Russia High-Performance Trucks Market Share (%), By Application, 2017-2031F
- Figure 79. Russia High-Performance Trucks Market Share (%), By Fuel Type, 2017-2031F
- Figure 80. Russia High-Performance Trucks Market Share (%), By Power Output, 2017-2031F
- Figure 81. Netherlands High-Performance Trucks Market, By Value, In USD Billion, 2017-2031F
- Figure 82. Netherlands High-Performance Trucks Market, By Volume, In Units, 2017-2031F
- Figure 83. Netherlands High-Performance Trucks Market Share (%), By Type, 2017-2031F
- Figure 84. Netherlands High-Performance Trucks Market Share (%), By Transmission, 2017-2031F
- Figure 85. Netherlands High-Performance Trucks Market Share (%), By Application, 2017-2031F
- Figure 86. Netherlands High-Performance Trucks Market Share (%), By Fuel Type, 2017-2031F
- Figure 87. Netherlands High-Performance Trucks Market Share (%), By Power Output, 2017-2031F
- Figure 88. Spain High-Performance Trucks Market, By Value, In USD Billion, 2017-2031F
- Figure 89. Spain High-Performance Trucks Market, By Volume, In Units, 2017-2031F
- Figure 90. Spain High-Performance Trucks Market Share (%), By Type, 2017-2031F
- Figure 91. Spain High-Performance Trucks Market Share (%), By Transmission, 2017-2031F
- Figure 92. Spain High-Performance Trucks Market Share (%), By Application, 2017-2031F
- Figure 93. Spain High-Performance Trucks Market Share (%), By Fuel Type, 2017-2031F
- Figure 94. Spain High-Performance Trucks Market Share (%), By Power Output, 2017-2031F
- Figure 95. Turkey High-Performance Trucks Market, By Value, In USD Billion, 2017-2031F
- Figure 96. Turkey High-Performance Trucks Market, By Volume, In Units, 2017-2031F
- Figure 97. Turkey High-Performance Trucks Market Share (%), By Type, 2017-2031F
- Figure 98. Turkey High-Performance Trucks Market Share (%), By Transmission, 2017-2031F
- Figure 99. Turkey High-Performance Trucks Market Share (%), By Application, 2017-2031F
- Figure 100. Turkey High-Performance Trucks Market Share (%), By Fuel Type, 2017-2031F
- Figure 101. Turkey High-Performance Trucks Market Share (%), By Power Output, 2017-2031F
- Figure 102. Poland High-Performance Trucks Market, By Value, In USD Billion, 2017-2031F
- Figure 103. Poland High-Performance Trucks Market, By Volume, In Units, 2017-2031F
- Figure 104. Poland High-Performance Trucks Market Share (%), By Type, 2017-2031F
- Figure 105. Poland High-Performance Trucks Market Share (%), By Transmission, 2017-2031F
- Figure 106. Poland High-Performance Trucks Market Share (%), By Application, 2017-2031F
- Figure 107. Poland High-Performance Trucks Market Share (%), By Fuel Type, 2017-2031F
- Figure 108. Poland High-Performance Trucks Market Share (%), By Power Output, 2017-2031F
- Figure 109. South America High-Performance Trucks Market, By Value, In USD Billion, 2017-2031F
- Figure 110. South America High-Performance Trucks Market, By Volume, In Units, 2017-2031F
- Figure 111. South America High-Performance Trucks Market Share (%), By Type, 2017-2031F
- Figure 112. South America High-Performance Trucks Market Share (%), By Transmission, 2017-2031F
- Figure 113. South America High-Performance Trucks Market Share (%), By Application, 2017-2031F
- Figure 114. South America High-Performance Trucks Market Share (%), By Fuel Type, 2017-2031F
- Figure 115. South America High-Performance Trucks Market Share (%), By Power Output, 2017-2031F
- Figure 116. South America High-Performance Trucks Market Share (%), By Country, 2017-2031F
- Figure 117. Brazil High-Performance Trucks Market, By Value, In USD Billion, 2017-2031F
- Figure 118. Brazil High-Performance Trucks Market, By Volume, In Units, 2017-2031F
- Figure 119. Brazil High-Performance Trucks Market Share (%), By Type, 2017-2031F
- Figure 120. Brazil High-Performance Trucks Market Share (%), By Transmission, 2017-2031F
- Figure 121. Brazil High-Performance Trucks Market Share (%), By Application, 2017-2031F
- Figure 122. Brazil High-Performance Trucks Market Share (%), By Fuel Type, 2017-2031F
- Figure 123. Brazil High-Performance Trucks Market Share (%), By Power Output, 2017-2031F
- Figure 124. Argentina High-Performance Trucks Market, By Value, In USD Billion, 2017-2031F
- Figure 125. Argentina High-Performance Trucks Market, By Volume, In Units, 2017-2031F
- Figure 126. Argentina High-Performance Trucks Market Share (%), By Type, 2017-2031F
- Figure 127. Argentina High-Performance Trucks Market Share (%), By Transmission, 2017-2031F
- Figure 128. Argentina High-Performance Trucks Market Share (%), By Application, 2017-2031F
- Figure 129. Argentina High-Performance Trucks Market Share (%), By Fuel Type, 2017-2031F
- Figure 130. Argentina High-Performance Trucks Market Share (%), By Power Output, 2017-2031F
- Figure 131. Asia-Pacific High-Performance Trucks Market, By Value, In USD Billion, 2017-2031F
- Figure 132. Asia-Pacific High-Performance Trucks Market, By Volume, In Units, 2017-2031F
- Figure 133. Asia-Pacific High-Performance Trucks Market Share (%), By Type, 2017-2031F
- Figure 134. Asia-Pacific High-Performance Trucks Market Share (%), By Transmission, 2017-2031F
- Figure 135. Asia-Pacific High-Performance Trucks Market Share (%), By Application, 2017-2031F
- Figure 136. Asia-Pacific High-Performance Trucks Market Share (%), By Fuel Type, 2017-2031F
- Figure 137. Asia- Pacific High-Performance Trucks Market Share (%), By Power Output, 2017-2031F
- Figure 138. Asia-Pacific High-Performance Trucks Market Share (%), By Country, 2017-2031F
- Figure 139. India High-Performance Trucks Market, By Value, In USD Billion, 2017-2031F
- Figure 140. India High-Performance Trucks Market, By Volume, In Units, 2017-2031F
- Figure 141. India High-Performance Trucks Market Share (%), By Type, 2017-2031F
- Figure 142. India High-Performance Trucks Market Share (%), By Transmission, 2017-2031F
- Figure 143. India High-Performance Trucks Market Share (%), By Application, 2017-2031F
- Figure 144. India High-Performance Trucks Market Share (%), By Fuel Type, 2017-2031F
- Figure 145. India High-Performance Trucks Market Share (%), By Power Output, 2017-2031F
- Figure 146. China High-Performance Trucks Market, By Value, In USD Billion, 2017-2031F
- Figure 147. China High-Performance Trucks Market, By Volume, In Units, 2017-2031F
- Figure 148. China High-Performance Trucks Market Share (%), By Type, 2017-2031F
- Figure 149. China High-Performance Trucks Market Share (%), By Transmission, 2017-2031F
- Figure 150. China High-Performance Trucks Market Share (%), By Application, 2017-2031F
- Figure 151. China High-Performance Trucks Market Share (%), By Fuel Type, 2017-2031F
- Figure 152. China High-Performance Trucks Market Share (%), By Power Output, 2017-2031F
- Figure 153. Japan High-Performance Trucks Market, By Value, In USD Billion, 2017-2031F
- Figure 154. Japan High-Performance Trucks Market, By Volume, In Units, 2017-2031F
- Figure 155. Japan High-Performance Trucks Market Share (%), By Type, 2017-2031F
- Figure 156. Japan High-Performance Trucks Market Share (%), By Transmission, 2017-2031F
- Figure 157. Japan High-Performance Trucks Market Share (%), By Application, 2017-2031F
- Figure 158. Japan High-Performance Trucks Market Share (%), By Fuel Type, 2017-2031F
- Figure 159. Japan High-Performance Trucks Market Share (%), By Power Output, 2017-2031F
- Figure 160. Australia High-Performance Trucks Market, By Value, In USD Billion, 2017-2031F
- Figure 161. Australia High-Performance Trucks Market, By Volume, In Units, 2017-2031F
- Figure 162. Australia High-Performance Trucks Market Share (%), By Type, 2017-2031F
- Figure 163. Australia High-Performance Trucks Market Share (%), By Transmission, 2017-2031F
- Figure 164. Australia High-Performance Trucks Market Share (%), By Application, 2017-2031F
- Figure 165. Australia High-Performance Trucks Market Share (%), By Fuel Type, 2017-2031F
- Figure 166. Australia High-Performance Trucks Market Share (%), By Power Output, 2017-2031F
- Figure 167. Vietnam High-Performance Trucks Market, By Value, In USD Billion, 2017-2031F
- Figure 168. Vietnam High-Performance Trucks Market, By Volume, In Units, 2017-2031F
- Figure 169. Vietnam High-Performance Trucks Market Share (%), By Type, 2017-2031F
- Figure 170. Vietnam High-Performance Trucks Market Share (%), By Transmission, 2017-2031F
- Figure 171. Vietnam High-Performance Trucks Market Share (%), By Application, 2017-2031F
- Figure 172. Vietnam High-Performance Trucks Market Share (%), By Fuel Type, 2017-2031F
- Figure 173. Vietnam High-Performance Trucks Market Share (%), By Power Output, 2017-2031F
- Figure 174. South Korea High-Performance Trucks Market, By Value, In USD Billion, 2017-2031F
- Figure 175. South Korea High-Performance Trucks Market, By Volume, In Units, 2017-2031F
- Figure 176. South Korea High-Performance Trucks Market Share (%), By Type, 2017-2031F
- Figure 177. South Korea High-Performance Trucks Market Share (%), By Transmission, 2017-2031F
- Figure 178. South Korea High-Performance Trucks Market Share (%), By Application, 2017-2031F
- Figure 179. South Korea High-Performance Trucks Market Share (%), By Fuel Type, 2017-2031F
- Figure 180. South Korea High-Performance Trucks Market Share (%), By Power Output, 2017-2031F
- Figure 181. Indonesia High-Performance Trucks Market, By Value, In USD Billion, 2017-2031F
- Figure 182. Indonesia High-Performance Trucks Market, By Volume, In Units, 2017-2031F
- Figure 183. Indonesia High-Performance Trucks Market Share (%), By Type, 2017-2031F
- Figure 184. Indonesia High-Performance Trucks Market Share (%), By Transmission, 2017-2031F
- Figure 185. Indonesia High-Performance Trucks Market Share (%), By Application, 2017-2031F
- Figure 186. Indonesia High-Performance Trucks Market Share (%), By Fuel Type, 2017-2031F
- Figure 187. Indonesia High-Performance Trucks Market Share (%), By Power Output, 2017-2031F
- Figure 188. Philippines High-Performance Trucks Market, By Value, In USD Billion, 2017-2031F
- Figure 189. Philippines High-Performance Trucks Market, By Volume, In Units, 2017-2031F
- Figure 190. Philippines High-Performance Trucks Market Share (%), By Type, 2017-2031F
- Figure 191. Philippines High-Performance Trucks Market Share (%), By Transmission, 2017-2031F
- Figure 192. Philippines High-Performance Trucks Market Share (%), By Application, 2017-2031F
- Figure 193. Philippines High-Performance Trucks Market Share (%), By Fuel Type, 2017-2031F
- Figure 194. Philippines High-Performance Trucks Market Share (%), By Power Output, 2017-2031F
- Figure 195. Middle East & Africa High-Performance Trucks Market, By Value, In USD Billion, 2017-2031F
- Figure 196. Middle East & Africa High-Performance Trucks Market, By Volume, In Units, 2017-2031F
- Figure 197. Middle East & Africa High-Performance Trucks Market Share (%), By Type, 2017-2031F
- Figure 198. Middle East & Africa High-Performance Trucks Market Share (%), By Transmission, 2017-2031F
- Figure 199. Middle East & Africa High-Performance Trucks Market Share (%), By Application, 2017-2031F
- Figure 200. Middle East & Africa High-Performance Trucks Market Share (%), By Fuel Type, 2017-2031F
- Figure 201. Middle East & Africa High-Performance Trucks Market Share (%), By Power Output, 2017-2031F
- Figure 202. Middle East & Africa High-Performance Trucks Market Share (%), By Country, 2017-2031F
- Figure 203. Saudi Arabia High-Performance Trucks Market, By Value, In USD Billion, 2017-2031F
- Figure 204. Saudi Arabia High-Performance Trucks Market, By Volume, In Units, 2017-2031F
- Figure 205. Saudi Arabia High-Performance Trucks Market Share (%), By Type, 2017-2031F
- Figure 206. Saudi Arabia High-Performance Trucks Market Share (%), By Transmission, 2017-2031F
- Figure 207. Saudi Arabia High-Performance Trucks Market Share (%), By Application, 2017-2031F
- Figure 208. Saudi Arabia High-Performance Trucks Market Share (%), By Fuel Type, 2017-2031F
- Figure 209. Saudi Arabia High-Performance Trucks Market Share (%), By Power Output, 2017-2031F
- Figure 210. UAE High-Performance Trucks Market, By Value, In USD Billion, 2017-2031F
- Figure 211. UAE High-Performance Trucks Market, By Volume, In Units, 2017-2031F
- Figure 212. UAE High-Performance Trucks Market Share (%), By Type, 2017-2031F
- Figure 213. UAE High-Performance Trucks Market Share (%), By Transmission, 2017-2031F
- Figure 214. UAE High-Performance Trucks Market Share (%), By Application, 2017-2031F
- Figure 215. UAE High-Performance Trucks Market Share (%), By Fuel Type, 2017-2031F
- Figure 216. UAE High-Performance Trucks Market Share (%), By Power Output, 2017-2031F
- Figure 217. South Africa High-Performance Trucks Market, By Value, In USD Billion, 2017-2031F
- Figure 218. South Africa High-Performance Trucks Market, By Volume, In Units, 2017-2031F
- Figure 219. South Africa High-Performance Trucks Market Share (%), By Type, 2017-2031F
- Figure 220. South Africa High-Performance Trucks Market Share (%), By Transmission, 2017-2031F
- Figure 221. South Africa High-Performance Trucks Market Share (%), By Application, 2017-2031F
- Figure 222. South Africa High-Performance Trucks Market Share (%), By Fuel Type, 2017-2031F
- Figure 223. South Africa High-Performance Trucks Market Share (%), By Power Output, 2017-2031F
- Figure 224. By Type Map-Market Size (USD Billion) & Growth Rate (%), 2023
- Figure 225. By Transmission Map-Market Size (USD Billion) & Growth Rate (%), 2023
- Figure 226. By Application Map-Market Size (USD Billion) & Growth Rate (%), 2023
- Figure 227. By Fuel Type Map-Market Size (USD Billion) & Growth Rate (%), 2023
- Figure 228. By Power Output Map-Market Size (USD Billion) & Growth Rate (%), 2023
- Figure 229. By Region Map-Market Size (USD Billion) & Growth Rate (%), 2023
Global high-performance trucks market is projected to observe a CAGR of 7.69% during the forecast period 2024-2031, rising from USD 86.50 billion in 2023 to USD 156.47 billion in 2031. The market has observed growth in recent years and is estimated to maintain a strong pace of expansion in the coming years due to rising requirement for high-performance trucks in different industries comprising agriculture, mining, logistics, and others, rise in technological advancements, rapid expansion of e-commerce industry, and significant increase in regulatory assistance. The need for high-performance trucks is growing significantly as it offers efficient and consistent transportation solutions in e-commerce and other industries.
Also, the expansion in the e-commerce sector has positively impacted the global high-performance trucks market growth as in present times more customers prefer online shopping. The rising requirement for trucks for special applications and fuel-efficient transportation of goods has surged the global high-performance truck demand across the globe in the forecast period. Furthermore, the considerable increase in investments in vehicle customization and personalization to improve the performance of trucks is fostering the expansion of the high-performance trucks market.
In addition, across emerging countries, the government is upgrading road infrastructure which would help to increase the effectiveness of transporting goods as these trucks are suggestively preferable for long-distance transportation on enhanced highways as they can handle heavy loads certainly and can maintain higher speeds.
For instance, in February 2024, Tata Motors Limited announced the launch of versatile heavy-duty trucks across South Africa to fulfill the rising requirement for smarter, safer, and greener cargo mobility. These trucks offer a dependable solution to securely carry heavy loads over long distances and rough terrains.
Launch of Electric Trucks Drive the Global High-Performance Trucks Market Growth
The demand for electric trucks is rising significantly due to increasing awareness concerning sustainable environment, favorable governmental policies concerning zero carbon emission, and a rapid shift towards eco-friendly transportation. The strict government regulations concerning carbon emission, rising investment by legal authorities in charging infrastructure, and production of high-performance trucks featuring advanced emissions control systems are projected to drive the global high-performance trucks market growth in the forecast period. Automakers in the automotive market are advancing the prevailing high-performance trucks and launching advanced trucks owing to the surging urbanization and rising demand for electric trucks.
For instance, in April 2024, Daimler India Commercial Vehicles Pvt. Ltd. announced the introduction of its first electric truck by 2025 to enter the electric commercial vehicle segment. They are planning to make carbon-neutral trucks and buses globally by 2050.
Demand for Refrigerated High-Performance Trucks Pushes the Global High-Performance Trucks Market
The growing demand for refrigerated high-performance trucks drives global market growth as they help maintain the cold chain and confirm the quality and safety of perishable foodstuffs. Restaurants and hotels considerably prefer refrigerated high-performance trucks as they allow for the control of internal temperature coupled with delivery times, which further aid in improving and preserving the shelf life of food. In addition, market participants are efficiently using refrigerated high-performance trucks to preserve food quality and reduce health threats coupled with sustaining proper temperatures. Furthermore, key participants are unveiling new refrigerated high-performance trucks to address the increasing requirement for refrigerated high-performance trucks.
For instance, in June 2024, GS Global Corp revealed the launch of BYD Company Ltd.'s 1-ton electric truck, the T4K Refrigerated Truck, enabling travel of 205 km at room temperature and 164 km at low temperatures.
Favorable Government Regulations Drives the Global Market Growth
In emerging countries, governments are significantly developing road infrastructure and increasing investment in infrastructural activities, projected to drive global market growth. Also, governments across emerging countries are motivating the adoption of electric trucks and funding in building infrastructure for electric trucks, fueling the global high-performance trucks market demand. In addition, changes in government regulations concerning the zero-carbon emission control from heavy vehicles and rise in fuel prices are projected to surge the electrification of these trucks. Furthermore, support from the government and attractive subsidies by legal authorities for the sale and purchase of electric vehicles are key factors fostering the prevalence of high-performance electric trucks.
For instance, in May 2024, the government of India announced incentives for heavy-duty electric trucks to reduce diesel trucks and aid the steel, cement, and mining industries in transitioning from carbon-emitting HCVs that run on diesel.
Pickup Trucks Registers the Largest Global High-Performance Trucks Market Share
Pickup trucks dominate the largest market share in the global market owing to their multifaceted utility, comfortable daily drives, and dependable workhorses. These trucks are equipped with innovative features including in-bed trunk systems, and multi-configuration tailgates which drive the segmental growth. In addition, manufacturers in the global market are significantly integrating four-by-four drivetrains and terrain management systems to provide utility and joyride coupled with safety. Furthermore, the growing requirements for pickup trucks are increasing as manufacturers are making technological advancements comprising adaptive cruise control, autonomous emerging braking systems, and others. Also, manufacturers are introducing new pickup trucks to address the growing prevalence of online shopping.
For instance, in May 2024, BYD Company Ltd. announced the launch of its first pickup truck BYD SHARK in Mexico to redefine the global plug-in hybrid pickup market with advanced technology and different user-centric features.
Asia-Pacific Dominates the Largest Global High-Performance Trucks Market Size
Asia-Pacific dominates the largest market size in the global market due to expansion in the mining and construction sector, the rising number of infrastructural development projects, and presence of the major players across the emerging countries. In emerging countries, there is a rapid trend of personalization and customization in high-performance trucks, propelling the global market growth in the forecast period. Governments across developing countries, including India and China are framing policies and rules to decrease carbon footprints and promoting the adoption of hybrid and electric powertrains. Key companies in the global market are significantly collaborating to expand their market presence and hold the largest market share in the global market.
For instance, in July 2022, Pony.ai, Inc. announced its partnership with Sany Heavy Industry Co., Ltd., China's largest heavy equipment manufacturer to jointly introduce level 4 autonomous trucks, to increase the share of alternative powertrains over time.
Future Market Scenario (2024 - 2031F)
The significant rise in demand for durable and enhanced power output engines for carrying heavy loads, due to the rise in applications demanding power output and high torque is projected to propel the need for high-performance trucks.
The global market growth is propelled by a growing requirement for efficient off-roading experience in trucks for heavy load carrying and commercial purposes.
Expansion in the e-commerce and logistics sector drives the demand for global high-performance trucks market growth.
The increase in the requirement for electric vehicles in high-performance trucks and infrastructural developments globally are estimated to propel the high-performance trucks market' growth.
Key Players Landscape and Outlook
Key participants in the global high-performance trucks market are planning to invest significantly in different research and development activities to bring advancements in technologies and enhance the functioning of high-performance trucks. Companies are offering different high-performance truck models with innovative technology to gain a competitive edge and expand their product portfolios. In addition, key companies in the market are adopting different growth strategies including mergers and acquisitions, product launches, collaboration, partnerships, and others to expand their footprint.
For instance, in December 2023, Tata Motors announced the launch of High-Performance Trucks for affordable and smart transport to the evolving requirements of customers.
For instance, in January 2023, BharatBenz (Daimler Truck AG) announced the launch of high-performance construction and mining trucks at bC India 2023 to contribute towards nation-building.
Table of Contents
1. Research Methodology
2. Project Scope and Definitions
3. Executive Summary
4. Voice of Customer
- 4.1. Product and Market Intelligence
- 4.2. Mode of Brand Awareness
- 4.3. Factors Considered in Purchase Decisions
- 4.3.1. Features and other value-added service
- 4.3.2. Compatibility and Durability
- 4.3.3. Efficiency of Solutions
- 4.3.4. After-Sales Assistance
- 4.4. Consideration of Privacy and Safety Regulations
5. Global High-Performance Trucks Market Outlook, 2017-2031F
- 5.1. Market Size & Forecast
- 5.1.1. By Value
- 5.1.2. By Volume
- 5.2. By Type
- 5.2.1. Pickup Trucks
- 5.2.2. Medium and Heavy Trucks
- 5.3. By Transmission
- 5.3.1. Automatic
- 5.3.2. Semi-Automatic
- 5.3.3. Manual
- 5.4. By Application
- 5.4.1. Refrigeration
- 5.4.2. Dumping
- 5.4.3. Tanker
- 5.4.4. Container
- 5.4.5. Others
- 5.5. By Fuel Type
- 5.5.1. Gasoline
- 5.5.2. Diesel
- 5.5.3. Others
- 5.6. By Power Output
- 5.6.1. 250 to 500hp
- 5.6.2. Above 500hp
- 5.7. By Region
- 5.7.1. North America
- 5.7.2. Europe
- 5.7.3. Asia-Pacific
- 5.7.4. South America
- 5.7.5. Middle East and Africa
- 5.8. By Company Market Share (%), 2023
6. Global High-Performance Trucks Market Outlook, By Region, 2017-2031F
- 6.1. North America*
- 6.1.1. Market Size & Forecast
- 6.1.1.1. By Value
- 6.1.1.2. By Volume
- 6.1.2. By Type
- 6.1.2.1. Pickup Trucks
- 6.1.2.2. Medium and Heavy Trucks
- 6.1.3. By Transmission
- 6.1.3.1. Automatic
- 6.1.3.2. Semi-Automatic
- 6.1.3.3. Manual
- 6.1.4. By Application
- 6.1.4.1. Refrigeration
- 6.1.4.2. Dumping
- 6.1.4.3. Tanker
- 6.1.4.4. Container
- 6.1.4.5. Others
- 6.1.5. By Fuel Type
- 6.1.5.1. Gasoline
- 6.1.5.2. Diesel
- 6.1.5.3. Others
- 6.1.6. By Fuel Type
- 6.1.6.1. 250 to 500hp
- 6.1.6.2. Above 500hp
- 6.1.7. United States*
- 6.1.7.1. Market Size & Forecast
- 6.1.7.1.1. By Value
- 6.1.7.1.2. By Volume
- 6.1.7.2. By Type
- 6.1.7.2.1. Pickup Trucks
- 6.1.7.2.2. Medium and Heavy Trucks
- 6.1.7.3. By Transmission
- 6.1.7.3.1. Automatic
- 6.1.7.3.2. Semi-Automatic
- 6.1.7.3.3. Manual
- 6.1.7.4. By Application
- 6.1.7.4.1. Refrigeration
- 6.1.7.4.2. Dumping
- 6.1.7.4.3. Tanker
- 6.1.7.4.4. Container
- 6.1.7.4.5. Others
- 6.1.7.5. By Fuel Type
- 6.1.7.5.1. Gasoline
- 6.1.7.5.2. Diesel
- 6.1.7.5.3. Others
- 6.1.7.6. By Power Output
- 6.1.7.6.1. 250 to 500hp
- 6.1.7.6.2. Above 500hp
- 6.1.7.1. Market Size & Forecast
- 6.1.8. Canada
- 6.1.9. Mexico
- 6.1.1. Market Size & Forecast
All segments will be provided for all regions and countries covered
- 6.2. Europe
- 6.2.1. Germany
- 6.2.2. France
- 6.2.3. Italy
- 6.2.4. United Kingdom
- 6.2.5. Russia
- 6.2.6. Netherlands
- 6.2.7. Spain
- 6.2.8. Turkey
- 6.2.9. Poland
- 6.3. Asia-Pacific
- 6.3.1. India
- 6.3.2. China
- 6.3.3. Japan
- 6.3.4. Australia
- 6.3.5. Vietnam
- 6.3.6. South Korea
- 6.3.7. Indonesia
- 6.3.8. Philippines
- 6.4. South America
- 6.4.1. Brazil
- 6.4.2. Argentina
- 6.5. Middle East and Africa
- 6.5.1. Saudi Arabia
- 6.5.2. UAE
- 6.5.3. South Africa
7. Market Mapping, 2023
- 7.1. By Type
- 7.2. By Transmission
- 7.3. By Application
- 7.4. By Fuel Type
- 7.5. By Power Output
- 7.6. By Region
8. Macro Environment and Industry Structure
- 8.1. Demand Supply Analysis
- 8.2. Import Export Analysis
- 8.3. Value Chain Analysis
- 8.4. PESTEL Analysis
- 8.4.1. Political Factors
- 8.4.2. Economic System
- 8.4.3. Social Implications
- 8.4.4. Technological Advancements
- 8.4.5. Environmental Impacts
- 8.4.6. Legal Compliances and Regulatory Policies (Statutory Bodies Included)
- 8.5. Porter's Five Forces Analysis
- 8.5.1. Supplier Power
- 8.5.2. Buyer Power
- 8.5.3. Substitution Threat
- 8.5.4. Threat from New Entrant
- 8.5.5. Competitive Rivalry
9. Market Dynamics
- 9.1. Growth Drivers
- 9.2. Growth Inhibitors (Challenges and Restraints)
10. Key Players Landscape
- 10.1. Competition Matrix of Top Five Market Leaders
- 10.2. Market Revenue Analysis of Top Five Market Leaders (By Value, 2023)
- 10.3. Mergers and Acquisitions/Joint Ventures (If Applicable)
- 10.4. SWOT Analysis (For Five Market Players)
- 10.5. Patent Analysis (If Applicable)
11. Pricing Analysis
12. Case Studies
13. Key Players Outlook
- 13.1. Tata Motors Limited
- 13.1.1. Company Details
- 13.1.2. Key Management Personnel
- 13.1.3. Products and Services
- 13.1.4. Financials (As Reported)
- 13.1.5. Key Market Focus and Geographical Presence
- 13.1.6. Recent Developments
- 13.2. Ford Motor Company
- 13.3. General Motors
- 13.4. ISUZU MOTORS LIMITED
- 13.5. Hino Motors, Ltd
- 13.6. Mitsubishi Motors North America, Inc.
- 13.7. Toyota Kirloskar Motor
- 13.8. Dongfeng Motor Company
- 13.9. Iveco Limited
- 13.10. Volvo Group
- 13.11. BMW AG
- 13.12. Daimler Truck AG
Companies mentioned above DO NOT hold any order as per market share and can be changed as per information available during research work.
