|
|
市場調査レポート
商品コード
1499984
産業用手袋市場の評価:製品・材料・コーティング・エンドユーザー産業・販売チャネル・地域別の機会および予測 (2017-2031年)Industrial Gloves Market Assessment, By Product, By Material, By Coating By End-use Industry, By Sales Channel, By Region, Opportunities and Forecast, 2017-2031F |
||||||
|
|||||||
カスタマイズ可能
|
|||||||

| 産業用手袋市場の評価:製品・材料・コーティング・エンドユーザー産業・販売チャネル・地域別の機会および予測 (2017-2031年) |
|
出版日: 2024年06月25日
発行: Markets & Data
ページ情報: 英文 231 Pages
納期: 3~5営業日
|

全表示
- 概要
- 図表
- 目次
世界の産業用手袋の市場規模は、2023年の108億3,000万米ドルから、予測期間中はCAGR 8.85%で推移し、2031年には213億4,000万米ドルの規模に成長すると予測されています。
厳しい労働安全政策と健康被害に対する意識の高まりにより、市場は力強い成長率で推移しています。
産業安全は、意識の高まりと政府のコンプライアンスにより、長年にわたり極めて重要なものとなっています。化学実験室から製造スペースに至るまで、作業員の安全性への焦点が、世界の産業用手袋市場を含む産業用安全ギア産業を活性化しています。より優れたグリップ力、厚さ、インナーライナー、静電気放電、耐薬品性、耐切創性などの特殊機能を備えた産業用手袋が、材料や生産技術の進歩により開発されています。ケブラー、ダイニーマ、ステンレス鋼繊維からなる耐切創性手袋は、切り傷や刺し傷から作業員を守るため、製造、建設、金属加工を含む産業からの需要が高いです。世界中の新たな顧客を獲得するため、企業はeコマースやその他のプラットフォームを通じて販売チャネルを拡大しています。
持続可能な手袋とカスタマイズが市場成長を後押し:
手袋が環境に与える影響への懸念から、産業用手袋の製造工程は持続可能で環境に優しい材料を使用する方向にシフトしています。産業用手袋の技術革新は材料技術の開発によって推進されており、その結果、グリップ力の向上、柔軟性の向上、耐薬品性の向上、耐熱性の向上を実現した手袋が生み出されています。手袋メーカーは、カスタマイズされた手袋ソリューションを提供することで、労働者の嗜好、業界のニーズ、サイズ、フィット感、色、ブランドに対応しています。カスタマイズにより、生産者はグリップパターン、抵抗レベル、コーティング、サイズに関するものなど、特定の業界の要求を満たす特別なソリューションを提供することができます。これにより、手袋はさまざまな分野の労働者のニーズと危険性を満たすために特別に作られることが保証されます。新しい手袋ベンダーは、持続可能な材料を使用し、持続可能な手袋を製造しています。
世界市場の拡大の促進要因となる厳しい政府政策とコンプライアンス:
労働安全衛生局 (OSHA) は、産業や関連するリスクに応じて安全基準を導入・改定しています。十分な手の保護は必要不可欠であり、従業員が安全に職務を遂行するために必要なPPEを供給するのは雇用者の責任です。各作業員の手を保護するために必要な手袋をすべてストックしておくこともその一環です。
当レポートでは、世界の産業用手袋の市場を調査し、市場の定義と概要、市場規模の推移・予測、各種区分・地域別の詳細分析、産業構造、市場成長への影響因子の分析、ケーススタディ、競合情勢、主要企業のプロファイルなどをまとめています。
目次
第1章 調査手法
第2章 プロジェクトの範囲と定義
第3章 エグゼクティブサマリー
第4章 顧客の声
- 製品と市場の情報
- ブランド認知モード
- 購入決定時に考慮される要素
- プライバシーと安全規制の考慮
第5章 世界の産業用手袋市場の展望
- 市場規模・予測
- 製品別
- 使い捨て手袋
- 再利用可能手袋
- 材料別
- ゴム
- ビニール
- ネオプレン
- ポリエチレン
- スペクトラ繊維
- その他
- コーティング別
- フラットニトリル
- マイクロポアフォームニトリル
- ラテックス
- その他
- エンドユーザー産業別
- 医薬品
- 自動車・輸送
- 食品・飲料
- 石油・ガス
- 鉱業
- 化学薬品
- その他
- 販売チャネル別
- 直接
- 間接
- 地域別
- 北米
- 欧州
- アジア太平洋
- 南米
- 中東・アフリカ
- 企業別市場シェア
第6章 世界の産業用手袋市場の展望:地域別
- 北米
- 欧州
- アジア太平洋
- 南米
- 中東・アフリカ
第7章 市場マッピング、2023年
- 製品別
- 材料別
- コーティング別
- エンドユーザー産業別
- 販売チャネル別
- 地域別
第8章 マクロ環境と産業構造
- 需給分析
- 輸出入分析
- バリューチェーン分析
- PESTEL分析
- ポーターのファイブフォース分析
第9章 市場力学
- 成長推進因子
- 成長阻害因子 (課題・制約)
第10章 主要企業の情勢
- 市場リーダー上位5社の競合マトリックス
- 市場リーダー上位5社の市場収益分析
- M&A・ジョイントベンチャー (該当する場合)
- SWOT分析 (参入5社)
- 特許分析 (該当する場合)
第11章 価格分析
第12章 ケーススタディ
第13章 主要企業の展望
- Honeywell International Inc.
- 3M Company
- Kimberly-Clark Corporation
- Ansell Limited
- Showa Glove Co.
- Hartalega Holdings Bhd
- urvex Group
- W. W. Grainger Inc.
- Mechanix Wear Inc.
- Carolina Glove & Safety Company
第14章 戦略的提言
第15章 当社について・免責事項
List of Tables
- Table 1. Pricing Analysis of Products from Key Players
- Table 2. Competition Matrix of Top 5 Market Leaders
- Table 3. Mergers & Acquisitions/ Joint Ventures (If Applicable)
- Table 4. About Us - Regions and Countries Where We Have Executed Client Projects
List of Figures
- Figure 1. Global Industrial Gloves Market, By Value, In USD Billion, 2017-2031F
- Figure 2. Global Industrial Gloves Market, By Volume, In Units, 2017-2031F
- Figure 3. Global Industrial Gloves Market Share (%), By Product, 2017-2031F
- Figure 4. Global Industrial Gloves Market Share (%), By Material, 2017-2031F
- Figure 5. Global Industrial Gloves Market Share (%), By Coating, 2017-2031F
- Figure 6. Global Industrial Gloves Market Share (%), By End-use Industry, 2017-2031F
- Figure 7. Global Industrial Gloves Market Share (%), By Sales Channel, 2017-2031F
- Figure 8. Global Industrial Gloves Market Share (%), By Region, 2017-2031F
- Figure 9. North America Industrial Gloves Market, By Value, In USD Billion, 2017-2031F
- Figure 10. North America Industrial Gloves Market, By Volume, In Units, 2017-2031F
- Figure 11. North America Industrial Gloves Market Share (%), By Product, 2017-2031F
- Figure 12. North America Industrial Gloves Market Share (%), By Material, 2017-2031F
- Figure 13. North America Industrial Gloves Market Share (%), By Coating, 2017-2031F
- Figure 14. North America Industrial Gloves Market Share (%), By End-use Industry, 2017-2031F
- Figure 15. North America Industrial Gloves Market Share (%), By Sales Channel, 2017-2031F
- Figure 16. North America Industrial Gloves Market Share (%), By Country, 2017-2031F
- Figure 17. United States Industrial Gloves Market, By Value, In USD Billion, 2017-2031F
- Figure 18. United States Industrial Gloves Market, By Volume, In Units, 2017-2031F
- Figure 19. United States Industrial Gloves Market Share (%), By Product, 2017-2031F
- Figure 20. United States Industrial Gloves Market Share (%), By Material, 2017-2031F
- Figure 21. United States Industrial Gloves Market Share (%), By Coating, 2017-2031F
- Figure 22. United States Industrial Gloves Market Share (%), By End-use Industry, 2017-2031F
- Figure 23. United States Industrial Gloves Market Share (%), By Sales Channel, 2017-2031F
- Figure 24. Canada Industrial Gloves Market, By Value, In USD Billion, 2017-2031F
- Figure 25. Canada Industrial Gloves Market, By Volume, In Units, 2017-2031F
- Figure 26. Canada Industrial Gloves Market Share (%), By Product, 2017-2031F
- Figure 27. Canada Industrial Gloves Market Share (%), By Material, 2017-2031F
- Figure 28. Canada Industrial Gloves Market Share (%), By Coating, 2017-2031F
- Figure 29. Canada Industrial Gloves Market Share (%), By End-use Industry, 2017-2031F
- Figure 30. Canada Industrial Gloves Market Share (%), By Sales Channel, 2017-2031F
- Figure 31. Mexico Industrial Gloves Market, By Value, In USD Billion, 2017-2031F
- Figure 32. Mexico Industrial Gloves Market, By Volume, In Units, 2017-2031F
- Figure 33. Mexico Industrial Gloves Market Share (%), By Product, 2017-2031F
- Figure 34. Mexico Industrial Gloves Market Share (%), By Material, 2017-2031F
- Figure 35. Mexico Industrial Gloves Market Share (%), By Coating, 2017-2031F
- Figure 36. Mexico Industrial Gloves Market Share (%), By End-use Industry, 2017-2031F
- Figure 37. Mexico Industrial Gloves Market Share (%), By Sales Channel, 2017-2031F
- Figure 38. Europe Industrial Gloves Market, By Value, In USD Billion, 2017-2031F
- Figure 39. Europe Industrial Gloves Market, By Volume, In Units, 2017-2031F
- Figure 40. Europe Industrial Gloves Market Share (%), By Product, 2017-2031F
- Figure 41. Europe Industrial Gloves Market Share (%), By Material, 2017-2031F
- Figure 42. Europe Industrial Gloves Market Share (%), By Coating, 2017-2031F
- Figure 43. Europe Industrial Gloves Market Share (%), By End-use Industry, 2017-2031F
- Figure 44. Europe Industrial Gloves Market Share (%), By Sales Channel, 2017-2031F
- Figure 45. Europe Industrial Gloves Market Share (%), By Country, 2017-2031F
- Figure 46. Germany Industrial Gloves Market, By Value, In USD Billion, 2017-2031F
- Figure 47. Germany Industrial Gloves Market, By Volume, In Units, 2017-2031F
- Figure 48. Germany Industrial Gloves Market Share (%), By Product, 2017-2031F
- Figure 49. Germany Industrial Gloves Market Share (%), By Material, 2017-2031F
- Figure 50. Germany Industrial Gloves Market Share (%), By Coating, 2017-2031F
- Figure 51. Germany Industrial Gloves Market Share (%), By End-use Industry, 2017-2031F
- Figure 52. Germany Industrial Gloves Market Share (%), By Sales Channel, 2017-2031F
- Figure 53. France Industrial Gloves Market, By Value, In USD Billion, 2017-2031F
- Figure 54. France Industrial Gloves Market, By Volume, In Units, 2017-2031F
- Figure 55. France Industrial Gloves Market Share (%), By Product, 2017-2031F
- Figure 56. France Industrial Gloves Market Share (%), By Material, 2017-2031F
- Figure 57. France Industrial Gloves Market Share (%), By Coating, 2017-2031F
- Figure 58. France Industrial Gloves Market Share (%), By End-use Industry, 2017-2031F
- Figure 59. France Industrial Gloves Market Share (%), By Sales Channel, 2017-2031F
- Figure 60. Italy Industrial Gloves Market, By Value, In USD Billion, 2017-2031F
- Figure 61. Italy Industrial Gloves Market, By Volume, In Units, 2017-2031F
- Figure 62. Italy Industrial Gloves Market Share (%), By Product, 2017-2031F
- Figure 63. Italy Industrial Gloves Market Share (%), By Material, 2017-2031F
- Figure 64. Italy Industrial Gloves Market Share (%), By Coating, 2017-2031F
- Figure 65. Italy Industrial Gloves Market Share (%), By End-use Industry, 2017-2031F
- Figure 66. Italy Industrial Gloves Market Share (%), By Sales Channel, 2017-2031F
- Figure 67. United Kingdom Industrial Gloves Market, By Value, In USD Billion, 2017-2031F
- Figure 68. United Kingdom Industrial Gloves Market, By Volume, In Units, 2017-2031F
- Figure 69. United Kingdom Industrial Gloves Market Share (%), By Product, 2017-2031F
- Figure 70. United Kingdom Industrial Gloves Market Share (%), By Material, 2017-2031F
- Figure 71. United Kingdom Industrial Gloves Market Share (%), By Coating, 2017-2031F
- Figure 72. United Kingdom Industrial Gloves Market Share (%), By End-use Industry, 2017-2031F
- Figure 73. United Kingdom Industrial Gloves Market Share (%), By Sales Channel, 2017-2031F
- Figure 74. Russia Industrial Gloves Market, By Value, In USD Billion, 2017-2031F
- Figure 75. Russia Industrial Gloves Market, By Volume, In Units, 2017-2031F
- Figure 76. Russia Industrial Gloves Market Share (%), By Product, 2017-2031F
- Figure 77. Russia Industrial Gloves Market Share (%), By Material, 2017-2031F
- Figure 78. Russia Industrial Gloves Market Share (%), By Coating, 2017-2031F
- Figure 79. Russia Industrial Gloves Market Share (%), By End-use Industry, 2017-2031F
- Figure 80. Russia Industrial Gloves Market Share (%), By Sales Channel, 2017-2031F
- Figure 81. Netherlands Industrial Gloves Market, By Value, In USD Billion, 2017-2031F
- Figure 82. Netherlands Industrial Gloves Market, By Volume, In Units, 2017-2031F
- Figure 83. Netherlands Industrial Gloves Market Share (%), By Product, 2017-2031F
- Figure 84. Netherlands Industrial Gloves Market Share (%), By Material, 2017-2031F
- Figure 85. Netherlands Industrial Gloves Market Share (%), By Coating, 2017-2031F
- Figure 86. Netherlands Industrial Gloves Market Share (%), By End-use Industry, 2017-2031F
- Figure 87. Netherlands Industrial Gloves Market Share (%), By Sales Channel, 2017-2031F
- Figure 88. Spain Industrial Gloves Market, By Value, In USD Billion, 2017-2031F
- Figure 89. Spain Industrial Gloves Market, By Volume, In Units, 2017-2031F
- Figure 90. Spain Industrial Gloves Market Share (%), By Product, 2017-2031F
- Figure 91. Spain Industrial Gloves Market Share (%), By Material, 2017-2031F
- Figure 92. Spain Industrial Gloves Market Share (%), By Coating, 2017-2031F
- Figure 93. Spain Industrial Gloves Market Share (%), By End-use Industry, 2017-2031F
- Figure 94. Spain Industrial Gloves Market Share (%), By Sales Channel, 2017-2031F
- Figure 95. Turkey Industrial Gloves Market, By Value, In USD Billion, 2017-2031F
- Figure 96. Turkey Industrial Gloves Market, By Volume, In Units, 2017-2031F
- Figure 97. Turkey Industrial Gloves Market Share (%), By Product, 2017-2031F
- Figure 98. Turkey Industrial Gloves Market Share (%), By Material, 2017-2031F
- Figure 99. Turkey Industrial Gloves Market Share (%), By Coating, 2017-2031F
- Figure 100. Turkey Industrial Gloves Market Share (%), By End-use Industry, 2017-2031F
- Figure 101. Turkey Industrial Gloves Market Share (%), By Sales Channel, 2017-2031F
- Figure 102. Poland Industrial Gloves Market, By Value, In USD Billion, 2017-2031F
- Figure 103. Poland Industrial Gloves Market, By Volume, In Units, 2017-2031F
- Figure 104. Poland Industrial Gloves Market Share (%), By Product, 2017-2031F
- Figure 105. Poland Industrial Gloves Market Share (%), By Material, 2017-2031F
- Figure 106. Poland Industrial Gloves Market Share (%), By Coating, 2017-2031F
- Figure 107. Poland Industrial Gloves Market Share (%), By End-use Industry, 2017-2031F
- Figure 108. Poland Industrial Gloves Market Share (%), By Sales Channel, 2017-2031F
- Figure 109. South America Industrial Gloves Market, By Value, In USD Billion, 2017-2031F
- Figure 110. South America Industrial Gloves Market, By Volume, In Units, 2017-2031F
- Figure 111. South America Industrial Gloves Market Share (%), By Product, 2017-2031F
- Figure 112. South America Industrial Gloves Market Share (%), By Material, 2017-2031F
- Figure 113. South America Industrial Gloves Market Share (%), By Coating, 2017-2031F
- Figure 114. South America Industrial Gloves Market Share (%), By End-use Industry, 2017-2031F
- Figure 115. South America Industrial Gloves Market Share (%), By Sales Channel, 2017-2031F
- Figure 116. South America Industrial Gloves Market Share (%), By Country, 2017-2031F
- Figure 117. Brazil Industrial Gloves Market, By Value, In USD Billion, 2017-2031F
- Figure 118. Brazil Industrial Gloves Market, By Volume, In Units, 2017-2031F
- Figure 119. Brazil Industrial Gloves Market Share (%), By Product, 2017-2031F
- Figure 120. Brazil Industrial Gloves Market Share (%), By Material, 2017-2031F
- Figure 121. Brazil Industrial Gloves Market Share (%), By Coating, 2017-2031F
- Figure 122. Brazil Industrial Gloves Market Share (%), By End-use Industry, 2017-2031F
- Figure 123. Brazil Industrial Gloves Market Share (%), By Sales Channel, 2017-2031F
- Figure 124. Argentina Industrial Gloves Market, By Value, In USD Billion, 2017-2031F
- Figure 125. Argentina Industrial Gloves Market, By Volume, In Units, 2017-2031F
- Figure 126. Argentina Industrial Gloves Market Share (%), By Product, 2017-2031F
- Figure 127. Argentina Industrial Gloves Market Share (%), By Material, 2017-2031F
- Figure 128. Argentina Industrial Gloves Market Share (%), By Coating, 2017-2031F
- Figure 129. Argentina Industrial Gloves Market Share (%), By End-use Industry, 2017-2031F
- Figure 130. Argentina Industrial Gloves Market Share (%), By Sales Channel, 2017-2031F
- Figure 131. Asia-Pacific Industrial Gloves Market, By Value, In USD Billion, 2017-2031F
- Figure 132. Asia-Pacific Industrial Gloves Market, By Volume, In Units, 2017-2031F
- Figure 133. Asia-Pacific Industrial Gloves Market Share (%), By Product, 2017-2031F
- Figure 134. Asia-Pacific Industrial Gloves Market Share (%), By Material, 2017-2031F
- Figure 135. Asia-Pacific Industrial Gloves Market Share (%), By Coating, 2017-2031F
- Figure 136. Asia-Pacific Industrial Gloves Market Share (%), By End-use Industry, 2017-2031F
- Figure 137. Asia- Pacific Industrial Gloves Market Share (%), By Sales Channel, 2017-2031F
- Figure 138. Asia-Pacific Industrial Gloves Market Share (%), By Country, 2017-2031F
- Figure 139. India Industrial Gloves Market, By Value, In USD Billion, 2017-2031F
- Figure 140. India Industrial Gloves Market, By Volume, In Units, 2017-2031F
- Figure 141. India Industrial Gloves Market Share (%), By Product, 2017-2031F
- Figure 142. India Industrial Gloves Market Share (%), By Material, 2017-2031F
- Figure 143. India Industrial Gloves Market Share (%), By Coating, 2017-2031F
- Figure 144. India Industrial Gloves Market Share (%), By End-use Industry, 2017-2031F
- Figure 145. India Industrial Gloves Market Share (%), By Sales Channel, 2017-2031F
- Figure 146. China Industrial Gloves Market, By Value, In USD Billion, 2017-2031F
- Figure 147. China Industrial Gloves Market, By Volume, In Units, 2017-2031F
- Figure 148. China Industrial Gloves Market Share (%), By Product, 2017-2031F
- Figure 149. China Industrial Gloves Market Share (%), By Material, 2017-2031F
- Figure 150. China Industrial Gloves Market Share (%), By Coating, 2017-2031F
- Figure 151. China Industrial Gloves Market Share (%), By End-use Industry, 2017-2031F
- Figure 152. China Industrial Gloves Market Share (%), By Sales Channel, 2017-2031F
- Figure 153. Japan Industrial Gloves Market, By Value, In USD Billion, 2017-2031F
- Figure 154. Japan Industrial Gloves Market, By Volume, In Units, 2017-2031F
- Figure 155. Japan Industrial Gloves Market Share (%), By Product, 2017-2031F
- Figure 156. Japan Industrial Gloves Market Share (%), By Material, 2017-2031F
- Figure 157. Japan Industrial Gloves Market Share (%), By Coating, 2017-2031F
- Figure 158. Japan Industrial Gloves Market Share (%), By End-use Industry, 2017-2031F
- Figure 159. Japan Industrial Gloves Market Share (%), By Sales Channel, 2017-2031F
- Figure 160. Australia Industrial Gloves Market, By Value, In USD Billion, 2017-2031F
- Figure 161. Australia Industrial Gloves Market, By Volume, In Units, 2017-2031F
- Figure 162. Australia Industrial Gloves Market Share (%), By Product, 2017-2031F
- Figure 163. Australia Industrial Gloves Market Share (%), By Material, 2017-2031F
- Figure 164. Australia Industrial Gloves Market Share (%), By Coating, 2017-2031F
- Figure 165. Australia Industrial Gloves Market Share (%), By End-use Industry, 2017-2031F
- Figure 166. Australia Industrial Gloves Market Share (%), By Sales Channel, 2017-2031F
- Figure 167. Vietnam Industrial Gloves Market, By Value, In USD Billion, 2017-2031F
- Figure 168. Vietnam Industrial Gloves Market, By Volume, In Units, 2017-2031F
- Figure 169. Vietnam Industrial Gloves Market Share (%), By Product, 2017-2031F
- Figure 170. Vietnam Industrial Gloves Market Share (%), By Material, 2017-2031F
- Figure 171. Vietnam Industrial Gloves Market Share (%), By Coating, 2017-2031F
- Figure 172. Vietnam Industrial Gloves Market Share (%), By End-use Industry, 2017-2031F
- Figure 173. Vietnam Industrial Gloves Market Share (%), By Sales Channel, 2017-2031F
- Figure 174. South Korea Industrial Gloves Market, By Value, In USD Billion, 2017-2031F
- Figure 175. South Korea Industrial Gloves Market, By Volume, In Units, 2017-2031F
- Figure 176. South Korea Industrial Gloves Market Share (%), By Product, 2017-2031F
- Figure 177. South Korea Industrial Gloves Market Share (%), By Material, 2017-2031F
- Figure 178. South Korea Industrial Gloves Market Share (%), By Coating, 2017-2031F
- Figure 179. South Korea Industrial Gloves Market Share (%), By End-use Industry, 2017-2031F
- Figure 180. South Korea Industrial Gloves Market Share (%), By Sales Channel, 2017-2031F
- Figure 181. Indonesia Industrial Gloves Market, By Value, In USD Billion, 2017-2031F
- Figure 182. Indonesia Industrial Gloves Market, By Volume, In Units, 2017-2031F
- Figure 183. Indonesia Industrial Gloves Market Share (%), By Product, 2017-2031F
- Figure 184. Indonesia Industrial Gloves Market Share (%), By Material, 2017-2031F
- Figure 185. Indonesia Industrial Gloves Market Share (%), By Coating, 2017-2031F
- Figure 186. Indonesia Industrial Gloves Market Share (%), By End-use Industry, 2017-2031F
- Figure 187. Indonesia Industrial Gloves Market Share (%), By Sales Channel, 2017-2031F
- Figure 188. Philippines Industrial Gloves Market, By Value, In USD Billion, 2017-2031F
- Figure 189. Philippines Industrial Gloves Market, By Volume, In Units, 2017-2031F
- Figure 190. Philippines Industrial Gloves Market Share (%), By Product, 2017-2031F
- Figure 191. Philippines Industrial Gloves Market Share (%), By Material, 2017-2031F
- Figure 192. Philippines Industrial Gloves Market Share (%), By Coating, 2017-2031F
- Figure 193. Philippines Industrial Gloves Market Share (%), By End-use Industry, 2017-2031F
- Figure 194. Philippines Industrial Gloves Market Share (%), By Sales Channel, 2017-2031F
- Figure 195. Middle East & Africa Industrial Gloves Market, By Value, In USD Billion, 2017-2031F
- Figure 196. Middle East & Africa Industrial Gloves Market, By Volume, In Units, 2017-2031F
- Figure 197. Middle East & Africa Industrial Gloves Market Share (%), By Product, 2017-2031F
- Figure 198. Middle East & Africa Industrial Gloves Market Share (%), By Material, 2017-2031F
- Figure 199. Middle East & Africa Industrial Gloves Market Share (%), By Coating, 2017-2031F
- Figure 200. Middle East & Africa Industrial Gloves Market Share (%), By End-use Industry, 2017-2031F
- Figure 201. Middle East & Africa Industrial Gloves Market Share (%), By Sales Channel, 2017-2031F
- Figure 202. Middle East & Africa Industrial Gloves Market Share (%), By Country, 2017-2031F
- Figure 203. Saudi Arabia Industrial Gloves Market, By Value, In USD Billion, 2017-2031F
- Figure 204. Saudi Arabia Industrial Gloves Market, By Volume, In Units, 2017-2031F
- Figure 205. Saudi Arabia Industrial Gloves Market Share (%), By Product, 2017-2031F
- Figure 206. Saudi Arabia Industrial Gloves Market Share (%), By Material, 2017-2031F
- Figure 207. Saudi Arabia Industrial Gloves Market Share (%), By Coating, 2017-2031F
- Figure 208. Saudi Arabia Industrial Gloves Market Share (%), By End-use Industry, 2017-2031F
- Figure 209. Saudi Arabia Industrial Gloves Market Share (%), By Sales Channel, 2017-2031F
- Figure 210. UAE Industrial Gloves Market, By Value, In USD Billion, 2017-2031F
- Figure 211. UAE Industrial Gloves Market, By Volume, In Units, 2017-2031F
- Figure 212. UAE Industrial Gloves Market Share (%), By Product, 2017-2031F
- Figure 213. UAE Industrial Gloves Market Share (%), By Material, 2017-2031F
- Figure 214. UAE Industrial Gloves Market Share (%), By Coating, 2017-2031F
- Figure 215. UAE Industrial Gloves Market Share (%), By End-use Industry, 2017-2031F
- Figure 216. UAE Industrial Gloves Market Share (%), By Sales Channel, 2017-2031F
- Figure 217. South Africa Industrial Gloves Market, By Value, In USD Billion, 2017-2031F
- Figure 218. South Africa Industrial Gloves Market, By Volume, In Units, 2017-2031F
- Figure 219. South Africa Industrial Gloves Market Share (%), By Product, 2017-2031F
- Figure 220. South Africa Industrial Gloves Market Share (%), By Material, 2017-2031F
- Figure 221. South Africa Industrial Gloves Market Share (%), By Coating, 2017-2031F
- Figure 222. South Africa Industrial Gloves Market Share (%), By End-use Industry, 2017-2031F
- Figure 223. South Africa Industrial Gloves Market Share (%), By Sales Channel, 2017-2031F
- Figure 224. By Product Map-Market Size (USD Billion) & Growth Rate (%), 2023
- Figure 225. By Material Map-Market Size (USD Billion) & Growth Rate (%), 2023
- Figure 226. By Coating Map-Market Size (USD Billion) & Growth Rate (%), 2023
- Figure 227. By End-use Industry Map-Market Size (USD Billion) & Growth Rate (%), 2023
- Figure 228. By Sales Channel Map-Market Size (USD Billion) & Growth Rate (%), 2023
- Figure 229. By Region Map-Market Size (USD Billion) & Growth Rate (%), 2023
Global industrial gloves market is projected to witness a CAGR of 8.85% during the forecast period 2024-2031, growing from USD 10.83 billion in 2023 to USD 21.34 billion in 2031. The market thrives at a strong growth rate due to stringent occupational safety policies and rising awareness of health hazards.
Industrial safety has become crucial over the years due to higher awareness and government compliance. The focus on worker safety from chemical labs to the manufacturing spaces fuels the industrial safety gear industry including the global industrial gloves market. Industrial gloves with better grip, thickness, inner liners, and specific features such as electrostatic discharge, chemical resistance, and cut resistance have been developed due to advancements in materials and production techniques. Cut-resistant gloves comprising Kevlar, Dyneema, and stainless-steel fibers are in high demand from industries including manufacturing, construction, and metalworking to protect workers from cuts and punctures. To reach new customers worldwide, businesses are expanding their sales channels through e-commerce and other platforms.
With the rising number of accidents in the workspace, the concerned authorities are introducing different guidelines to ensure workplace safety. Other than compliances and policies, companies are experimenting with different glove designs, materials, and new manufacturing technology. Advanced glove technology comprises the advanced knitting technique, making the glove highly safe with better cushioning, shock reduction, and thermal insulation.
For instance, in October 2023, Shima Seiki Mfg. Ltd., a flat knitting technologist showcased its new glove knitting technology at A+A 2023 with safety, security, and health at Work International Trade Fair in Duusseldorf. These technologies comprise the SPG-R pile and the prototype SFG-R next-generation glove knitting machines. Pile gloves are well-known, particularly in the realm of industrial safety, for their unique qualities of cushioning, shock reduction, thermal insulation, and cold protection.
Sustainable Gloves and Customization to Fuel Market Growth
In response to worries about the environmental impact of gloves, there is a shift in the manufacturing process towards the use of sustainable and eco-friendly materials for industrial gloves. Innovation in industrial hand gloves is being driven by developments in material technology, which has resulted in the creation of gloves with improved grip, greater flexibility, higher chemical resistance, and improved heat resistance. Glove manufacturers are catering to worker preferences, industry needs, and size, fit, color, and branding by providing customized glove solutions. Customization enables producers to provide specialized solutions that satisfy certain industry demands, including those related to grip patterns, resistance levels, coatings, and sizes. It guarantees that gloves are made specifically to meet the needs and hazards of workers across a range of sectors. The new glove vendors are producing sustainable gloves, using sustainable materials.
For instance, in June 2023, Unigloves Ltd. launched a new sustainable gloves range. The company introduced these gloves as a part of its eco-conscious hand protection solutions. The company uses recycled plastics to produce these gloves. In addition to providing mechanical, cut, and impact protection, the new Nitrex RP sustainable glove line uses less plastic packaging, water, CO2, and polyesters derived from virgin oil. Every product in the new range is tested and certified to EN388 standards, making it ideal for industrial sectors where cut and abrasion risks are common, such as automotive, glass, construction, engineering, transport, and logistics.
Stringent Government Policies and Compliances to Fuel the Global Market Expansion
The higher adoption of industrial gloves is due to the involvement of the government agencies that look for violation. The Occupational Safety and Health Administration (OSHA) introduces and revises the safety standards according to the industries and risks involved. Sufficient hand protection is a necessity. It is the responsibility of employers to supply PPE needed for employees to do their duties safely. Of course, a part of this is keeping all the gloves necessary to shield each worker's hands stocked. OSHA standards for hand safety comprise two elements, general requirements [1910.138 (a)] and selection [1910.138(b)]. General requirement asks employers to select and require employees to use appropriate hand protection to protect them against severe cuts or lacerations, severe abrasions, punctures, chemical burns, thermal burns, and harmful temperature extremes. However, the selection clause talks about the selection of the appropriate hand protection. Hence, key players launch customized gloves for specific work, leading to the growth of the market.
For instance, in April 2023, Pyramex Safety Products LLC. launched GL3000 series arc flash protection gloves. Two new glove alternatives in the series are made to be highly dexterous, comfortable, and fit. They are intended to offer the best protection possible for people whose jobs involve the risk of an arc flash incident.
Wide Range of Applications and Higher Durability Fuel Reusable Segmental Growth
Reusable gloves hold the major share in the global industrial gloves market. Reusable gloves are designed to withstand repeated use and cleaning, making them a cost-effective option for industries where gloves are used extensively. Reusable gloves provide superior protection against chemicals, abrasion, and corrosion, ensuring the safety of workers in various industrial settings. Reusable gloves are ideal for auto mechanics and manufacturing. These gloves are more resistant to dangers such as extreme heat, cuts, water, intense cold, oil, and corrosive chemicals. Other than automotive, oil and gas, and mining sectors fuel the segmental growth for reusable industrial gloves.
For instance, in September 2023, the Lebon Group launched its new range of protective gloves for the automotive industry. Its latest line of protective gloves is called GreenProtech. a comprehensive line of seven bi-polymer protective gloves built on the BFR Technology coating from LEBON. Great dexterity, a second skin effect, and exceptional durability are provided by GreenProtech. It uses SCREENTECH technology, which makes it possible to use touchscreen devices without removing the protective gloves. These protective gloves are made from an eco-friendly water-based material.
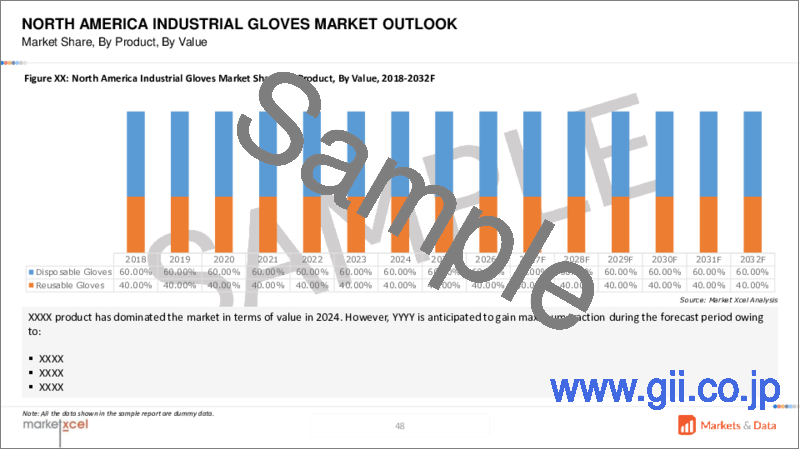
North America Dominates Industrial Gloves Market
The expanding industries such as automotive, food and beverages, chemical, and oil and gas are enabling the utilization of gloves. The robust governmental framework ensures the safety of employees at work in the United States through the Occupational Safety and Health Act (OSHA) and in Canada by enacting equivalent laws. These rules enforce penalties on employers who fail to comply and mandate the upkeep of a secure work environment. Industries, such as construction, manufacturing, and transportation, which are considered high-risk, play a significant role in the economic growth of North America. The variety necessitates the implementation of more stringent safety protocols to minimize hazards and prevent accidents. In North America, leading corporations prioritize safety in the workplace to maintain worker satisfaction, reduce turnover, and increase efficiency. The allocation of resources and the development of comprehensive safety standards reflect in the commitment. Additionally, there is an emphasis on producing safety gloves domestically to further strengthen the North American economy.
For instance, in March 2024, The Department of Homeland Security (DHS), the Department of Health and Human Services (HHS), and the Department of Veterans Affairs (VA) released a notice to industry to offer an estimate of government PPE demand as part of the make Personal Protective Equipment in America Act. The long-term viability of the domestic gloves manufacturing sector is supported by the federal government's implementation of procurement programs and advancement of Made in America goals.
Future Market Scenario (2024 - 2031F)
The adoption of sustainable materials, cut-resistant gloves, and other technological advancements are expected to propel the market growth.
Robust government compliance and policies around workplace safety are expected to garner market growth.
Industrial expansion including automotive, FMCG, and oil and gas sectors is anticipated to expand the industrial gloves market size.
Automation in glove manufacturing has enabled customization and effective design, transforming the global market landscape.
Key Players Landscape and Outlook
Key participants in the industrial gloves market include working on delivering sustainable, biodegradable gloves for a lower carbon footprint effect. Alongside, strategic partnerships, collaboration, acquisitions, and product launches are used as the major elements of the market's strategic landscape.
For instance, in January 2024, Kimberly-Clark Corporation launched Kimtech Polaris Nitrile Gloves for a highly protective lab. The exceptional strength and protection of these gloves are matched by their exceptional comfort and dexterity. They have the United States ergonomics accreditation, which attests to the fact that the gloves provide quantifiable ergonomic advantages to the wearer by enhancing fit and comfort and lowering injury risk factors.
In March 2023, Australian Gloves firm, Ansell Limited invested USD 80 million in its new manufacturing site in India. By the end of 2024, the plant is expected to become completely operational.
Table of Contents
1. Research Methodology
2. Project Scope and Definitions
3. Executive Summary
4. Voice of Customer
- 4.1. Product and Market Intelligence
- 4.2. Mode of Brand Awareness
- 4.3. Factors Considered in Purchase Decisions
- 4.3.1. Size and Fit
- 4.3.2. Protection v/s Dexterity
- 4.3.3. Protection Levels
- 4.3.4. Wear and Tear
- 4.3.5. Expiration
- 4.3.6. Regulations and Compliance
- 4.4. Consideration of Privacy and Safety Regulations
5. Global Industrial Gloves Market Outlook, 2017-2031F
- 5.1. Market Size & Forecast
- 5.1.1. By Value
- 5.1.2. By Volume
- 5.2. By Product
- 5.2.1. Disposable Gloves
- 5.2.2. Reusable Gloves
- 5.3. By Material
- 5.3.1. Rubber
- 5.3.2. Vinyl
- 5.3.3. Neoprene
- 5.3.4. Polyethylene
- 5.3.5. Spectra Fiber
- 5.3.6. Others
- 5.4. By Coating
- 5.4.1. Flat Nitrile
- 5.4.2. Micropore Foam Nitrile
- 5.4.3. Latex
- 5.4.4. Other
- 5.5. By End-use Industry
- 5.5.1. Pharmaceuticals
- 5.5.2. Automotive and Transportation
- 5.5.3. Food and Beverages
- 5.5.4. Oil and Gas
- 5.5.5. Mining
- 5.5.6. Chemicals
- 5.5.7. Others
- 5.6. By Sales Channel
- 5.6.1. Direct
- 5.6.2. Indirect
- 5.7. By Region
- 5.7.1. North America
- 5.7.2. Europe
- 5.7.3. Asia-Pacific
- 5.7.4. South America
- 5.7.5. Middle East and Africa
- 5.8. By Company Market Share (%), 2023
6. Global Industrial Gloves Market Outlook, By Region, 2017-2031F
- 6.1. North America*
- 6.1.1. Market Size & Forecast
- 6.1.1.1. By Value
- 6.1.1.2. By Volume
- 6.1.2. By Product
- 6.1.2.1. Disposable Gloves
- 6.1.2.2. Reusable Gloves
- 6.1.3. By Material
- 6.1.3.1. Rubber
- 6.1.3.2. Vinyl
- 6.1.3.3. Neoprene
- 6.1.3.4. Polyethylene
- 6.1.3.5. Spectra Fiber
- 6.1.3.6. Others
- 6.1.4. By Coating
- 6.1.4.1. Flat Nitrile
- 6.1.4.2. Micropore Foam Nitrile
- 6.1.4.3. Latex
- 6.1.4.4. Other
- 6.1.5. By End-use Industry
- 6.1.5.1. Pharmaceuticals
- 6.1.5.2. Automotive and Transportation
- 6.1.5.3. Food and Beverages
- 6.1.5.4. Oil and Gas
- 6.1.5.5. Mining
- 6.1.5.6. Chemicals
- 6.1.5.7. Others
- 6.1.6. By Sales Channel
- 6.1.6.1. Direct
- 6.1.6.2. Indirect
- 6.1.7. United States*
- 6.1.7.1. Market Size & Forecast
- 6.1.7.1.1. By Value
- 6.1.7.1.2. By Volume
- 6.1.7.2. By Product
- 6.1.7.2.1. Disposable Gloves
- 6.1.7.2.2. Reusable Gloves
- 6.1.7.3. By Material
- 6.1.7.3.1. Rubber
- 6.1.7.3.2. Vinyl
- 6.1.7.3.3. Neoprene
- 6.1.7.3.4. Polyethylene
- 6.1.7.3.5. Spectra Fiber
- 6.1.7.3.6. Others
- 6.1.7.4. By Coating
- 6.1.7.4.1. Flat Nitrile
- 6.1.7.4.2. Micropore Foam Nitrile
- 6.1.7.4.3. Latex
- 6.1.7.4.4. Other
- 6.1.7.5. By End-use Industry
- 6.1.7.5.1. Pharmaceuticals
- 6.1.7.5.2. Automotive and Transportation
- 6.1.7.5.3. Food and Beverages
- 6.1.7.5.4. Oil and Gas
- 6.1.7.5.5. Mining
- 6.1.7.5.6. Chemicals
- 6.1.7.5.7. Others
- 6.1.7.6. By Sales Channel
- 6.1.7.6.1. Direct
- 6.1.7.6.2. Indirect
- 6.1.7.1. Market Size & Forecast
- 6.1.8. Canada
- 6.1.9. Mexico
- 6.1.1. Market Size & Forecast
All segments will be provided for all regions and countries covered
- 6.2. Europe
- 6.2.1. Germany
- 6.2.2. France
- 6.2.3. Italy
- 6.2.4. United Kingdom
- 6.2.5. Russia
- 6.2.6. Netherlands
- 6.2.7. Spain
- 6.2.8. Turkey
- 6.2.9. Poland
- 6.3. Asia-Pacific
- 6.3.1. India
- 6.3.2. China
- 6.3.3. Japan
- 6.3.4. Australia
- 6.3.5. Vietnam
- 6.3.6. South Korea
- 6.3.7. Indonesia
- 6.3.8. Philippines
- 6.4. South America
- 6.4.1. Brazil
- 6.4.2. Argentina
- 6.5. Middle East and Africa
- 6.5.1. Saudi Arabia
- 6.5.2. UAE
- 6.5.3. South Africa
7. Market Mapping, 2023
- 7.1. By Product
- 7.2. By Material
- 7.3. By Coating
- 7.4. By End-use Industry
- 7.5. By Sales Channel
- 7.6. By Region
8. Macro Environment and Industry Structure
- 8.1. Demand Supply Analysis
- 8.2. Import Export Analysis
- 8.3. Value Chain Analysis
- 8.4. PESTEL Analysis
- 8.4.1. Political Factors
- 8.4.2. Economic System
- 8.4.3. Social Implications
- 8.4.4. Technological Advancements
- 8.4.5. Environmental Impacts
- 8.4.6. Legal Compliances and Regulatory Policies (Statutory Bodies Included)
- 8.5. Porter's Five Forces Analysis
- 8.5.1. Supplier Power
- 8.5.2. Buyer Power
- 8.5.3. Substitution Threat
- 8.5.4. Threat from New Entrants
- 8.5.5. Competitive Rivalry
9. Market Dynamics
- 9.1. Growth Drivers
- 9.2. Growth Inhibitors (Challenges and Restraints)
10. Key Players Landscape
- 10.1. Competition Matrix of Top Five Market Leaders
- 10.2. Market Revenue Analysis of Top Five Market Leaders (By Value, 2023)
- 10.3. Mergers and Acquisitions/Joint Ventures (If Applicable)
- 10.4. SWOT Analysis (For Five Market Players)
- 10.5. Patent Analysis (If Applicable)
11. Pricing Analysis
12. Case Studies
13. Key Players Outlook
- 13.1. Honeywell International Inc.
- 13.1.1. Company Details
- 13.1.2. Key Management Personnel
- 13.1.3. Products and Services
- 13.1.4. Financials (As reported)
- 13.1.5. Key Market Focus and Geographical Presence
- 13.1.6. Recent Developments
- 13.2. 3M Company
- 13.3. Kimberly-Clark Corporation
- 13.4. Ansell Limited
- 13.5. Showa Glove Co.
- 13.6. Hartalega Holdings Bhd
- 13.7. urvex Group
- 13.8. W. W. Grainger Inc.
- 13.9. Mechanix Wear Inc.
- 13.10. Carolina Glove & Safety Company
Companies mentioned above DO NOT hold any order as per market share and can be changed as per information available during research work.
