|
|
市場調査レポート
商品コード
1445527
術後疼痛市場の評価:製品・投与経路・流通チャネル・地域別の機会および予測 (2017~2031年)Postoperative Pain Market Assessment, By Product, By Route of Administration, By Distribution Channel, By Region, Opportunities and Forecast, 2017-2031F |
||||||

|
|||||||
カスタマイズ可能
|
|||||||

| 術後疼痛市場の評価:製品・投与経路・流通チャネル・地域別の機会および予測 (2017~2031年) |
|
出版日: 2024年03月07日
発行: Markets & Data
ページ情報: 英文 235 Pages
納期: 3~5営業日
|

全表示
- 概要
- 図表
- 目次
世界の術後疼痛の市場規模は、2024年から2031年の予測期間中にCAGR 5.25%を記録し、2023年の400億9,000万米ドルから、2031年には603億6,000万米ドルの規模に成長すると予測されています。
同市場は、効率的な疼痛緩和戦略への高い需要につながる外科手術の増加や、効果的な術後疼痛コントロールを必要とする慢性疾患の増加といった要因の影響を受けて成長すると予測されます。さらに、オピオイドの乱用に対する懸念から、手術後の疼痛管理にオピオイドを使用しない選択肢を探ることへの関心が高まっています。術後疼痛の緩和による患者コンプライアンスの向上への注力も市場を牽引する大きな要因となっています。業界内の技術革新を推進するR&Dイニシアティブも術後の不快感を軽減する斬新なアプローチを提供し、市場のさらなる成長に寄与しています。一方で、市場成長の主な障壁は、オピオイド鎮痛薬の使用に伴う副作用や、疼痛管理ソリューションの使用に伴うその他の合併症です。疼痛管理には神経系に作用する薬剤を使用するため、薬物乱用も大きな懸念事項であり、規制上の課題となっています。
2023年10月、Hyloris Pharmaは、術後疼痛治療薬Maxigesic IVについて、米国のFDA承認を取得したと発表しました。Maxigesic IVは、パラセタモールとイブプロフェン溶液を組み合わせた点滴用薬剤で、オピオイド中毒のリスクを伴わずに術後の痛みや炎症を抑えることができます。Hyloris Pharmaはベルギーに本社を置く企業で、ニュージーランドに本社を置く薬剤メーカーAFT PharmaceuticalsおよびHikma Pharmaceuticalsと共同でこの承認薬を開発しました。
多くの手術は薬物療法だけでは不十分な場合に必要とされます。咽頭癌や口腔癌など、手術が必要な癌の症例数が世界的に増加しています。また、心臓血管や胃腸などの慢性疾患や、手術が必要な交通事故の急増によって、使い捨て手術器具の需要も促進されています。手術件数の多さは術後疼痛症例の多さと直結しており、両者の増加から、術後疼痛市場の拡大が期待されています。世界保健機関 (WHO) によると、世界では年間3億件以上の外科手術が行われています。入手可能なデータによると、米国では2022年に700万件以上の外科手術が行われました。
患者のコンプライアンスが重視されるようになったため、術後の疼痛管理は大きな関心事となっています。多くの患者が術後に中度から重度の痛みを経験しており、術後の疼痛管理が不十分であることを示しています。この問題の主な原因は、鎮痛薬の処方が不十分であることであり、コンプライアンス違反だけが原因とは言えません。患者の疼痛管理は退院後に軽視される可能性があるため、疼痛の評価、記録、管理はケアの重要な側面です。術後患者の疼痛評価の遵守は極めて重要であり、標準的な尺度の使用が推奨されます。効果的な疼痛管理には、十分な鎮痛薬と承認された国の疼痛ガイドラインが不可欠です。参入事業者は、市場の要求に適切に対応するため、製品開発や規制当局への対応に絶えず取り組んでいます。
製品タイプ別では、デバイスに比べて広く使用されることから、薬剤の部門が優位を占めると予想されています。オピオイド、非ステロイド性抗炎症薬 (NSAIDs) 、鎮痛薬などの鎮痛薬は、疼痛管理デバイスよりも容易に入手でき、費用対効果も高いです。医療補助を必要とせず、投与が容易なことも、薬剤の使用率が高い一因となっています。一方で、薬剤に伴う副作用を避けるために疼痛管理デバイスの採用も増加しており、疼痛管理デバイス部門の成長率が高まっています。疼痛管理デバイスの人気は高まっているもの、アクセスのしやすさ、患者のコンプライアンス、費用対効果の高さから、薬剤部門が優位を占めると予想されています。
当レポートでは、世界の術後疼痛の市場を調査し、市場の定義と概要、市場規模の推移・予測、各種区分・地域別の詳細分析、産業構造、市場成長への影響因子の分析、ケーススタディ、競合情勢、主要企業のプロファイルなどをまとめています。
目次
第1章 調査手法
第2章 プロジェクトの範囲と定義
第3章 エグゼクティブサマリー
第4章 世界の術後疼痛市場の展望
- 市場規模・予測
- 製品別
- 薬剤
- デバイス
- 投与経路別
- 注射
- 経口
- 局所
- 経皮
- その他
- 流通チャネル別
- 病院薬局
- 小売薬局
- オンライン薬局
- 地域別
- 北米
- 欧州
- アジア太平洋
- 南米
- 中東・アフリカ
- 企業別:市場シェア(%)、2023年
第5章 世界の術後疼痛市場の展望:地域別
- 北米
- 欧州
- アジア太平洋
- 南米
- 中東・アフリカ
第6章 市場マッピング
- 製品別
- 投与経路別
- 流通チャネル別
- 地域別
第7章 マクロ環境と産業構造
- 需要供給分析
- 輸出入分析
- バリューチェーン分析
- PESTEL分析
- ポーターのファイブフォース分析
第8章 市場力学
- 成長促進要因
- 成長抑制要因(課題、抑制要因)
第9章 規制の枠組みとイノベーション
- 臨床試験
- 特許の情勢
- 規制当局の承認
- イノベーション・新興技術
第10章 主要企業の情勢
- 市場リーダー上位5社の競合マトリックス
- 市場リーダー上位5社の市場収益分析
- M&A・ジョイントベンチャー (該当する場合)
- SWOT分析 (参入5社)
第11章 価格分析
第12章 ケーススタディ
第13章 主要企業の見通し
- Novartis AG
- Allergan plc
- Teva Pharmaceutical Industries Ltd.
- Mylan N.V.
- Pfizer Inc.
- GlaxoSmithKline Plc.
- Johnson & Johnson Pte. Ltd.
- AstraZeneca PLC
- Sanofi S.A.
- Cipla Inc. (InvaGen Pharmaceuticals Inc.)
第14章 戦略的提言
第15章 当社について・免責事項
List of Tables
- Table 1. Pricing Analysis of Products from Key Players
- Table 2. Competition Matrix of Top 5 Market Leaders
- Table 3. Mergers & Acquisitions/ Joint Ventures (If Applicable)
- Table 4. About Us - Regions and Countries Where We Have Executed Client Projects
List of Figures
- Figure 1. Global Postoperative Pain Market, By Value, in USD Billion, 2017-2031F
- Figure 2. Global Postoperative Pain Market, By Volume, in Million Units, 2017-2031F
- Figure 3. Global Postoperative Pain Market Share (%), By Product, 2017-2031F
- Figure 4. Global Postoperative Pain Market Share (%), By Route of Administration, 2017-2031F
- Figure 5. Global Postoperative Pain Market Share (%), By Distribution Channel, 2017-2031F
- Figure 6. Global Postoperative Pain Market Share (%), By Region, 2017-2031F
- Figure 7. North America Postoperative Pain Market, By Value, in USD Billion, 2017-2031F
- Figure 8. North America Postoperative Pain Market, By Volume, in Million Units, 2017-2031F
- Figure 9. North America Postoperative Pain Market Share (%), By Product, 2017-2031F
- Figure 10. North America Postoperative Pain Market Share (%), By Route of Administration, 2017-2031F
- Figure 11. North America Postoperative Pain Market Share (%), By Distribution Channel, 2017-2031F
- Figure 12. North America Postoperative Pain Market Share (%), By Country, 2017-2031F
- Figure 13. United States Postoperative Pain Market, By Value, in USD Billion, 2017-2031F
- Figure 14. United States Postoperative Pain Market, By Volume, in Million Units, 2017-2031F
- Figure 15. United States Postoperative Pain Market Share (%), By Product, 2017-2031F
- Figure 16. United States Postoperative Pain Market Share (%), By Route of Administration, 2017-2031F
- Figure 17. United States Postoperative Pain Market Share (%), By Distribution Channel, 2017-2031F
- Figure 18. Canada Postoperative Pain Market, By Value, in USD Billion, 2017-2031F
- Figure 19. Canada Postoperative Pain Market, By Volume, in Million Units, 2017-2031F
- Figure 20. Canada Postoperative Pain Market Share (%), By Product, 2017-2031F
- Figure 21. Canada Postoperative Pain Market Share (%), By Route of Administration, 2017-2031F
- Figure 22. Canada Postoperative Pain Market Share (%), By Distribution Channel, 2017-2031F
- Figure 23. Mexico Postoperative Pain Market, By Value, in USD Billion, 2017-2031F
- Figure 24. Mexico Postoperative Pain Market, By Volume, in Million Units, 2017-2031F
- Figure 25. Mexico Postoperative Pain Market Share (%), By Product, 2017-2031F
- Figure 26. Mexico Postoperative Pain Market Share (%), By Route of Administration, 2017-2031F
- Figure 27. Mexico Postoperative Pain Market Share (%), By Distribution Channel, 2017-2031F
- Figure 28. Europe Postoperative Pain Market, By Value, in USD Billion, 2017-2031F
- Figure 29. Europe Postoperative Pain Market, By Volume, in Million Units, 2017-2031F
- Figure 30. Europe Postoperative Pain Market Share (%), By Product, 2017-2031F
- Figure 31. Europe Postoperative Pain Market Share (%), By Route of Administration, 2017-2031F
- Figure 32. Europe Postoperative Pain Market Share (%), By Distribution Channel, 2017-2031F
- Figure 33. Europe Postoperative Pain Market Share (%), By Country, 2017-2031F
- Figure 34. Germany Postoperative Pain Market, By Value, in USD Billion, 2017-2031F
- Figure 35. Germany Postoperative Pain Market, By Volume, in Million Units, 2017-2031F
- Figure 36. Germany Postoperative Pain Market Share (%), By Product, 2017-2031F
- Figure 37. Germany Postoperative Pain Market Share (%), By Route of Administration, 2017-2031F
- Figure 38. Germany Postoperative Pain Market Share (%), By Distribution Channel, 2017-2031F
- Figure 39. France Postoperative Pain Market, By Value, in USD Billion, 2017-2031F
- Figure 40. France Postoperative Pain Market, By Volume, in Million Units, 2017-2031F
- Figure 41. France Postoperative Pain Market Share (%), By Product, 2017-2031F
- Figure 42. France Postoperative Pain Market Share (%), By Route of Administration, 2017-2031F
- Figure 43. France Postoperative Pain Market Share (%), By Distribution Channel, 2017-2031F
- Figure 44. Italy Postoperative Pain Market, By Value, in USD Billion, 2017-2031F
- Figure 45. Italy Postoperative Pain Market, By Volume, in Million Units, 2017-2031F
- Figure 46. Italy Postoperative Pain Market Share (%), By Product, 2017-2031F
- Figure 47. Italy Postoperative Pain Market Share (%), By Route of Administration, 2017-2031F
- Figure 48. Italy Postoperative Pain Market Share (%), By Distribution Channel, 2017-2031F
- Figure 49. United Kingdom Postoperative Pain Market, By Value, in USD Billion, 2017-2031F
- Figure 50. United Kingdom Postoperative Pain Market, By Volume, in Million Units, 2017-2031F
- Figure 51. United Kingdom Postoperative Pain Market Share (%), By Product, 2017-2031F
- Figure 52. United Kingdom Postoperative Pain Market Share (%), By Route of Administration, 2017-2031F
- Figure 53. United Kingdom Postoperative Pain Market Share (%), By Distribution Channel, 2017-2031F
- Figure 54. Russia Postoperative Pain Market, By Value, in USD Billion, 2017-2031F
- Figure 55. Russia Postoperative Pain Market, By Volume, in Million Units, 2017-2031F
- Figure 56. Russia Postoperative Pain Market Share (%), By Product, 2017-2031F
- Figure 57. Russia Postoperative Pain Market Share (%), By Route of Administration, 2017-2031F
- Figure 58. Russia Postoperative Pain Market Share (%), By Distribution Channel, 2017-2031F
- Figure 59. Netherlands Postoperative Pain Market, By Value, in USD Billion, 2017-2031F
- Figure 60. Netherlands Postoperative Pain Market, By Volume, in Million Units, 2017-2031F
- Figure 61. Netherlands Postoperative Pain Market Share (%), By Product, 2017-2031F
- Figure 62. Netherlands Postoperative Pain Market Share (%), By Route of Administration, 2017-2031F
- Figure 63. Netherlands Postoperative Pain Market Share (%), By Distribution Channel, 2017-2031F
- Figure 64. Spain Postoperative Pain Market, By Value, in USD Billion, 2017-2031F
- Figure 65. Spain Postoperative Pain Market, By Volume, in Million Units, 2017-2031F
- Figure 66. Spain Postoperative Pain Market Share (%), By Product, 2017-2031F
- Figure 67. Spain Postoperative Pain Market Share (%), By Route of Administration, 2017-2031F
- Figure 68. Spain Postoperative Pain Market Share (%), By Distribution Channel, 2017-2031F
- Figure 69. Turkey Postoperative Pain Market, By Value, in USD Billion, 2017-2031F
- Figure 70. Turkey Postoperative Pain Market, By Volume, in Million Units, 2017-2031F
- Figure 71. Turkey Postoperative Pain Market Share (%), By Product, 2017-2031F
- Figure 72. Turkey Postoperative Pain Market Share (%), By Route of Administration, 2017-2031F
- Figure 73. Turkey Postoperative Pain Market Share (%), By Distribution Channel, 2017-2031F
- Figure 74. Poland Postoperative Pain Market, By Value, in USD Billion, 2017-2031F
- Figure 75. Poland Postoperative Pain Market, By Volume, in Million Units, 2017-2031F
- Figure 76. Poland Postoperative Pain Market Share (%), By Product, 2017-2031F
- Figure 77. Poland Postoperative Pain Market Share (%), By Route of Administration, 2017-2031F
- Figure 78. Poland Postoperative Pain Market Share (%), By Distribution Channel, 2017-2031F
- Figure 79. South America Postoperative Pain Market, By Value, in USD Billion, 2017-2031F
- Figure 80. South America Postoperative Pain Market, By Volume, in Million Units, 2017-2031F
- Figure 81. South America Postoperative Pain Market Share (%), By Product, 2017-2031F
- Figure 82. South America Postoperative Pain Market Share (%), By Route of Administration, 2017-2031F
- Figure 83. South America Postoperative Pain Market Share (%), By Distribution Channel, 2017-2031F
- Figure 84. South America Postoperative Pain Market Share (%), By Country, 2017-2031F
- Figure 85. Brazil Postoperative Pain Market, By Value, in USD Billion, 2017-2031F
- Figure 86. Brazil Postoperative Pain Market, By Volume, in Million Units, 2017-2031F
- Figure 87. Brazil Postoperative Pain Market Share (%), By Product, 2017-2031F
- Figure 88. Brazil Postoperative Pain Market Share (%), By Route of Administration, 2017-2031F
- Figure 89. Brazil Postoperative Pain Market Share (%), By Distribution Channel, 2017-2031F
- Figure 90. Argentina Postoperative Pain Market, By Value, in USD Billion, 2017-2031F
- Figure 91. Argentina Postoperative Pain Market, By Volume, in Million Units, 2017-2031F
- Figure 92. Argentina Postoperative Pain Market Share (%), By Product, 2017-2031F
- Figure 93. Argentina Postoperative Pain Market Share (%), By Route of Administration, 2017-2031F
- Figure 94. Argentina Postoperative Pain Market Share (%), By Distribution Channel, 2017-2031F
- Figure 95. Asia-Pacific Postoperative Pain Market, By Value, in USD Billion, 2017-2031F
- Figure 96. Asia-Pacific Postoperative Pain Market, By Volume, in Million Units, 2017-2031F
- Figure 97. Asia-Pacific Postoperative Pain Market Share (%), By Product, 2017-2031F
- Figure 98. Asia-Pacific Postoperative Pain Market Share (%), By Route of Administration, 2017-2031F
- Figure 99. Asia-Pacific Postoperative Pain Market Share (%), By Distribution Channel, 2017-2031F
- Figure 100. Asia-Pacific Postoperative Pain Market Share (%), By Country, 2017-2031F
- Figure 101. India Postoperative Pain Market, By Value, in USD Billion, 2017-2031F
- Figure 102. India Postoperative Pain Market, By Volume, in Million Units, 2017-2031F
- Figure 103. India Postoperative Pain Market Share (%), By Product, 2017-2031F
- Figure 104. India Postoperative Pain Market Share (%), By Route of Administration, 2017-2031F
- Figure 105. India Postoperative Pain Market Share (%), By Distribution Channel, 2017-2031F
- Figure 106. China Postoperative Pain Market, By Value, in USD Billion, 2017-2031F
- Figure 107. China Postoperative Pain Market, By Volume, in Million Units, 2017-2031F
- Figure 108. China Postoperative Pain Market Share (%), By Product, 2017-2031F
- Figure 109. China Postoperative Pain Market Share (%), By Route of Administration, 2017-2031F
- Figure 110. China Postoperative Pain Market Share (%), By Distribution Channel, 2017-2031F
- Figure 111. Japan Postoperative Pain Market, By Value, in USD Billion, 2017-2031F
- Figure 112. Japan Postoperative Pain Market, By Volume, in Million Units, 2017-2031F
- Figure 113. Japan Postoperative Pain Market Share (%), By Product, 2017-2031F
- Figure 114. Japan Postoperative Pain Market Share (%), By Route of Administration, 2017-2031F
- Figure 115. Japan Postoperative Pain Market Share (%), By Distribution Channel, 2017-2031F
- Figure 116. Australia Postoperative Pain Market, By Value, in USD Billion, 2017-2031F
- Figure 117. Australia Postoperative Pain Market, By Volume, in Million Units, 2017-2031F
- Figure 118. Australia Postoperative Pain Market Share (%), By Product, 2017-2031F
- Figure 119. Australia Postoperative Pain Market Share (%), By Route of Administration, 2017-2031F
- Figure 120. Australia Postoperative Pain Market Share (%), By Distribution Channel, 2017-2031F
- Figure 121. Vietnam Postoperative Pain Market, By Value, in USD Billion, 2017-2031F
- Figure 122. Vietnam Postoperative Pain Market, By Volume, in Million Units, 2017-2031F
- Figure 123. Vietnam Postoperative Pain Market Share (%), By Product, 2017-2031F
- Figure 124. Vietnam Postoperative Pain Market Share (%), By Route of Administration, 2017-2031F
- Figure 125. Vietnam Postoperative Pain Market Share (%), By Distribution Channel, 2017-2031F
- Figure 126. South Korea Postoperative Pain Market, By Value, in USD Billion, 2017-2031F
- Figure 127. South Korea Postoperative Pain Market, By Volume, in Million Units, 2017-2031F
- Figure 128. South Korea Postoperative Pain Market Share (%), By Product, 2017-2031F
- Figure 129. South Korea Postoperative Pain Market Share (%), By Route of Administration, 2017-2031F
- Figure 130. South Korea Postoperative Pain Market Share (%), By Distribution Channel, 2017-2031F
- Figure 131. Indonesia Postoperative Pain Market, By Value, in USD Billion, 2017-2031F
- Figure 132. Indonesia Postoperative Pain Market, By Volume, in Million Units, 2017-2031F
- Figure 133. Indonesia Postoperative Pain Market Share (%), By Product, 2017-2031F
- Figure 134. Indonesia Postoperative Pain Market Share (%), By Route of Administration, 2017-2031F
- Figure 135. Indonesia Postoperative Pain Market Share (%), By Distribution Channel, 2017-2031F
- Figure 136. Philippines Postoperative Pain Market, By Value, in USD Billion, 2017-2031F
- Figure 137. Philippines Postoperative Pain Market, By Volume, in Million Units, 2017-2031F
- Figure 138. Philippines Postoperative Pain Market Share (%), By Product, 2017-2031F
- Figure 139. Philippines Postoperative Pain Market Share (%), By Route of Administration, 2017-2031F
- Figure 140. Philippines Postoperative Pain Market Share (%), By Distribution Channel, 2017-2031F
- Figure 141. Middle East & Africa Postoperative Pain Market, By Value, in USD Billion, 2017-2031F
- Figure 142. Middle East & Africa Postoperative Pain Market, By Volume, in Million Units, 2017-2031F
- Figure 143. Middle East & Africa Postoperative Pain Market Share (%), By Product, 2017-2031F
- Figure 144. Middle East & Africa Postoperative Pain Market Share (%), By Route of Administration, 2017-2031F
- Figure 145. Middle East & Africa Postoperative Pain Market Share (%), By Distribution Channel, 2017-2031F
- Figure 146. Middle East & Africa Postoperative Pain Market Share (%), By Country, 2017-2031F
- Figure 147. Saudi Arabia Postoperative Pain Market, By Value, in USD Billion, 2017-2031F
- Figure 148. Saudi Arabia Postoperative Pain Market, By Volume, in Million Units, 2017-2031F
- Figure 149. Saudi Arabia Postoperative Pain Market Share (%), By Product, 2017-2031F
- Figure 150. Saudi Arabia Postoperative Pain Market Share (%), By Route of Administration, 2017-2031F
- Figure 151. Saudi Arabia Postoperative Pain Market Share (%), By Distribution Channel, 2017-2031F
- Figure 152. UAE Postoperative Pain Market, By Value, in USD Billion, 2017-2031F
- Figure 153. UAE Postoperative Pain Market, By Volume, in Million Units, 2017-2031F
- Figure 154. UAE Postoperative Pain Market Share (%), By Product, 2017-2031F
- Figure 155. UAE Postoperative Pain Market Share (%), By Route of Administration, 2017-2031F
- Figure 156. UAE Postoperative Pain Market Share (%), By Distribution Channel, 2017-2031F
- Figure 157. South Africa Postoperative Pain Market, By Value, in USD Billion, 2017-2031F
- Figure 158. South Africa Postoperative Pain Market, By Volume, in Million Units, 2017-2031F
- Figure 159. South Africa Postoperative Pain Market Share (%), By Product, 2017-2031F
- Figure 160. South Africa Postoperative Pain Market Share (%), By Route of Administration, 2017-2031F
- Figure 161. South Africa Postoperative Pain Market Share (%), By Distribution Channel, 2017-2031F
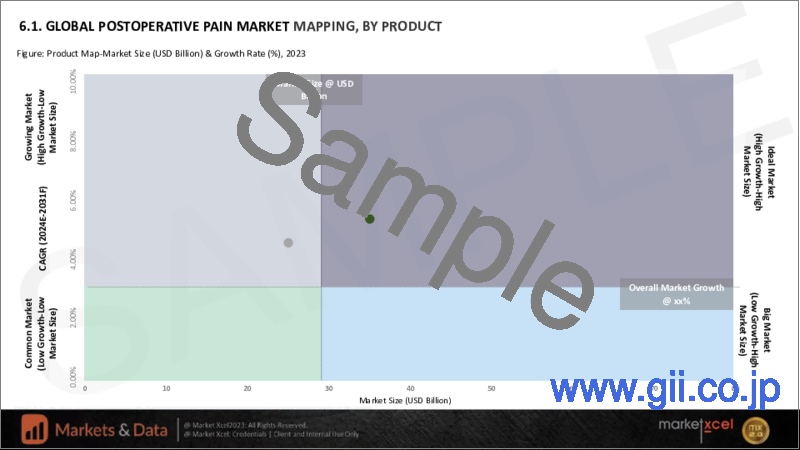
- Figure 162. By Product Map-Market Size (USD Billion) & Growth Rate (%), 2023
- Figure 163. By Route of Administration Map-Market Size (USD Billion) & Growth Rate (%), 2023
- Figure 164. By Distribution Channel Map-Market Size (USD Billion) & Growth Rate (%), 2023
- Figure 165. By Region Map-Market Size (USD Billion) & Growth Rate (%), 2023
Global postoperative pain market is projected to witness a CAGR of 5.25% during the forecast period 2024-2031, growing from USD 40.09 billion in 2023 to USD 60.36 billion in 2031. The market is anticipated to thrive under the influence of factors such as the increasing number of surgical procedures leading to high demands for efficient pain relief strategies and a rise in chronic conditions contributing to the necessity for effective post-surgical pain control. Additionally, concerns regarding opioid abuse have led to increased interest in exploring non-opioid alternatives for managing pain after surgery. Emphasis on improving patient compliance through eliminating post-operative pain is another major driving force for the market. Research and development initiatives driving innovation within the industry, providing novel approaches to reduce post-operative discomfort further expand the market. However, the major challenge for market expansion is the side effects associated with the use of opioid analgesic drugs and other complications with the use of pain management solutions. Drug abuse is another major concern related to pain management therapies as these methods involve the use of drug agents acting on the nervous system, leading to regulatory challenges.
For instance, in October 2023, Hyloris Pharma announced that it had received US FDA approval for the drug Maxigesic IV, which is meant to treat post-operative pain. Maxigesic IV contains a combination of paracetamol with ibuprofen solution for intravenous infusion, which helps in reducing postoperative pain and inflammation without the risk of opioid addiction. Hyloris Pharma is a Belgium-based company, and it developed the approved drug in collaboration with New Zealand-based drugmaker AFT Pharmaceuticals and Hikma Pharmaceuticals.
Increasing Number of Surgical Procedures
Most surgeries are necessary due to emergencies or other situations where only medication is not enough. The number of cancer cases requiring surgery, such as throat or mouth cancer, is rising globally. The demand for disposable surgical instruments is further propelled by chronic conditions like cardiovascular and gastrointestinal issues, and the surge in traffic accidents necessitating surgery. The market's significant expansion is aided by consumers' disposable income, which enables them to purchase these instruments. A high number of surgical procedures performed is directly linked with a high incidence of postoperative pain cases, and as the increase in both numbers is observed, the market expansion is promising. According to the World Health Organization (WHO), over 300 million surgical procedures are done globally annually. In October 2023, as per The Hindu, the rate of surgeries in India is between 166 and 3,646 surgeries per 100,000 individuals, depending on the setting, population, and other factors, while the population is about 1.4 billion. As per available data, more than 7 million surgical procedures were performed in the year 2022 within the United States.
Increasing Emphasis on Patient Compliance
Due to the rising emphasis on patient compliance, postoperative pain management has become a major concern. Many patients still experience moderate to severe pain after surgery, indicating inadequate postoperative pain management. The primary cause of this issue is insufficient analgesia prescription, not solely non-compliance. Patients' pain management can be neglected after discharge, so pain assessment, recording, and management are crucial aspects of care. Compliance with pain assessment in postoperative patients is vital, and the use of standard scales is recommended. Adequate analgesics and approved national pain guidelines are essential for effective pain management. Market players are constantly involved in product development and regulatory pathways to adequately cater to the market requirements.
In February 2024, Hikma Pharmaceuticals PLC announced the launch of COMBOGESIC IV injection in the United States market. COMBOGESIC IV is an opioid-free pain relief intravenous injection with a combination of 1000 mg acetaminophen and 300 mg ibuprofen. The combination drug was approved by the United States FDA in October 2023 for use in adults. Hikma Pharmaceuticals is a multinational pharmaceutical manufacturer working in a variety of indications and has a strong presence in the United States.
Dominance of Drug Segment and Fast Growth for Devices Segment
In the postoperative pain market, drugs are expected to dominate the product type category due to their extensive use in pain management compared to devices. Painkiller drugs, such as opioids, NSAIDs, and analgesics, are readily available and more cost-effective than pain management devices. The ease of administration without the need for medical assistance further contributes to the high usage of drugs. However, the adoption of pain management devices is increasing to avoid the side effects associated with drugs, leading to a higher growth rate in the pain management device segment. Despite the growing popularity of pain management devices, the drug segment is anticipated to dominate due to easy access, patient compliance, and cost-effectiveness.
In January 2024, Lupin launched a generic Bromfenac Ophthalmic Solution in the United States. This product is equivalent to Bausch & Lomb Inc.'s Prolensa ophthalmic solution, and it has received approval from the U.S. Food and Drug Administration. Lupin is the first company to file for this generic medication, granting it exclusive rights for 180 days. Bromfenac Ophthalmic Solution is intended to treat postoperative pain, and inflammation, along with alleviating eye discomfort in patients who have undergone cataract surgery.
Oral Route of Administration to be Leading Segment
In the management of postoperative pain, administering painkillers through the oral route is widely regarded as the most effective method, particularly if there are no contraindications. This approach excels in terms of simplicity, non-invasiveness, and patient acceptance compared to other routes such as injectables or inhalation. Oral opioids are effective in addressing acute pain, despite their slower action compared to injections. They are typically taken as pills that act rapidly or as sustained-release tablets. For better pain control, a combination of different types of pain relievers and non-drug therapies, known as multimodal analgesia, is commonly recommended over relying solely on opioids.
In February 2024, Cytogel Pharma's drug Cyt-1010 is undergoing clinical trials, specifically in Phase I for treating pain after surgery. Drugs in Phase I for this purpose typically have a high chance, around 87%, of moving forward to Phase II. Cyt-1010 is a distinct compound, like endomorphin 1, a natural pain regulator. It can be administered either orally or intravenously, interacting with Mu opioid receptors to manage pain.
North America to be the Dominating Region
North America is expected to dominate the market share throughout the assessment period owing to factors, including the high prevalence and severity of postoperative pain, the adoption of opioid management treatment to reduce the opioid epidemic, and the presence of a strong drug pipeline with effective drugs coming up for approvals by the US Food and Drug Administration. Additionally, the region has a high number of surgical procedures, increasing demand for pain management drugs, and rising awareness regarding post-surgery pain control. The presence of key market players like Novartis AG, Allergan plc., Teva Pharmaceutical Industries Ltd., Mylan N.V., and Pfizer Inc. in the region is another factor strengthening the lead of North America in the region. US FDA efforts to strengthen pain management methods also catalyze market growth.
In September 2023, the US FDA granted cooperative support to develop two clinical practice guidelines using evidence-based approaches. One guideline will focus on the treatment of recent-onset lower back pain, while the other will focus on the management of pain after laparoscopic abdominal surgery.
Future Market Scenario (2024 - 2031F)
In the future, postoperative pain management will most likely involve more acute pain services (APSs) and better communication among surgery, anesthesiology, and acute pain departments. The use of multimodal analgesics may enhance pain relief after surgery. The occurrence of chronic pain after surgery differs depending on the surgical complications but is very common. Innovative approaches, like transitional pain services, aim to improve the management of acute and chronic pain after surgery. Alongside, exploring new metabolic pathways and biological targets to provide pain relief without any drug abuse and product development seems like a promising concept for future growth of the market. For instance, in October 2023, South Rampart Pharma, a company focused on safer pain treatments, received Fast Track status for its promising drug, SRP-001, from the US FDA. SRP-001 stands out as a novel, non-addictive painkiller that operates differently from conventional opioids. The Fast Track designation is designed to accelerate the development and review process for promising therapies that address serious conditions. This pathway aims to ensure that patients have access to effective treatments quickly, thereby meeting pressing medical needs.
Key Players Landscape and Outlook
Novartis AG, Allergan plc, Teva Pharmaceutical Industries Ltd., Mylan N.V., Pfizer Inc., GlaxoSmithKline Plc., Johnson & Johnson Pte. Ltd., AstraZeneca PLC, Sanofi S.A., are some of the renowned players of the postoperative pain management market. These players actively invest time and money in innovative product developments and regulatory approvals. Market tactics like mergers and acquisitions and collaborations among market players are anticipated to further drive market expansion.
In November 2023, BehaVR and Fern Health joined forces to establish RealizedCare, a digital care management solution tailored for chronic pain. This collaboration aims to address the growing need for proven, scalable, and cost-effective interventions for mental and behavioral health issues, with an initial focus on chronic pain.
Table of Contents
1. Research Methodology
2. Project Scope & Definitions
3. Executive Summary
4. Global Postoperative Pain Market Outlook, 2017-2031F
- 4.1. Market Size & Forecast
- 4.1.1. By Value
- 4.1.2. By Volume
- 4.2. By Product
- 4.2.1. Drugs
- 4.2.1.1. Opioids
- 4.2.1.2. Cyclooxygenase-2-Selective(COX-2) Inhibitors
- 4.2.1.3. Non-steroidal Anti-inflammatory Drugs (NSAIDs)
- 4.2.1.4. Anesthetics
- 4.2.1.5. Anticonvulsants
- 4.2.1.6. Anti-depressants
- 4.2.1.7. Other Non-narcotic Analgesics
- 4.2.2. Devices
- 4.2.2.1. Neurostimulation Devices
- 4.2.2.2. Brain and Spinal Cord Stimulation (SCS) Devices
- 4.2.2.3. Analgesics Infusion Pumps
- 4.2.1. Drugs
- 4.3. By Route of Administration
- 4.3.1. Injectable
- 4.3.2. Oral
- 4.3.3. Topical
- 4.3.4. Transdermal
- 4.3.5. Others
- 4.4. By Distribution Channel
- 4.4.1. Hospital Pharmacies
- 4.4.2. Retail Pharmacies
- 4.4.3. Online Pharmacies
- 4.5. By Region
- 4.5.1. North America
- 4.5.2. Europe
- 4.5.3. Asia-Pacific
- 4.5.4. South America
- 4.5.5. Middle East and Africa
- 4.6. By Company Market Share (%), 2023
5. Global Postoperative Pain Market Outlook, By Region, 2017-2031F
- 5.1. North America*
- 5.1.1. Market Size & Forecast
- 5.1.1.1. By Value
- 5.1.1.2. By Volume
- 5.1.2. By Product
- 5.1.2.1. Drugs
- 5.1.2.1.1. Opioids
- 5.1.2.1.2. Cyclooxygenase-2-Selective(COX-2),Inhibitors
- 5.1.2.1.3. Non-steroidal Anti-inflammatory Drugs (NSAIDs)
- 5.1.2.1.4. Anesthetics
- 5.1.2.1.5. Anticonvulsants
- 5.1.2.1.6. Anti-depressants
- 5.1.2.1.7. Other Non-narcotic Analgesics
- 5.1.2.2. Devices
- 5.1.2.2.1. Neurostimulation Devices
- 5.1.2.2.2. Brain and Spinal Cord Stimulation (SCS) Devices
- 5.1.2.2.3. Analgesics Infusion Pumps
- 5.1.3. By Route of Administration
- 5.1.3.1. Injectable
- 5.1.3.2. Oral
- 5.1.3.3. Topical
- 5.1.3.4. Transdermal
- 5.1.3.5. Others
- 5.1.4. By Distribution Channel
- 5.1.4.1. Hospital Pharmacies
- 5.1.4.2. Retail Pharmacies
- 5.1.4.3. Online Pharmacies
- 5.1.5. United States*
- 5.1.5.1. Market Size & Forecast
- 5.1.5.1.1. By Value
- 5.1.5.1.2. By Volume
- 5.1.5.2. By Product
- 5.1.5.2.1. Drugs
- 5.1.5.2.1.1. Opioids
- 5.1.5.2.1.2. Cyclooxygenase-2-Selective(COX-2),Inhibitors
- 5.1.5.2.1.3. Non-steroidal Anti-inflammatory Drugs (NSAIDs)
- 5.1.5.2.1.4. Anesthetics
- 5.1.5.2.1.5. Anticonvulsants
- 5.1.5.2.1.6. Anti-depressants
- 5.1.5.2.1.7. Other Non-narcotic Analgesics
- 5.1.5.2.2. Devices
- 5.1.5.2.2.1. Neurostimulation Devices
- 5.1.5.2.2.2. Brain and Spinal Cord Stimulation (SCS) Devices
- 5.1.5.2.2.3. Analgesics Infusion Pumps
- 5.1.5.3. By Route of Administration
- 5.1.5.3.1. Injectable
- 5.1.5.3.2. Oral
- 5.1.5.3.3. Topical
- 5.1.5.3.4. Transdermal
- 5.1.5.3.5. Others
- 5.1.5.4. By Distribution Channel
- 5.1.5.4.1. Hospital Pharmacies
- 5.1.5.4.2. Retail Pharmacies
- 5.1.5.4.3. Online Pharmacies
- 5.1.6. Canada
- 5.1.7. Mexico
- 5.1.1. Market Size & Forecast
All segments will be provided for all regions and countries covered
- 5.2. Europe
- 5.2.1. Germany
- 5.2.2. France
- 5.2.3. Italy
- 5.2.4. United Kingdom
- 5.2.5. Russia
- 5.2.6. Netherlands
- 5.2.7. Spain
- 5.2.8. Turkey
- 5.2.9. Poland
- 5.3. Asia-Pacific
- 5.3.1. India
- 5.3.2. China
- 5.3.3. Japan
- 5.3.4. Australia
- 5.3.5. Vietnam
- 5.3.6. South Korea
- 5.3.7. Indonesia
- 5.3.8. Philippines
- 5.4. South America
- 5.4.1. Brazil
- 5.4.2. Argentina
- 5.5. Middle East & Africa
- 5.5.1. Saudi Arabia
- 5.5.2. UAE
- 5.5.3. South Africa
6. Market Mapping, 2023
- 6.1. By Product
- 6.2. By Route of Administration
- 6.3. By Distribution Channel
- 6.4. By Region
7. Macro Environment and Industry Structure
- 7.1. Demand Supply Analysis
- 7.2. Import Export Analysis
- 7.3. Value Chain Analysis
- 7.4. PESTEL Analysis
- 7.4.1. Political Factors
- 7.4.2. Economic System
- 7.4.3. Social Implications
- 7.4.4. Technological Advancements
- 7.4.5. Environmental Impacts
- 7.4.6. Legal Compliances and Regulatory Policies (Statutory Bodies Included)
- 7.5. Porter's Five Forces Analysis
- 7.5.1. Supplier Power
- 7.5.2. Buyer Power
- 7.5.3. Substitution Threat
- 7.5.4. Threat from New Entrant
- 7.5.5. Competitive Rivalry
8. Market Dynamics
- 8.1. Growth Drivers
- 8.2. Growth Inhibitors (Challenges and Restraints)
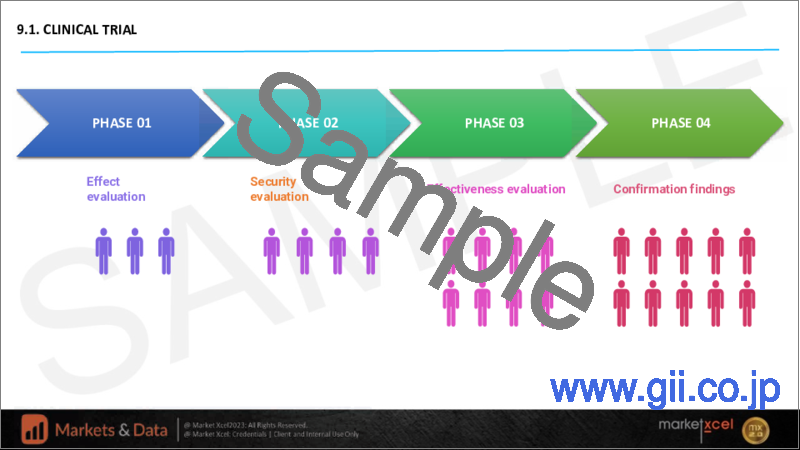
9. Regulatory Framework and Innovation
- 9.1. Clinical Trials
- 9.2. Patent Landscape
- 9.3. Regulatory Approvals
- 9.4. Innovations/Emerging Technologies
10. Key Players Landscape
- 10.1. Competition Matrix of Top Five Market Leaders
- 10.2. Market Revenue Analysis of Top Five Market Leaders (in %, 2023)
- 10.3. Mergers and Acquisitions/Joint Ventures (If Applicable)
- 10.4. SWOT Analysis (For Five Market Players)
11. Pricing Analysis
12. Case Studies
13. Key Players Outlook
- 13.1. Novartis AG
- 13.1.1. Company Details
- 13.1.2. Key Management Personnel
- 13.1.3. Products & Services
- 13.1.4. Financials (As reported)
- 13.1.5. Key Market Focus & Geographical Presence
- 13.1.6. Recent Developments
- 13.2. Allergan plc
- 13.3. Teva Pharmaceutical Industries Ltd.
- 13.4. Mylan N.V.
- 13.5. Pfizer Inc.
- 13.6. GlaxoSmithKline Plc.
- 13.7. Johnson & Johnson Pte. Ltd.
- 13.8. AstraZeneca PLC
- 13.9. Sanofi S.A.
- 13.10. Cipla Inc. (InvaGen Pharmaceuticals Inc.)
Companies mentioned above DO NOT hold any order as per market share and can be changed as per information available during research work.

