|
|
市場調査レポート
商品コード
1429008
エンジニアドマテリアルアレスティングシステム市場:システム別、プラットフォーム別、最終用途別、地域別、機会、予測、2017年~2031年Engineered Material Arresting System Market Assessment, By System, By Platform, By End-use, By Region, Opportunities and Forecast, 2017-2031F |
||||||
|
|||||||
カスタマイズ可能
|
|||||||

| エンジニアドマテリアルアレスティングシステム市場:システム別、プラットフォーム別、最終用途別、地域別、機会、予測、2017年~2031年 |
|
出版日: 2024年02月20日
発行: Markets & Data
ページ情報: 英文 221 Pages
納期: 3~5営業日
|

全表示
- 概要
- 図表
- 目次
世界のエンジニアドマテリアルアレスティングシステムの市場規模は、予測期間の2024年~2031年に7.38%のCAGRで拡大し、2023年の8億5,191万米ドルから2031年には15億585万米ドルに成長すると予測されています。同市場は近年著しい成長を遂げており、今後も堅調な拡大ペースを維持すると予想されます。
エンジニアドマテリアルアレスティングシステム(EMAS)は、アレスターベッドとも呼ばれ、滑走路の端に設置され、滑走路からの逸脱の深刻さを軽減するためのベッドまたはプラットフォームです。採用される人工材料は、航空機の圧力で押しつぶされる可能性のある、特定の強度を持つ高エネルギー吸収材料であり、それによって損傷の深刻さを軽減します。人工材料によるアレスティングシステム市場は、アレスティングギア技術の進歩、滑走路の安全性に対する支出の増加、政府の厳しい規制などにより成長を遂げています。しかし、人工材料によるアレスティングシステムの開拓と維持には多額のコストがかかるため、市場の拡大には限界があります。それとは逆に、少ない人員と限られた土地使用の必要性が、今後のエンジニアドマテリアルアレスティングシステム市場の成長を後押しするとみられています。
商業空港の数が拡大するにつれて、エンジニアドマテリアルアレスティングシステムに対する需要が増加しています。空の旅の人気とアクセスが高まるにつれ、航空会社と空港は乗客と乗員の安全を第一に考えるようになっています。エンジニアドマテリアルアレスティングシステムは、事故を防ぎ人命を救うための重要な安全対策です。アレスティングシステムは、飛行機が自力で停止できない場合など、緊急時に飛行機を停止させるために使用されます。そのため、空港や航空会社にとっては多額の出費となります。
当レポートでは、世界のエンジニアドマテリアルアレスティングシステム市場について調査し、市場の概要とともに、システム別、プラットフォーム別、最終用途別、地域別動向、および市場に参入する企業のプロファイルなどを提供しています。
目次
第1章 調査手法
第2章 プロジェクトの範囲と定義
第3章 エグゼクティブサマリー
第4章 お客様の声
第5章 世界のエンジニアドマテリアルアレスティングシステム市場の見通し、2017年~2031年
- 市場規模と予測
- システム別
- プラットフォーム別
- 最終用途別
- 地域別
- 企業別市場シェア(%)、2023年
第6章 世界のエンジニアドマテリアルアレスティングシステム市場の見通し、地域別、2017年~2031年
- 北米
- 欧州
- アジア太平洋
- 南米
- 中東・アフリカ
第7章 市場マッピング、2023年
第8章 マクロ環境と産業構造
- 需要供給分析
- 輸出入分析
- バリューチェーン分析
- PESTEL分析
- ポーターのファイブフォース分析
第9章 市場力学
第10章 主要参入企業の情勢
第11章 価格分析
第12章 ケーススタディ
第13章 主要企業の見通し
- Runway Safe Group
- General Atomics
- A-tech, Inc.
- QinetiQ Group plc
- Curtis-Wright Corporation
- Wire Rope Industries
- Scandinavian Manufacturing SCAMA AB
- Crawford, Murphy & Tilly, Inc.
- Aries S.A.
- Hangke Technology Development Co., Ltd.
第14章 戦略的提言
第15章 お問合せと免責事項
List of Tables
- Table 1. Pricing Analysis of Products from Key Players
- Table 2. Competition Matrix of Top 5 Market Leaders
- Table 3. Mergers & Acquisitions/ Joint Ventures (If Applicable)
- Table 4. About Us - Regions and Countries Where We Have Executed Client Projects
List of Figures
- Figure 1. Global Engineered Material Arresting System Market, By Value, in USD Million, 2017-2031F
- Figure 2. Global Engineered Material Arresting System Market, By Volume, in Units, 2017-2031F
- Figure 3. Global Engineered Material Arresting System Market Share (%), By System, 2017-2031F
- Figure 4. Global Engineered Material Arresting System Market Share (%), By Platform, 2017-2031F
- Figure 5. Global Engineered Material Arresting System Market Share (%), By End-use, 2017-2031F
- Figure 6. Global Engineered Material Arresting System Market Share (%), By Region, 2017-2031F
- Figure 7. North America Engineered Material Arresting System Market, By Value, in USD Million, 2017-2031F
- Figure 8. North America Engineered Material Arresting System Market, By Volume, in Units, 2017-2031F
- Figure 9. North America Engineered Material Arresting System Market Share (%), By System, 2017-2031F
- Figure 10. North America Engineered Material Arresting System Market Share (%), By Platform, 2017-2031F
- Figure 11. North America Engineered Material Arresting System Market Share (%), By End-use, 2017-2031F
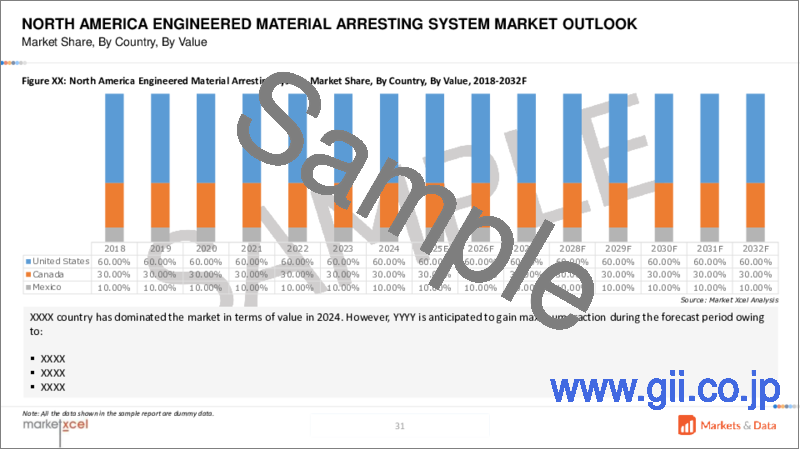
- Figure 12. North America Engineered Material Arresting System Market Share (%), By Country, 2017-2031F
- Figure 13. United States Engineered Material Arresting System Market, By Value, in USD Million, 2017-2031F
- Figure 14. United States Engineered Material Arresting System Market, By Volume, in Units, 2017-2031F
- Figure 15. United States Engineered Material Arresting System Market Share (%), By System, 2017-2031F
- Figure 16. United States Engineered Material Arresting System Market Share (%), By Platform, 2017-2031F
- Figure 17. United States Engineered Material Arresting System Market Share (%), By End-use, 2017-2031F
- Figure 18. Canada Engineered Material Arresting System Market, By Value, in USD Million, 2017-2031F
- Figure 19. Canada Engineered Material Arresting System Market, By Volume, in Units, 2017-2031F
- Figure 20. Canada Engineered Material Arresting System Market Share (%), By System, 2017-2031F
- Figure 21. Canada Engineered Material Arresting System Market Share (%), By Platform, 2017-2031F
- Figure 22. Canada Engineered Material Arresting System Market Share (%), By End-use, 2017-2031F
- Figure 23. Mexico Engineered Material Arresting System Market, By Value, in USD Million, 2017-2031F
- Figure 24. Mexico Engineered Material Arresting System Market, By Volume, in Units, 2017-2031F
- Figure 25. Mexico Engineered Material Arresting System Market Share (%), By System, 2017-2031F
- Figure 26. Mexico Engineered Material Arresting System Market Share (%), By Platform, 2017-2031F
- Figure 27. Mexico Engineered Material Arresting System Market Share (%), By End-use, 2017-2031F
- Figure 28. Europe Engineered Material Arresting System Market, By Value, in USD Million, 2017-2031F
- Figure 29. Europe Engineered Material Arresting System Market, By Volume, in Units, 2017-2031F
- Figure 30. Europe Engineered Material Arresting System Market Share (%), By System, 2017-2031F
- Figure 31. Europe Engineered Material Arresting System Market Share (%), By Platform, 2017-2031F
- Figure 32. Europe Engineered Material Arresting System Market Share (%), By End-use, 2017-2031F
- Figure 33. Europe Engineered Material Arresting System Market Share (%), By Country, 2017-2031F
- Figure 34. Germany Engineered Material Arresting System Market, By Value, in USD Million, 2017-2031F
- Figure 35. Germany Engineered Material Arresting System Market, By Volume, in Units, 2017-2031F
- Figure 36. Germany Engineered Material Arresting System Market Share (%), By System, 2017-2031F
- Figure 37. Germany Engineered Material Arresting System Market Share (%), By Platform, 2017-2031F
- Figure 38. Germany Engineered Material Arresting System Market Share (%), By End-use, 2017-2031F
- Figure 39. France Engineered Material Arresting System Market, By Value, in USD Million, 2017-2031F
- Figure 40. France Engineered Material Arresting System Market, By Volume, in Units, 2017-2031F
- Figure 41. France Engineered Material Arresting System Market Share (%), By System, 2017-2031F
- Figure 42. France Engineered Material Arresting System Market Share (%), By Platform, 2017-2031F
- Figure 43. France Engineered Material Arresting System Market Share (%), By End-use, 2017-2031F
- Figure 44. Italy Engineered Material Arresting System Market, By Value, in USD Million, 2017-2031F
- Figure 45. Italy Engineered Material Arresting System Market, By Volume, in Units, 2017-2031F
- Figure 46. Italy Engineered Material Arresting System Market Share (%), By System, 2017-2031F
- Figure 47. Italy Engineered Material Arresting System Market Share (%), By Platform, 2017-2031F
- Figure 48. Italy Engineered Material Arresting System Market Share (%), By End-use, 2017-2031F
- Figure 49. United Kingdom Engineered Material Arresting System Market, By Value, in USD Million, 2017-2031F
- Figure 50. United Kingdom Engineered Material Arresting System Market, By Volume, in Units, 2017-2031F
- Figure 51. United Kingdom Engineered Material Arresting System Market Share (%), By System, 2017-2031F
- Figure 52. United Kingdom Engineered Material Arresting System Market Share (%), By Platform, 2017-2031F
- Figure 53. United Kingdom Engineered Material Arresting System Market Share (%), By End-use, 2017-2031F
- Figure 54. Russia Engineered Material Arresting System Market, By Value, in USD Million, 2017-2031F
- Figure 55. Russia Engineered Material Arresting System Market, By Volume, in Units, 2017-2031F
- Figure 56. Russia Engineered Material Arresting System Market Share (%), By System, 2017-2031F
- Figure 57. Russia Engineered Material Arresting System Market Share (%), By Platform, 2017-2031F
- Figure 58. Russia Engineered Material Arresting System Market Share (%), By End-use, 2017-2031F
- Figure 59. Netherlands Engineered Material Arresting System Market, By Value, in USD Million, 2017-2031F
- Figure 60. Netherlands Engineered Material Arresting System Market, By Volume, in Units, 2017-2031F
- Figure 61. Netherlands Engineered Material Arresting System Market Share (%), By System, 2017-2031F
- Figure 62. Netherlands Engineered Material Arresting System Market Share (%), By Platform, 2017-2031F
- Figure 63. Netherlands Engineered Material Arresting System Market Share (%), By End-use, 2017-2031F
- Figure 64. Spain Engineered Material Arresting System Market, By Value, in USD Million, 2017-2031F
- Figure 65. Spain Engineered Material Arresting System Market, By Volume, in Units, 2017-2031F
- Figure 66. Spain Engineered Material Arresting System Market Share (%), By System, 2017-2031F
- Figure 67. Spain Engineered Material Arresting System Market Share (%), By Platform, 2017-2031F
- Figure 68. Spain Engineered Material Arresting System Market Share (%), By End-use, 2017-2031F
- Figure 69. Turkey Engineered Material Arresting System Market, By Value, in USD Million, 2017-2031F
- Figure 70. Turkey Engineered Material Arresting System Market, By Volume, in Units, 2017-2031F
- Figure 71. Turkey Engineered Material Arresting System Market Share (%), By System, 2017-2031F
- Figure 72. Turkey Engineered Material Arresting System Market Share (%), By Platform, 2017-2031F
- Figure 73. Turkey Engineered Material Arresting System Market Share (%), By End-use, 2017-2031F
- Figure 74. Poland Engineered Material Arresting System Market, By Value, in USD Million, 2017-2031F
- Figure 75. Poland Engineered Material Arresting System Market, By Volume, in Units, 2017-2031F
- Figure 76. Poland Engineered Material Arresting System Market Share (%), By System, 2017-2031F
- Figure 77. Poland Engineered Material Arresting System Market Share (%), By Platform, 2017-2031F
- Figure 78. Poland Engineered Material Arresting System Market Share (%), By End-use, 2017-2031F
- Figure 79. South America Engineered Material Arresting System Market, By Value, in USD Million, 2017-2031F
- Figure 80. South America Engineered Material Arresting System Market, By Volume, in Units, 2017-2031F
- Figure 81. South America Engineered Material Arresting System Market Share (%), By System, 2017-2031F
- Figure 82. South America Engineered Material Arresting System Market Share (%), By Platform, 2017-2031F
- Figure 83. South America Engineered Material Arresting System Market Share (%), By End-use, 2017-2031F
- Figure 84. South America Engineered Material Arresting System Market Share (%), By Country, 2017-2031F
- Figure 85. Brazil Engineered Material Arresting System Market, By Value, in USD Million, 2017-2031F
- Figure 86. Brazil Engineered Material Arresting System Market, By Volume, in Units, 2017-2031F
- Figure 87. Brazil Engineered Material Arresting System Market Share (%), By System, 2017-2031F
- Figure 88. Brazil Engineered Material Arresting System Market Share (%), By Platform, 2017-2031F
- Figure 89. Brazil Engineered Material Arresting System Market Share (%), By End-use, 2017-2031F
- Figure 90. Argentina Engineered Material Arresting System Market, By Value, in USD Million, 2017-2031F
- Figure 91. Argentina Engineered Material Arresting System Market, By Volume, in Units, 2017-2031F
- Figure 92. Argentina Engineered Material Arresting System Market Share (%), By System, 2017-2031F
- Figure 93. Argentina Engineered Material Arresting System Market Share (%), By Platform, 2017-2031F
- Figure 94. Argentina Engineered Material Arresting System Market Share (%), By End-use, 2017-2031F
- Figure 95. Asia-Pacific Engineered Material Arresting System Market, By Value, in USD Million, 2017-2031F
- Figure 96. Asia-Pacific Engineered Material Arresting System Market, By Volume, in Units, 2017-2031F
- Figure 97. Asia-Pacific Engineered Material Arresting System Market Share (%), By System, 2017-2031F
- Figure 98. Asia-Pacific Engineered Material Arresting System Market Share (%), By Platform, 2017-2031F
- Figure 99. Asia-Pacific Engineered Material Arresting System Market Share (%), By End-use, 2017-2031F
- Figure 100. Asia-Pacific Engineered Material Arresting System Market Share (%), By Country, 2017-2031F
- Figure 101. India Engineered Material Arresting System Market, By Value, in USD Million, 2017-2031F
- Figure 102. India Engineered Material Arresting System Market, By Volume, in Units, 2017-2031F
- Figure 103. India Engineered Material Arresting System Market Share (%), By System, 2017-2031F
- Figure 104. India Engineered Material Arresting System Market Share (%), By Platform, 2017-2031F
- Figure 105. India Engineered Material Arresting System Market Share (%), By End-use, 2017-2031F
- Figure 106. China Engineered Material Arresting System Market, By Value, in USD Million, 2017-2031F
- Figure 107. China Engineered Material Arresting System Market, By Volume, in Units, 2017-2031F
- Figure 108. China Engineered Material Arresting System Market Share (%), By System, 2017-2031F
- Figure 109. China Engineered Material Arresting System Market Share (%), By Platform, 2017-2031F
- Figure 110. China Engineered Material Arresting System Market Share (%), By End-use, 2017-2031F
- Figure 111. Japan Engineered Material Arresting System Market, By Value, in USD Million, 2017-2031F
- Figure 112. Japan Engineered Material Arresting System Market, By Volume, in Units, 2017-2031F
- Figure 113. Japan Engineered Material Arresting System Market Share (%), By System, 2017-2031F
- Figure 114. Japan Engineered Material Arresting System Market Share (%), By Platform, 2017-2031F
- Figure 115. Japan Engineered Material Arresting System Market Share (%), By End-use, 2017-2031F
- Figure 116. Australia Engineered Material Arresting System Market, By Value, in USD Million, 2017-2031F
- Figure 117. Australia Engineered Material Arresting System Market, By Volume, in Units, 2017-2031F
- Figure 118. Australia Engineered Material Arresting System Market Share (%), By System, 2017-2031F
- Figure 119. Australia Engineered Material Arresting System Market Share (%), By Platform, 2017-2031F
- Figure 120. Australia Engineered Material Arresting System Market Share (%), By End-use, 2017-2031F
- Figure 121. Vietnam Engineered Material Arresting System Market, By Value, in USD Million, 2017-2031F
- Figure 122. Vietnam Engineered Material Arresting System Market, By Volume, in Units, 2017-2031F
- Figure 123. Vietnam Engineered Material Arresting System Market Share (%), By System, 2017-2031F
- Figure 124. Vietnam Engineered Material Arresting System Market Share (%), By Platform, 2017-2031F
- Figure 125. Vietnam Engineered Material Arresting System Market Share (%), By End-use, 2017-2031F
- Figure 126. South Korea Engineered Material Arresting System Market, By Value, in USD Million, 2017-2031F
- Figure 127. South Korea Engineered Material Arresting System Market, By Volume, in Units, 2017-2031F
- Figure 128. South Korea Engineered Material Arresting System Market Share (%), By System, 2017-2031F
- Figure 129. South Korea Engineered Material Arresting System Market Share (%), By Platform, 2017-2031F
- Figure 130. South Korea Engineered Material Arresting System Market Share (%), By End-use, 2017-2031F
- Figure 131. Indonesia Engineered Material Arresting System Market, By Value, in USD Million, 2017-2031F
- Figure 132. Indonesia Engineered Material Arresting System Market, By Volume, in Units, 2017-2031F
- Figure 133. Indonesia Engineered Material Arresting System Market Share (%), By System, 2017-2031F
- Figure 134. Indonesia Engineered Material Arresting System Market Share (%), By Platform, 2017-2031F
- Figure 135. Indonesia Engineered Material Arresting System Market Share (%), By End-use, 2017-2031F
- Figure 136. Philippines Engineered Material Arresting System Market, By Value, in USD Million, 2017-2031F
- Figure 137. Philippines Engineered Material Arresting System Market, By Volume, in Units, 2017-2031F
- Figure 138. Philippines Engineered Material Arresting System Market Share (%), By System, 2017-2031F
- Figure 139. Philippines Engineered Material Arresting System Market Share (%), By Platform, 2017-2031F
- Figure 140. Philippines Engineered Material Arresting System Market Share (%), By End-use, 2017-2031F
- Figure 141. Middle East & Africa Engineered Material Arresting System Market, By Value, in USD Million, 2017-2031F
- Figure 142. Middle East & Africa Engineered Material Arresting System Market, By Volume, in Units, 2017-2031F
- Figure 143. Middle East & Africa Engineered Material Arresting System Market Share (%), By System, 2017-2031F
- Figure 144. Middle East & Africa Engineered Material Arresting System Market Share (%), By Platform, 2017-2031F
- Figure 145. Middle East & Africa Engineered Material Arresting System Market Share (%), By End-use, 2017-2031F
- Figure 146. Middle East & Africa Engineered Material Arresting System Market Share (%), By Country, 2017-2031F
- Figure 147. Saudi Arabia Engineered Material Arresting System Market, By Value, in USD Million, 2017-2031F
- Figure 148. Saudi Arabia Engineered Material Arresting System Market, By Volume, in Units, 2017-2031F
- Figure 149. Saudi Arabia Engineered Material Arresting System Market Share (%), By System, 2017-2031F
- Figure 150. Saudi Arabia Engineered Material Arresting System Market Share (%), By Platform, 2017-2031F
- Figure 151. Saudi Arabia Engineered Material Arresting System Market Share (%), By End-use, 2017-2031F
- Figure 152. UAE Engineered Material Arresting System Market, By Value, in USD Million, 2017-2031F
- Figure 153. UAE Engineered Material Arresting System Market, By Volume, in Units, 2017-2031F
- Figure 154. UAE Engineered Material Arresting System Market Share (%), By System, 2017-2031F
- Figure 155. UAE Engineered Material Arresting System Market Share (%), By Platform, 2017-2031F
- Figure 156. UAE Engineered Material Arresting System Market Share (%), By End-use, 2017-2031F
- Figure 157. South Africa Engineered Material Arresting System Market, By Value, in USD Million, 2017-2031F
- Figure 158. South Africa Engineered Material Arresting System Market, By Volume, in Units, 2017-2031F
- Figure 159. South Africa Engineered Material Arresting System Market Share (%), By System, 2017-2031F
- Figure 160. South Africa Engineered Material Arresting System Market Share (%), By Platform, 2017-2031F
- Figure 161. South Africa Engineered Material Arresting System Market Share (%), By End-use, 2017-2031F
- Figure 162. By System Map-Market Size (USD Million) & Growth Rate (%), 2023
- Figure 163. By Platform Map-Market Size (USD Million) & Growth Rate (%), 2023
- Figure 164. By End-use Map-Market Size (USD Million) & Growth Rate (%), 2023
- Figure 165. By Region Map-Market Size (USD Million) & Growth Rate (%), 2023
Global Engineered Material Arresting System Market is projected to witness a CAGR of 7.38% during the forecast period 2024-2031, growing from USD 851.91 million in 2023 to USD 1505.85 million in 2031. The market has experienced significant growth in recent years and is expected to maintain a strong pace of expansion in the coming years.
The Engineered Material Arresting System (EMAS), also known as the arrestor bed, is a bed or platform built at the end of the runway to lessen the severity of a runway excursion. The engineered material employed is a high energy absorbent material of specified strength that has the potential to crush under the pressure of the aircraft, thereby lessening the severity of the damage. The engineered material arresting system market is experiencing growth due to advancement in arresting gear technologies, increased spending on runway safety and strict government regulations. However, the significant costs associated with developing and maintaining engineered material arresting systems limit market expansion. On the contrary, the need for low manpower and limited land use is likely to boost the growth of the engineered material arresting system market in the future.
The expanding number of commercial airports has resulted in increased demand for engineering material arresting systems. As air travel grows more popular and accessible, airlines and airports put passengers' and crews' safety first. Engineered material arresting systems are an important safety measure that can help to prevent accidents and save lives. They are used to bring an airplane to a halt in an emergency, such as when it is unable to stop on its own. As a result, they represent a significant expenditure for airports and airlines.
For instance, in June 2023, the Sedona Airport in Arizona, USA, started the USD 40 million runway safety project with funding from the Federal Aviation Administration, the Arizona Department of Transportation and the Sedona-Oak Creek Airport Authority. The project includes construction of retaining walls at each end of the runway to allow installation of engineered materials arresting systems (EMAS) beds.
Expansion of Commercial Airport Industry
The commercial airport industry is a significant driver of the Global Engineered Material Arresting System Market. With the ongoing growth in air travel and the expansion of the global airport industry, there is an increasing need for enhanced runway safety and emergency landing capabilities. The demand for commercial aircraft, including large passenger jets and cargo planes, continues to rise, resulting in more extensive and busier airport operations.
For example, in February 2023, India's largest airline InterGlobe Aviation Ltd. (IndiGo) announced to form a partnership with Turkish Airlines, to expand its footprint in Europe. The airline is set to receive 500 additional aircraft from aircraft manufacturer, Airbus SE, for this expansion. Currently, IndiGo has more than 300 aircraft in its fleet, operating to 76 domestic and 26 international destinations.
Advancements in Aircraft Technology Driving the Market
Advances in aircraft technology are a significant driver of the engineered materials arresting system market. Aircraft are getting more advanced, with a focus on higher performance, shorter takeoff and landing distances, and better safety features. These technological advancements include more powerful engines, lightweight materials, and superior avionics, resulting in aircraft that require novel arresting devices to supplement their capabilities.
For example, in August 2023, NASA developed a quiet supersonic aircraft called X-59, aiming to change regulations and enable flights at speeds ranging from Mach 2 and Mach 4. With this, the agency is exploring the possibility of supersonic travel that could reduce transoceanic flight times significantly.
Safety Concerns & Government Regulations Acting as Catalyst
Aviation safety is of the utmost importance, and arresting systems play a critical role in reducing the risks connected with takeoff, landing, and emergencies. Aviation authorities and organizations around the world have severe safety regulations, requiring the deployment of arresting devices at airports and aircraft carriers. For military operations, arresting devices ensure that military aircraft can safely land on aircraft carriers' small decks, even in severe conditions. Regulations in the commercial aviation sector include requirements for emergency landing capabilities as well as safety measures such as the installation of arresting devices at airports. Ensuring compliance with government laws is a driving force in the global engineered material arrested system market, as airports strive to improve their safety and security.
For example, in September 2020, the Supreme Court of India sought responses from the Central Goevrnment and the Directorate General of Civil Aviation on a plea seeking installation of engineered materials arresting system at airports having table-top runways. Here, it referred to the tragic accident of Air India plane crash at Kozhikode airport in August 2020, which left 21 people dead including both pilots.
Dominance of Ground Based Platforms
The ground-based sector of the market is predicted to have the highest growth rate in the future. This growth is primarily due to the usage of modern engineered materials arresting systems (EMAS) in ground-based platforms such as airports and military sites to improve runway safety by utilizing a series of crushable blocks to limit an aircraft's speed during an emergency overrun. The construction of new airports is likely to drive market expansion during the forecast period.
For instance, in January 2021, Runway Safe Group agreed to provide South America's first EMAS system, which will be installed at Congonhas Airport, Sao Paulo in Brazil. Kibag Brazil Ltda and Conserva de Estradas Ltda, two construction firm have been awarded the contract by INFRAERO to install two Runway Safe's greenEMAS solution.
Asia-Pacific Expected to Drive the Market
Asia-Pacific is expected to witness the highest growth during the forecast period. The significant rise is primarily due to increasing aircraft carrier construction and procurement plans and increasing investments in construction and modernization of airport infrastructure in India, China, Japan, South Korea, Thailand, and Indonesia. Furthermore, the rise in air passenger traffic and a growing requirement for airport safety and security in the region is driving the market.
For instance, according to the International Air Transport Association (IATA), India is expected to overtake China and USA as the world's third largest air passenger market by 2030. India's passenger volume is expected to reach 412 million in FY2024-25, according to the Airport Authority of India (AAI).
Future Market Scenario (2024 - 2031F)
Increased focus on runway safety drives the demand for engineered materials arresting systems.
Rising awareness on passenger and aircraft safety will lead to higher adoption of engineered materials arresting systems in airports worldwide.
Technological breakthroughs will lead to enhanced EMAS materials and designs.
Increase in passenger traffic and number of airports in the Asia Pacific region is expected to drive the market in the future.
Key Players Landscape and Outlook
Key participants in the engineered material arresting system market include Runway Safe Group, General Atomics, A-Tech, Inc., QinetiQ North America, Curtis Wright Corporation, and Wire Rope Industries, among others. The environment is characterized by continuous innovation, as the key market players engage extensively in research and development to increase their product lines, hence helping the market grow. Major companies are carrying out a variety of strategic initiatives to broaden their reach, including new product releases, contractual agreements, mergers and acquisitions, and collaboration with other businesses. To grow and thrive in a competitive environment, the engineered materials arresting system developers must provide cost-effective products.
In July 2022, Curtis Wright Corporation completed the acquisition of the Safran Aerosystems Arresting Company for USD 240 million. The acquisition solidified Curtis-Wright's position as a key supplier of aircraft recovery and arresting systems, expanded the company's defense portfolio outside of the United States, and support numerous NATO members in Europe region.
Table of Contents
1. Research Methodology
2. Project Scope & Definitions
3. Executive Summary
4. Voice of Customer
- 4.1. Product and Market Intelligence
- 4.2. Mode of Brand Awareness
- 4.3. Factors Considered in Purchase Decisions
- 4.3.1. Safety Requirements
- 4.3.2. Runway Characteristics
- 4.3.3. Aircraft Types and Volumes
- 4.3.4. Cost
- 4.3.5. Manufacturer Reputation and Reliability
- 4.3.6. Future Expansion Plans
- 4.3.7. Technological Features
- 4.3.8. Customization Needs
- 4.4. Consideration of Environment & Safety Regulations
5. Global Engineered Material Arresting System Market Outlook, 2017-2031F
- 5.1. Market Size & Forecast
- 5.1.1. By Value
- 5.1.2. By Volume
- 5.2. By System
- 5.2.1. Fixed System
- 5.2.2. Portable System
- 5.3. By Platform
- 5.3.1. Ground Based
- 5.3.2. Ship Based
- 5.4. By End-use
- 5.4.1. Commercial Airport
- 5.4.2. Military Airbase
- 5.4.3. Aircraft Carrier
- 5.5. By Region
- 5.5.1. North America
- 5.5.2. Europe
- 5.5.3. Asia-Pacific
- 5.5.4. South America
- 5.5.5. Middle East and Africa
- 5.6. By Company Market Share (%), 2023
6. Global Engineered Material Arresting System Market Outlook, By Region, 2017-2031F
- 6.1. North America*
- 6.1.1. Market Size & Forecast
- 6.1.1.1. By Value
- 6.1.1.2. By Volume
- 6.1.2. By System
- 6.1.2.1. Fixed System
- 6.1.2.2. Portable System
- 6.1.3. By Platform
- 6.1.3.1. Ground Based
- 6.1.3.2. Portable System
- 6.1.4. By End-use
- 6.1.4.1. Commercial Airport
- 6.1.4.2. Military Airbase
- 6.1.4.3. Aircraft Carrier
- 6.1.5. United States*
- 6.1.5.1. Market Size & Forecast
- 6.1.5.1.1. By Value
- 6.1.5.1.2. By Volume
- 6.1.5.2. By System
- 6.1.5.2.1. Fixed System
- 6.1.5.2.2. Portable System
- 6.1.5.3. By Platform
- 6.1.5.3.1. Ground Based
- 6.1.5.3.2. Ship Based
- 6.1.5.4. By End-use
- 6.1.5.4.1. Commercial Airport
- 6.1.5.4.2. Military Airbase
- 6.1.5.4.3. Aircraft Carrier
- 6.1.6. Canada
- 6.1.7. Mexico
- 6.1.1. Market Size & Forecast
All segments will be provided for all regions and countries covered
- 6.2. Europe
- 6.2.1. Germany
- 6.2.2. France
- 6.2.3. Italy
- 6.2.4. United Kingdom
- 6.2.5. Russia
- 6.2.6. Netherlands
- 6.2.7. Spain
- 6.2.8. Turkey
- 6.2.9. Poland
- 6.3. Asia-Pacific
- 6.3.1. India
- 6.3.2. China
- 6.3.3. Japan
- 6.3.4. Australia
- 6.3.5. Vietnam
- 6.3.6. South Korea
- 6.3.7. Indonesia
- 6.3.8. Philippines
- 6.4. South America
- 6.4.1. Brazil
- 6.4.2. Argentina
- 6.5. Middle East & Africa
- 6.5.1. Saudi Arabia
- 6.5.2. UAE
- 6.5.3. South Africa
7. Market Mapping, 2023
- 7.1. By System
- 7.2. By Platform
- 7.3. By End-use
- 7.4. By Region
8. Macro Environment and Industry Structure
- 8.1. Demand Supply Analysis
- 8.2. Import Export Analysis
- 8.3. Value Chain Analysis
- 8.4. PESTEL Analysis
- 8.4.1. Political Factors
- 8.4.2. Economic System
- 8.4.3. Social Implications
- 8.4.4. Technological Advancements
- 8.4.5. Environmental Impacts
- 8.4.6. Legal Compliances and Regulatory Policies (Statutory Bodies Included)
- 8.5. Porter's Five Forces Analysis
- 8.5.1. Supplier Power
- 8.5.2. Buyer Power
- 8.5.3. Substitution Threat
- 8.5.4. Threat from New Entrant
- 8.5.5. Competitive Rivalry
9. Market Dynamics
- 9.1. Growth Drivers
- 9.2. Growth Inhibitors (Challenges and Restraints)
10. Key Players Landscape
- 10.1. Competition Matrix of Top Five Market Leaders
- 10.2. Market Revenue Analysis of Top Five Market Leaders (in %, 2023)
- 10.3. Mergers and Acquisitions/Joint Ventures (If Applicable)
- 10.4. SWOT Analysis (For Five Market Players)
- 10.5. Patent Analysis (If Applicable)
11. Pricing Analysis
12. Case Studies
13. Key Players Outlook
- 13.1. Runway Safe Group
- 13.1.1. Company Details
- 13.1.2. Key Management Personnel
- 13.1.3. Products & Services
- 13.1.4. Financials (As reported)
- 13.1.5. Key Market Focus & Geographical Presence
- 13.1.6. Recent Developments
- 13.2. General Atomics
- 13.3. A-tech, Inc.
- 13.4. QinetiQ Group plc
- 13.5. Curtis-Wright Corporation
- 13.6. Wire Rope Industries
- 13.7. Scandinavian Manufacturing SCAMA AB
- 13.8. Crawford, Murphy & Tilly, Inc.
- 13.9. Aries S.A.
- 13.10. Hangke Technology Development Co., Ltd.
Companies mentioned above DO NOT hold any order as per market share and can be changed as per information available during research work.

