|
|
市場調査レポート
商品コード
1422763
コネクテッドロジスティクスの世界市場:コンポーネント別、輸送モード別、業界別、地域別、機会、予測、2017年~2031年Connected Logistics Market Assessment, By Component, By Transportation Mode, By Vertical, Region, Opportunities, and Forecast 2017-2031 |
||||||

|
|||||||
カスタマイズ可能
|
|||||||

| コネクテッドロジスティクスの世界市場:コンポーネント別、輸送モード別、業界別、地域別、機会、予測、2017年~2031年 |
|
出版日: 2024年02月12日
発行: Markets & Data
ページ情報: 英文 245 Pages
納期: 3~5営業日
|

全表示
- 概要
- 図表
- 目次
世界のコネクテッドロジスティクスの市場規模は、2023年に304億2,000万米ドルとなり、2031年には966億8,000万米ドルに達すると予測されており、2024年から2031年の予測期間のCAGRは15.55%になるとみられています。世界のコネクテッドロジスティクス市場とは、モノのインターネット(IoT)、人工知能(AI)、データ分析などの先進技術を応用し、世界のサプライチェーンとロジスティクス業務を最適化・改善することを指します。主な特徴としては、リアルタイムのデータ収集のためのIoTデバイス、データの保存と処理のためのクラウドコンピューティング、可視性と透明性の強化、自動化技術、予測分析などがあります。その目的は、コネクティビティとデータ主導の洞察を活用することで、より効率的で応答性が高く、費用対効果の高いサプライチェーンを構築することです。さらに、ロジスティクスサービスプロバイダーが、注文処理、金融取引、出荷、倉庫管理、輸送、その他の付加価値ロジスティクスサービスなど、さまざまなプロセスにおける可視性を高めるために採用する、相互接続された機器のネットワークと表現することもできます。市場の成長は、進歩するテクノロジーとオンラインショッピングに対する消費者の嗜好の高まりに後押しされています。高度な相互運用性、セキュリティ、アクセシビリティなどの特性を備えたコネクテッドロジスティクスシステムの利用可能性が高まっていることが、こうしたソリューションの需要を後押ししています。
さらに、輸送コストや保管コストを最小限に抑える必要性が、コネクテッドロジスティクス製品やソリューションの採用を後押ししています。インテリジェントな輸送ソリューションに対する需要の大幅な増加が予想されます。予測期間には、ロジスティクス4.0の採用が増加し、自律型ロジスティクス・トラックを強化する取り組みが進行しているため、有利な機会が示されると予想されます。IoTセンサーとコネクテッドロジスティクスハードウェアのコストが低下していることは、市場成長を促進する主な要因です。しかし、ロジスティクス部門におけるセキュリティと安全性への懸念が、市場の拡大に制約を与えています。
コネクテッドロジスティクス市場を促進する重要な要因の1つは、サプライチェーンプロセスにおける可視性と業務効率の向上に対する需要の高まりです。タイムリーな情報とリアルタイムの追跡が極めて重要な時代において、ロジスティクスサービスプロバイダーは、業務の様々な側面に対する包括的な洞察を得るために、コネクテッドロジスティクスソリューションを採用することが増えています。例えば、センサーやRFIDタグなどのモノのインターネット(IoT)デバイスの統合により、企業はサプライチェーン全体を通じて物品の位置や状態を追跡できるようになります。さらに、コネクテッドロジスティクス・ソリューションの需要は、世界・サプライチェーンの複雑化と、多様な利害関係者間のシームレスな調整の必要性によって、さらに高まっています。
当レポートでは、世界のコネクテッドロジスティクス市場について調査し、市場の概要とともに、コンポーネント別、輸送モード別、業界別、地域別動向、および市場に参入する企業のプロファイルなどを提供しています。
目次
第1章 調査手法
第2章 プロジェクトの範囲と定義
第3章 エグゼクティブサマリー
第4章 お客様の声
第5章 世界のコネクテッドロジスティクス市場の見通し、2017年~2031年
- 市場規模と予測
- コンポーネント別
- 輸送モード別
- 業界別
- 地域別
- 企業別市場シェア(%)、2023年
第6章 世界のコネクテッドロジスティクス市場の見通し、地域別、2017年~2031年
- 北米
- 欧州
- 南米
- アジア太平洋
- 中東・アフリカ
第7章 市場マッピング、2023年
第8章 マクロ環境と産業構造
- 需給分析
- 輸出入分析
- バリューチェーン分析
- PESTEL分析
- ポーターのファイブフォース分析
第9章 市場力学
第10章 主要参入企業の情勢
第11章 ケーススタディ
第12章 主要企業の見通し
- Intel Corporation
- Infosys Limited
- Cisco System Inc.
- HCL Technology Limited
- IBM Corporation
- SAP SE
- ORBOCMM
- Freightgate Inc.,
- Honeywell International Inc.
- NEC Corporation
第13章 戦略的提言
第14章 お問合せと免責事項
List of Tables
- Table 1. Pricing Analysis of Products from Key Players
- Table 2. Competition Matrix of Top 5 Market Leaders
- Table 3. Mergers & Acquisitions/ Joint Ventures (If Applicable)
- Table 4. About Us - Regions and Countries Where We Have Executed Client Projects
List of Figures
- Figure 1. Global Connected Logistics Market, By Value, In USD Billion, 2017-2031F
- Figure 2. Global Connected Logistics Market Share (%), By Component, 2017-2031F
- Figure 3. Global Connected Logistics Market Share (%), By Transportation Mode, 2017-2031F
- Figure 4. Global Connected Logistics Market Share (%), By Vertical, 2017-2031F
- Figure 5. Global Connected Logistics Market Share (%), By Region, 2017-2031F
- Figure 6. North America Connected Logistics Market, By Value, In USD Billion, 2017-2031F
- Figure 7. North America Connected Logistics Market Share (%), By Component, 2017-2031F
- Figure 8. North America Connected Logistics Market Share (%), By Transportation Mode, 2017-2031F
- Figure 9. North America Connected Logistics Market Share (%), By Vertical, 2017-2031F
- Figure 10. North America Connected Logistics Market Share (%), By Country, 2017-2031F
- Figure 11. United States Connected Logistics Market, By Value, In USD Billion, 2017-2031F
- Figure 12. United States Connected Logistics Market Share (%), By Component, 2017-2031F
- Figure 13. United States Connected Logistics Market Share (%), By Transportation Mode, 2017-2031F
- Figure 14. United States Connected Logistics Market Share (%), By Vertical, 2017-2031F
- Figure 15. Canada Connected Logistics Market, By Value, In USD Billion, 2017-2031F
- Figure 16. Canada Connected Logistics Market Share (%), By Component, 2017-2031F
- Figure 17. Canada Connected Logistics Market Share (%), By Transportation Mode, 2017-2031F
- Figure 18. Canada Connected Logistics Market Share (%), By Vertical, 2017-2031F
- Figure 19. Mexico Connected Logistics Market, By Value, In USD Billion, 2017-2031F
- Figure 20. Mexico Connected Logistics Market Share (%), By Component, 2017-2031F
- Figure 21. Mexico Connected Logistics Market Share (%), By Transportation Mode, 2017-2031F
- Figure 22. Mexico Connected Logistics Market Share (%), By Vertical, 2017-2031F
- Figure 23. Europe Connected Logistics Market, By Value, In USD Billion, 2017-2031F
- Figure 24. Europe Connected Logistics Market Share (%), By Component, 2017-2031F
- Figure 25. Europe Connected Logistics Market Share (%), By Transportation Mode, 2017-2031F
- Figure 26. Europe Connected Logistics Market Share (%), By Vertical, 2017-2031F
- Figure 27. Europe Connected Logistics Market Share (%), By Country, 2017-2031F
- Figure 28. Germany Connected Logistics Market, By Value, In USD Billion, 2017-2031F
- Figure 29. Germany Connected Logistics Market Share (%), By Component, 2017-2031F
- Figure 30. Germany Connected Logistics Market Share (%), By Transportation Mode, 2017-2031F
- Figure 31. Germany Connected Logistics Market Share (%), By Vertical, 2017-2031F
- Figure 32. France Connected Logistics Market, By Value, In USD Billion, 2017-2031F
- Figure 33. France Connected Logistics Market Share (%), By Component, 2017-2031F
- Figure 34. France Connected Logistics Market Share (%), By Transportation Mode, 2017-2031F
- Figure 35. France Connected Logistics Market Share (%), By Vertical, 2017-2031F
- Figure 36. Italy Connected Logistics Market, By Value, In USD Billion, 2017-2031F
- Figure 37. Italy Connected Logistics Market Share (%), By Component, 2017-2031F
- Figure 38. Italy Connected Logistics Market Share (%), By Transportation Mode, 2017-2031F
- Figure 39. Italy Connected Logistics Market Share (%), By Vertical, 2017-2031F
- Figure 40. United Kingdom Connected Logistics Market, By Value, In USD Billion, 2017-2031F
- Figure 41. United Kingdom Connected Logistics Market Share (%), By Component, 2017-2031F
- Figure 42. United Kingdom Connected Logistics Market Share (%), By Transportation Mode, 2017-2031F
- Figure 43. United Kingdom Connected Logistics Market Share (%), By Vertical, 2017-2031F
- Figure 44. Russia Connected Logistics Market, By Value, In USD Billion, 2017-2031F
- Figure 45. Russia Connected Logistics Market Share (%), By Component, 2017-2031F
- Figure 46. Russia Connected Logistics Market Share (%), By Transportation Mode, 2017-2031F
- Figure 47. Russia Connected Logistics Market Share (%), By Vertical, 2017-2031F
- Figure 48. Netherlands Connected Logistics Market, By Value, In USD Billion, 2017-2031F
- Figure 49. Netherlands Connected Logistics Market Share (%), By Component, 2017-2031F
- Figure 50. Netherlands Connected Logistics Market Share (%), By Transportation Mode, 2017-2031F
- Figure 51. Netherlands Connected Logistics Market Share (%), By Vertical, 2017-2031F
- Figure 52. Spain Connected Logistics Market, By Value, In USD Billion, 2017-2031F
- Figure 53. Spain Connected Logistics Market Share (%), By Component, 2017-2031F
- Figure 54. Spain Connected Logistics Market Share (%), By Transportation Mode, 2017-2031F
- Figure 55. Spain Connected Logistics Market Share (%), By Vertical, 2017-2031F
- Figure 56. Turkey Connected Logistics Market, By Value, In USD Billion, 2017-2031F
- Figure 57. Turkey Connected Logistics Market Share (%), By Component, 2017-2031F
- Figure 58. Turkey Connected Logistics Market Share (%), By Transportation Mode, 2017-2031F
- Figure 59. Turkey Connected Logistics Market Share (%), By Vertical, 2017-2031F
- Figure 60. Poland Connected Logistics Market, By Value, In USD Billion, 2017-2031F
- Figure 61. Poland Connected Logistics Market Share (%), By Component, 2017-2031F
- Figure 62. Poland Connected Logistics Market Share (%), By Transportation Mode, 2017-2031F
- Figure 63. Poland Connected Logistics Market Share (%), By Vertical, 2017-2031F
- Figure 64. South America Connected Logistics Market, By Value, In USD Billion, 2017-2031F
- Figure 65. South America Connected Logistics Market Share (%), By Component, 2017-2031F
- Figure 66. South America Connected Logistics Market Share (%), By Transportation Mode, 2017-2031F
- Figure 67. South America Connected Logistics Market Share (%), By Vertical, 2017-2031F
- Figure 68. South America Connected Logistics Market Share (%), By Country, 2017-2031F
- Figure 69. Brazil Connected Logistics Market, By Value, In USD Billion, 2017-2031F
- Figure 70. Brazil Connected Logistics Market Share (%), By Component, 2017-2031F
- Figure 71. Brazil Connected Logistics Market Share (%), By Transportation Mode, 2017-2031F
- Figure 72. Brazil Connected Logistics Market Share (%), By Vertical, 2017-2031F
- Figure 73. Argentina Connected Logistics Market, By Value, In USD Billion, 2017-2031F
- Figure 74. Argentina Connected Logistics Market Share (%), By Component, 2017-2031F
- Figure 75. Argentina Connected Logistics Market Share (%), By Transportation Mode, 2017-2031F
- Figure 76. Argentina Connected Logistics Market Share (%), By Vertical, 2017-2031F
- Figure 77. Asia-Pacific Connected Logistics Market, By Value, In USD Billion, 2017-2031F
- Figure 78. Asia-Pacific Connected Logistics Market Share (%), By Component, 2017-2031F
- Figure 79. Asia-Pacific Connected Logistics Market Share (%), By Transportation Mode, 2017-2031F
- Figure 80. Asia-Pacific Connected Logistics Market Share (%), By Vertical, 2017-2031F
- Figure 81. Asia-Pacific Connected Logistics Market Share (%), By Country, 2017-2031F
- Figure 82. India Connected Logistics Market, By Value, In USD Billion, 2017-2031F
- Figure 83. India Connected Logistics Market Share (%), By Component, 2017-2031F
- Figure 84. India Connected Logistics Market Share (%), By Transportation Mode, 2017-2031F
- Figure 85. India Connected Logistics Market Share (%), By Vertical, 2017-2031F
- Figure 86. China Connected Logistics Market, By Value, In USD Billion, 2017-2031F
- Figure 87. China Connected Logistics Market Share (%), By Component, 2017-2031F
- Figure 88. China Connected Logistics Market Share (%), By Transportation Mode, 2017-2031F
- Figure 89. China Connected Logistics Market Share (%), By Vertical, 2017-2031F
- Figure 90. Japan Connected Logistics Market, By Value, In USD Billion, 2017-2031F
- Figure 91. Japan Connected Logistics Market Share (%), By Component, 2017-2031F
- Figure 92. Japan Connected Logistics Market Share (%), By Transportation Mode, 2017-2031F
- Figure 93. Japan Connected Logistics Market Share (%), By Vertical, 2017-2031F
- Figure 94. Australia Connected Logistics Market, By Value, In USD Billion, 2017-2031F
- Figure 95. Australia Connected Logistics Market Share (%), By Component, 2017-2031F
- Figure 96. Australia Connected Logistics Market Share (%), By Transportation Mode, 2017-2031F
- Figure 97. Australia Connected Logistics Market Share (%), By Vertical, 2017-2031F
- Figure 98. Vietnam Connected Logistics Market, By Value, In USD Billion, 2017-2031F
- Figure 99. Vietnam Connected Logistics Market Share (%), By Component, 2017-2031F
- Figure 100. Vietnam Connected Logistics Market Share (%), By Transportation Mode, 2017-2031F
- Figure 101. Vietnam Connected Logistics Market Share (%), By Vertical, 2017-2031F
- Figure 102. South Korea Connected Logistics Market, By Value, In USD Billion, 2017-2031F
- Figure 103. South Korea Connected Logistics Market Share (%), By Component, 2017-2031F
- Figure 104. South Korea Connected Logistics Market Share (%), By Transportation Mode, 2017-2031F
- Figure 105. South Korea Connected Logistics Market Share (%), By Vertical, 2017-2031F
- Figure 106. Indonesia Connected Logistics Market, By Value, In USD Billion, 2017-2031F
- Figure 107. Indonesia Connected Logistics Market Share (%), By Component, 2017-2031F
- Figure 108. Indonesia Connected Logistics Market Share (%), By Transportation Mode, 2017-2031F
- Figure 109. Indonesia Connected Logistics Market Share (%), By Vertical, 2017-2031F
- Figure 110. Philippines Connected Logistics Market, By Value, In USD Billion, 2017-2031F
- Figure 111. Philippines Connected Logistics Market Share (%), By Component, 2017-2031F
- Figure 112. Philippines Connected Logistics Market Share (%), By Transportation Mode, 2017-2031F
- Figure 113. Philippines Connected Logistics Market Share (%), By Vertical, 2017-2031F
- Figure 114. Middle East & Africa Connected Logistics Market, By Value, In USD Billion, 2017-2031F
- Figure 115. Middle East & Africa Connected Logistics Market Share (%), By Component, 2017-2031F
- Figure 116. Middle East & Africa Connected Logistics Market Share (%), By Transportation Mode, 2017-2031F
- Figure 117. Middle East & Africa Connected Logistics Market Share (%), By Vertical, 2017-2031F
- Figure 118. Middle East & Africa Connected Logistics Market Share (%), By Country, 2017-2031F
- Figure 119. Saudi Arabia Connected Logistics Market, By Value, In USD Billion, 2017-2031F
- Figure 120. Saudi Arabia Connected Logistics Market Share (%), By Component, 2017-2031F
- Figure 121. Saudi Arabia Connected Logistics Market Share (%), By Transportation Mode, 2017-2031F
- Figure 122. Saudi Arabia Connected Logistics Market Share (%), By Vertical, 2017-2031F
- Figure 123. UAE Connected Logistics Market, By Value, In USD Billion, 2017-2031F
- Figure 124. UAE Connected Logistics Market Share (%), By Component, 2017-2031F
- Figure 125. UAE Connected Logistics Market Share (%), By Transportation Mode, 2017-2031F
- Figure 126. UAE Connected Logistics Market Share (%), By Vertical, 2017-2031F
- Figure 127. South Africa Connected Logistics Market, By Value, In USD Billion, 2017-2031F
- Figure 128. South Africa Connected Logistics Market Share (%), By Component, 2017-2031F
- Figure 129. South Africa Connected Logistics Market Share (%), By Transportation Mode, 2017-2031F
- Figure 130. South Africa Connected Logistics Market Share (%), By Vertical, 2017-2031F
- Figure 131. By Component Map-Market Size (USD Billion) & Growth Rate (%), 2023
- Figure 132. By Transportation Mode Map-Market Size (USD Billion) & Growth Rate (%), 2023
- Figure 133. By Vertical Map-Market Size (USD Billion) & Growth Rate (%), 2023
- Figure 134. By Region Map-Market Size (USD Billion) & Growth Rate (%), 2023
Global Connected Logistics market size was valued at USD 30.42 billion in 2023, expected to reach USD 96.68 billion in 2031, with a CAGR of 15.55% for the forecast period between 2024 and 2031. The global connected logistics market refers to the application of advanced technologies such as the Internet of Things (IoT), artificial intelligence (AI), and data analytics to optimize and improve global supply chain and logistics operations. Key features include IoT devices for real-time data collection, cloud computing for data storage and processing, enhanced visibility and transparency, automation technologies, and predictive analytics. The goal is to create a more efficient, responsive, and cost-effective supply chain by leveraging connectivity and data-driven insights. Moreover, it can be described as a network of interconnected devices employed by logistics service providers to enhance visibility in various processes, including order processing, financial transactions, shipping, warehousing, transportation, and other value-added logistics services. The market's growth is propelled by advancing technology and a growing consumer preference for online shopping. The increasing availability of connected logistics systems with attributes like high interoperability, security, and accessibility drives the demand for such solutions.
Furthermore, the need to minimize shipping and storage costs is boosting the adoption of connected logistics products and solutions. There is an anticipated significant rise in the demand for intelligent transportation solutions. The forecast period is expected to witness lucrative opportunities with increased adoption of logistics 4.0 and ongoing efforts to enhance autonomous logistics trucks. The decreasing cost of IoT sensors and connected logistics hardware is a key factor driving market growth. However, security and safety concerns within the logistics sector pose limitations to the market's expansion.
Increased Inclination Towards Achieving Operational Efficiency in Supply Chain
One significant driver propelling the connected logistics market is the escalating demand for enhanced visibility and operational efficiency within supply chain processes. In an era where timely information and real-time tracking are crucial, logistics service providers increasingly adopt connected logistics solutions to gain comprehensive insights into various facets of their operations. For instance, the integration of Internet of Things (IoT) devices, such as sensors and RFID tags, allows companies to track the location and condition of goods throughout the entire supply chain. Moreover, the demand for connected logistics solutions is further fuelled by the growing complexities of global supply chains and the need for seamless coordination among diverse stakeholders.
Advanced technologies, including artificial intelligence (AI) and data analytics, enable predictive insights, helping companies optimize routes, reduce lead times, and proactively address potential issues. As the market continues to evolve, businesses are recognizing the importance of high interoperability, security, and accessibility in connected logistics systems, driving the demand for solutions that offer comprehensive and integrated visibility. This driver is not only about cost reduction but also about achieving a competitive edge through streamlined and efficient supply chain management. As a result, connected logistics solutions are becoming integral to modernizing and future-proofing logistics operations across industries.
For instance, in October 2023, Overhaul, a software solution addressing supply chain visibility, risk, compliance, and insurance for major global brands, has introduced Shipment Connect-an application designed to provide unparalleled visibility into logistics operations processes for customers. The challenges of tracking cargo from start to finish have grown due to data gaps, outdated shipment management processes, and inaccurate shipment information. Shipment Connect enables customers to instantly generate and monitor digital shipments, link Internet of Things (IoT) devices to cargo and eliminate paperwork without the need for expensive integrations.
Hardware Component Dominating the Market
Categorized by components, the market is divided into hardware, solutions, and services. In 2022, the hardware segment took the lead, and is projected to experience a rapid CAGR during the forecast period. The market is subdivided into RFID tags, sensors, communication devices, tracking devices, and other elements within the hardware category. The sensors category is expected to garner a substantial market share due to the growing demand for asset tracking. Furthermore, the application of Internet of Things (IoT)-based connected sensing technology plays a crucial role in maintaining temperature stability, reducing food waste, and enhancing visibility in the supply chain.
For instance, in July 2022, SAP APJ and NTT DATA jointly unveiled a marine transportation solution, "Connected Product," utilizing IoT sensors for real-time monitoring and tracking of global shipments, coupled with matching insurance coverage. The offering, developed as part of their 2020 strategic alliance, enhances supply chain visibility, allowing immediate reactions to damage or delays. The solution addresses logistics and supply chain disruptions, particularly marine transportation challenges. By monitoring the location and conditions of goods in transit, it targets fragile items like solar panels, bulk liquids such as wine, and sensitive cold chain shipments including pharmaceuticals and vaccines. Connected Product facilitates easier insurance management by linking SAP business network for logistics with NTT DATA's smart insurance policy management assets, providing real-time information and digitizing documentation for stakeholders.
North America Paving the Way for Market Growth
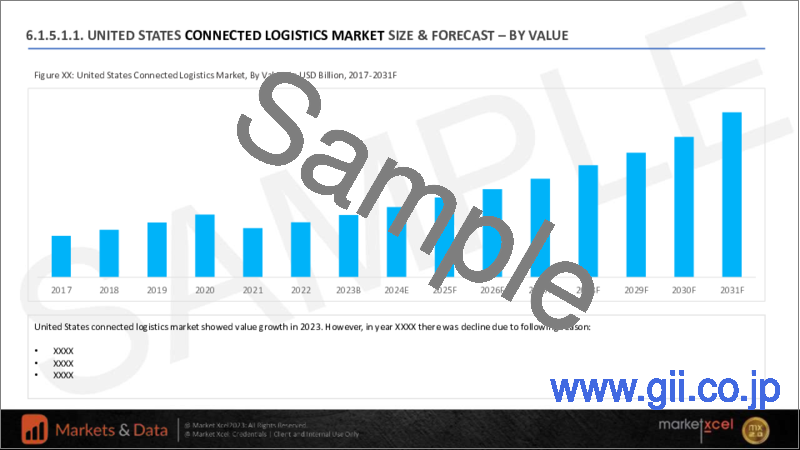
In 2023, North America emerged as the primary driver of the overall market. The region's growth is credited to its well-established infrastructure, particularly in terms of advanced rail and road connectivity. Additionally, the presence of key industry players positions the region as the foremost contributor to global market revenue throughout the anticipated period. The advanced infrastructure facilitates the swift adoption of modern technologies. The United States is projected to maintain its dominant position in the forecast period, driven by ongoing technological advancements, a surge in working capital, and the rapid expansion of the e-commerce sector.
Key Players Landscape and Outlook
Investments in research and development by key market players are substantial, aiming to integrate advanced technologies into connected logistics for safer and more cost-effective transportation. Companies also foster collaborations and partnerships with both competitors and end-users to gain a competitive advantage.
A notable example is the agreement between Oracle and RHI Magnesita in February 2022, wherein RHI Magnesita chose Oracle's fusion cloud transportation management, streamlining its entire transport management system to reduce costs and optimize service levels.
Another instance is SAP SE's expansion of its partner ecosystem in September 2020, forming extended partnerships with Project44, ClearMetal, and Shippeo. Through these collaborations, members of SAP Logistics Business Network gain access to real-time information, including estimated time of arrival, exact shipment location, and status changes for road and ocean carrier transports.
Table of Contents
1. Research Methodology
2. Project Scope & Definitions
3. Executive Summary
4. Voice of Customer
- 4.1. Factors Considered in Purchase Decision
- 4.1.1. Technology Integration
- 4.1.2. Visibility and Tracking
- 4.1.3. Data Security and Privacy
- 4.1.4. Scalability
- 4.1.5. Cost Efficiency
- 4.1.6. Collaboration Capabilities
5. Global Connected Logistics Market Outlook, 2017-2031F
- 5.1. Market Size & Forecast
- 5.1.1. By Value
- 5.2. By Component
- 5.2.1. Hardware
- 5.2.1.1. RFID Tags
- 5.2.1.2. Sensors
- 5.2.1.3. Communication Devices
- 5.2.1.4. Tracking Devices
- 5.2.1.5. Others
- 5.2.2. Software
- 5.2.2.1. Warehouse Management
- 5.2.2.2. Fleet Management
- 5.2.2.3. Freight transportation management
- 5.2.2.4. Asset Tracking and management
- 5.2.2.5. Data Management and Analytics
- 5.2.2.6. Others
- 5.2.3. Services
- 5.2.3.1. Consulting
- 5.2.3.2. Integration and Deployment
- 5.2.3.3. Support & Maintenance
- 5.2.3.4. Managed Services
- 5.2.1. Hardware
- 5.3. By Transportation Mode
- 5.3.1. Roadways
- 5.3.2. Railways
- 5.3.3. Airways
- 5.3.4. Waterways
- 5.4. By Vertical
- 5.4.1. Retail & E-commerce
- 5.4.2. Automotive
- 5.4.3. Aerospace & Defense
- 5.4.4. Healthcare
- 5.4.5. Energy
- 5.4.6. Electronics & Semiconductors
- 5.4.7. Others
- 5.5. By Region
- 5.5.1. North America
- 5.5.2. Europe
- 5.5.3. South America
- 5.5.4. Asia-Pacific
- 5.5.5. Middle East and Africa
- 5.6. By Company Market Share (%), 2023
6. Global Connected Logistics Market Outlook, By Region, 2017-2031F
- 6.1. North America*
- 6.1.1. Market Size & Forecast
- 6.1.1.1. By Value
- 6.1.2. By Component
- 6.1.2.1. Hardware
- 6.1.2.1.1. RFID Tags
- 6.1.2.1.2. Sensors
- 6.1.2.1.3. Communication Devices
- 6.1.2.1.4. Tracking Devices
- 6.1.2.1.5. Others
- 6.1.2.2. Software
- 6.1.2.2.1. Warehouse Management
- 6.1.2.2.2. Fleet Management
- 6.1.2.2.3. Freight transportation management
- 6.1.2.2.4. Asset Tracking and management
- 6.1.2.2.5. Data Management and Analytics
- 6.1.2.2.6. Others
- 6.1.2.3. Services
- 6.1.2.3.1. Consulting
- 6.1.2.3.2. Integration and Deployment
- 6.1.2.3.3. Support & Maintenance
- 6.1.2.3.4. Managed Services
- 6.1.3. By Transportation Mode
- 6.1.3.1. Roadways
- 6.1.3.2. Railways
- 6.1.3.3. Airways
- 6.1.3.4. Waterways
- 6.1.4. By Vertical
- 6.1.4.1. Retail & E-commerce
- 6.1.4.2. Automotive
- 6.1.4.3. Aerospace & Defense
- 6.1.4.4. Healthcare
- 6.1.4.5. Energy
- 6.1.4.6. Electronics & Semiconductors
- 6.1.4.7. Others
- 6.1.5. United States*
- 6.1.5.1. Market Size & Forecast
- 6.1.5.1.1. By Value
- 6.1.5.2. By Component
- 6.1.5.2.1. Hardware
- 6.1.5.2.1.1. RFID Tags
- 6.1.5.2.1.2. Sensors
- 6.1.5.2.1.3. Communication Devices
- 6.1.5.2.1.4. Tracking Devices
- 6.1.5.2.1.5. Others
- 6.1.5.2.2. Software
- 6.1.5.2.2.1. Warehouse Management
- 6.1.5.2.2.2. Fleet Management
- 6.1.5.2.2.3. Freight transportation management
- 6.1.5.2.2.4. Asset Tracking and management
- 6.1.5.2.2.5. Data Management and Analytics
- 6.1.5.2.2.6. Others
- 6.1.5.2.3. Services
- 6.1.5.2.3.1. Consulting
- 6.1.5.2.3.2. Integration and Deployment
- 6.1.5.2.3.3. Support & Maintenance
- 6.1.5.2.3.4. Managed Services
- 6.1.5.3. By Transportation Mode
- 6.1.5.3.1. Roadways
- 6.1.5.3.2. Railways
- 6.1.5.3.3. Airways
- 6.1.5.3.4. Waterways
- 6.1.5.4. By Vertical
- 6.1.5.4.1. Retail & E-commerce
- 6.1.5.4.2. Automotive
- 6.1.5.4.3. Aerospace & Defense
- 6.1.5.4.4. Healthcare
- 6.1.5.4.5. Energy
- 6.1.5.4.6. Electronics & Semiconductors
- 6.1.5.4.7. Others
- 6.1.6. Canada
- 6.1.7. Mexico
- 6.1.1. Market Size & Forecast
All segments will be provided for all regions and countries covered
- 6.2. Europe
- 6.2.1. Germany
- 6.2.2. France
- 6.2.3. Italy
- 6.2.4. United Kingdom
- 6.2.5. Russia
- 6.2.6. Netherlands
- 6.2.7. Spain
- 6.2.8. Turkey
- 6.2.9. Poland
- 6.3. South America
- 6.3.1. Brazil
- 6.3.2. Argentina
- 6.4. Asia Pacific
- 6.4.1. India
- 6.4.2. China
- 6.4.3. Japan
- 6.4.4. Australia
- 6.4.5. Vietnam
- 6.4.6. South Korea
- 6.4.7. Indonesia
- 6.4.8. Philippines
- 6.5. Middle East & Africa
- 6.5.1. Saudi Arabia
- 6.5.2. UAE
- 6.5.3. South Africa
7. Market Mapping, 2023
- 7.1. By Component
- 7.2. By Transportation Mode
- 7.3. By Vertical
- 7.4. By Region
8. Macro Environment and Industry Structure
- 8.1. Supply Demand Analysis
- 8.2. Import Export Analysis
- 8.3. Value Chain Analysis
- 8.4. PESTEL Analysis
- 8.4.1. Political Factors
- 8.4.2. Economic System
- 8.4.3. Social Implications
- 8.4.4. Technological Advancements
- 8.4.5. Environmental Impacts
- 8.4.6. Legal Compliances and Regulatory Policies (Statutory Bodies Included)
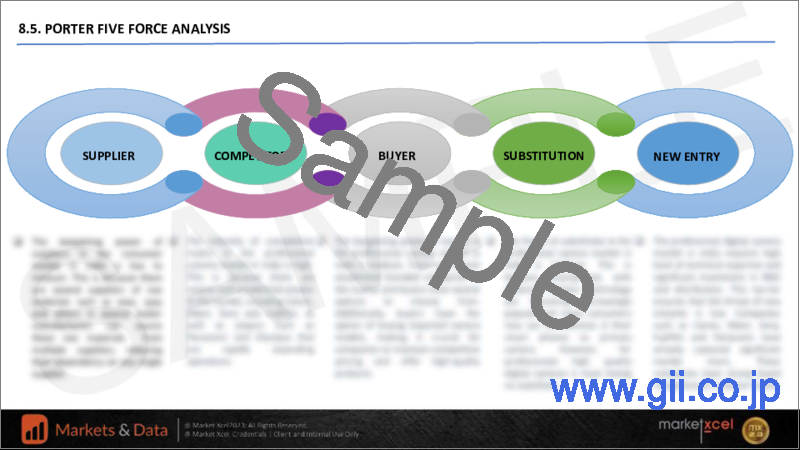
- 8.5. Porter's Five Forces Analysis
- 8.5.1. Supplier Power
- 8.5.2. Buyer Power
- 8.5.3. Substitution Threat
- 8.5.4. Threat from New Entrant
- 8.5.5. Competitive Rivalry
9. Market Dynamics
- 9.1. Growth Drivers
- 9.2. Growth Inhibitors (Challenges and Restraints)
10. Key Players Landscape
- 10.1. Competition Matrix of Top Five Market Leaders
- 10.2. Market Revenue Analysis of Top Five Market Leaders (in %, 2023)
- 10.3. Mergers and Acquisitions/Joint Ventures (If Applicable)
- 10.4. SWOT Analysis (For Five Market Players)
- 10.5. Patent Analysis (If Applicable)
11. Case Studies
12. Key Players Outlook
- 12.1. Intel Corporation
- 12.1.1. Company Details
- 12.1.2. Key Management Personnel
- 12.1.3. Products & Services
- 12.1.4. Key Market Focus & Geographical Presence
- 12.1.5. Financials (As Reported)
- 12.1.6. Recent Developments
- 12.2. Infosys Limited
- 12.3. Cisco System Inc.
- 12.4. HCL Technology Limited
- 12.5. IBM Corporation
- 12.6. SAP SE
- 12.7. ORBOCMM
- 12.8. Freightgate Inc.,
- 12.9. Honeywell International Inc.
- 12.10. NEC Corporation
Companies mentioned above DO NOT hold any order as per market share and can be changed as per information available during research work

