|
|
市場調査レポート
商品コード
1400697
静電容量式センサーの世界市場の評価:タイプ別、用途別、地域別、機会、予測(2017年~2031年)Capacitive Sensor Market Assessment, By Type, By Application, By Region, Opportunities and Forecast, 2017-2031F |
||||||

|
|||||||
カスタマイズ可能
|
|||||||

| 静電容量式センサーの世界市場の評価:タイプ別、用途別、地域別、機会、予測(2017年~2031年) |
|
出版日: 2024年01月03日
発行: Markets & Data
ページ情報: 英文 223 Pages
納期: 3~5営業日
|

全表示
- 概要
- 図表
- 目次
世界の静電容量式センサーの市場規模は、2023年に351億5,000万米ドル、2031年までに564億5,000万米ドルに達し、2024年~2031年の予測期間にCAGRで6.1%の成長が見込まれています。
市場の成長促進要因は、コンシューマーエレクトロニクスの需要、自動車用途、産業オートメーション、医療機器、IoTの普及、小型化の進行、センサー技術の革新などです。
IoTの普及は、静電容量式センサーの需要を大幅に押し上げています。IoTデバイスは、タッチセンサーコントロール、近接センサー、ユーザーインターフェースなどの機能に、静電容量式を含むさまざまなセンサーを必要とします。より多くのIoTデバイスがスマートホーム、工業環境、医療に導入されるにつれて、静電容量式センサーの需要は増加し続け、それによってIoTデバイスの採用率が高まり、市場の成長に寄与しています。
例えば、2023年5月、世界のコネクテッドIoTデバイスは16%増加し、アクティブエンドポイントは167億に達すると予測されています。2023年の成長率は2022年に比べて若干減少すると予測されていますが、この動向は、IoTデバイスの接続が今後数年間にわたって着実に拡大することを示しています。
UAVの活用が市場成長を促進
無人航空機の展開が静電容量式センサー市場の成長を促進しています。静電容量式センサーは、タッチスクリーンや近接検出などを可能にすることで、UAV技術において重要な役割を果たしています。さらに、監視、農業、配送サービスなどのさまざまな部門におけるUAV利用の拡大が、静電容量式センサーの需要を促進しています。
先進のタッチセンサーの登場が市場成長を加速
先進のタッチセンサーの登場が市場を大きく加速させています。これらのセンサーは、タッチスクリーン、ヒューマンマシンインターフェースほかのさまざまな用途において、優れた感度と精度をもたらします。コンシューマーエレクトロニクス、自動車、産業オートメーション、IoTデバイスがこれらの先進のタッチセンサーをますます採用するようになるにつれて、市場はより応答性が高くインタラクティブなタッチ式インターフェースの需要に後押しされ、大幅な成長を示します。
航空宇宙・防衛部門が市場機会に応える
航空宇宙・防衛部門は、世界の静電容量式センサー市場における大きな市場機会を活用しています。これらのセンサーは、近接検出、燃料レベルモニタリング、構造ヘルス評価、環境モニタリングなどのさまざまな用途に利用されています。さらに、静電容量式センサーの急速な採用により、安全性、効率性、技術力が強化され、航空宇宙・防衛事業における先進のセンシングソリューションに対する需要の高まりに対応しています。
アジア太平洋が市場をリード
アジア太平洋は、複数の要因により静電容量式センサー市場を独占しています。同地域では、大幅な産業成長、コンシューマーエレクトロニクス需要の増加、オートメーション技術の広範な採用が見られました。さらに、この地域の自動車産業の拡大とIoTデバイスの普及が、さまざまな用途における静電容量式センサーへのニーズを後押ししました。これらの要因から、アジア太平洋は予測期間におけるマーケットリーダーとして位置づけられます。
静電容量式センサー市場に対する政府の取り組み
静電容量式センサー市場の成長には、政府の取り組みが不可欠です。タッチや近接を検出するこれらのセンサーは、スマートフォンから自動車、医療に至るまでの数多くの産業において重要です。さらに、政府の支援は研究開発を促進し、より革新的でコスト効率の高いソリューションにつながります。さらに、規制基準やインセンティブは静電容量式センサーの採用を促進し、公共安全と環境への配慮を強化することができます。さらに、メーカーに対する税制や補助金などのインセンティブは国内生産と競合を後押しし、規制ガイドラインは製品の品質と消費者保護を保証します。
当レポートでは、世界の静電容量式センサー市場について調査分析し、市場規模と予測、市場力学、主要企業の情勢と見通しなどを提供しています。
目次
第1章 調査手法
第2章 プロジェクトの範囲と定義
第3章 世界の静電容量式センサー市場に対するCOVID-19の影響
第4章 エグゼクティブサマリー
第5章 顧客の声
- 製品と市場のインテリジェンス
- 情報源
- 購入決定において考慮される要素
- 設置の目的
- 需給のメカニズム
- 安全規制の検討と理解
- 法令遵守の適用
- 既存のユーザーまたは購入予定者
第6章 世界の静電容量式センサー市場の見通し(2017年~2031年)
- 市場規模と予測
- 金額
- 数量
- タイプ別
- モーションセンサー
- タッチセンサー
- 位置センサー
- その他
- 用途別
- 航空宇宙・防衛
- コンシューマーエレクトロニクス
- 石油・ガス
- 医療
- 自動車
- 食品・飲料
- その他
- 地域別
- 北米
- アジア太平洋
- 欧州
- 南米
- 中東・アフリカ
- 市場シェア:企業別(2023年)
第7章 世界の静電容量式センサー市場の見通し:地域別(2017年~2031年)
- 北米
- 市場規模と予測
- タイプ別
- 用途別
- 米国
- カナダ
- メキシコ
- 欧州
- ドイツ
- フランス
- イタリア
- 英国
- ロシア
- オランダ
- スペイン
- トルコ
- ポーランド
- 南米
- ブラジル
- アルゼンチン
- アジア太平洋
- インド
- 中国
- 日本
- オーストラリア
- ベトナム
- 韓国
- インドネシア
- フィリピン
- 中東・アフリカ
- サウジアラビア
- アラブ首長国連邦
- 南アフリカ
第8章 市場マッピング(2023年)
- タイプ別
- 用途別
- 地域別
第9章 マクロ環境と産業構造
- 需給分析
- 輸出入の分析
- バリューチェーン分析
- PESTEL分析
- ポーターのファイブフォース分析
第10章 市場力学
- 成長促進要因
- 成長抑制要因(課題、抑制要因)
第11章 主要企業情勢
- マーケットリーダー上位5社の競合マトリクス
- マーケットリーダー上位5社の市場収益分析(2023年)
- 合併と買収/合弁事業(該当する場合)
- SWOT分析(市場参入企業5社向け)
- 特許分析(該当する場合)
第12章 価格分析
第13章 ケーススタディ
第14章 主要企業の見通し
- Analog Devices, Inc.
- Infineon Technologies AG
- Cypress Semiconductor Corporation
- Microchip Technology, Inc.
- Micro-Epsilon
- NXP Semiconductors N.V.
- Omron Corporation
- Renesas Electronics Corporation
- Schneider Electric
- Texas Instruments Incorporated
第15章 戦略的推奨事項
第16章 当社について、免責事項
List of Tables
- Table 1. Pricing Analysis of Products from Key Players
- Table 2. Competition Matrix of Top 5 Market Leaders
- Table 3. Mergers & Acquisitions/ Joint Ventures (If Applicable)
- Table 4. About Us - Regions and Countries Where We Have Executed Client Projects
List of Figures
- Figure 1. Global Capacitive Sensor Market, By Value, In USD Billion, 2017-2031F
- Figure 2. Global Capacitive Sensor Market, By Volume, in Thousand Units, 2017-2031F
- Figure 3. Global Capacitive Sensor Market Share (%), By Type, 2017-2031F
- Figure 4. Global Capacitive Sensor Market Share (%), By Application, 2017-2031F
- Figure 5. Global Capacitive Sensor Market Share (%), By Region, 2017-2031F
- Figure 6. North America Capacitive Sensor Market, By Value, In USD Billion, 2017-2031F
- Figure 7. North America Capacitive Sensor Market, By Volume, in Thousand Units, 2017-2031F
- Figure 8. North America Capacitive Sensor Market Share (%), By Type, 2017-2031F
- Figure 9. North America Capacitive Sensor Market Share (%), By Application, 2017-2031F
- Figure 10. North America Capacitive Sensor Market Share (%), By Country, 2017-2031F
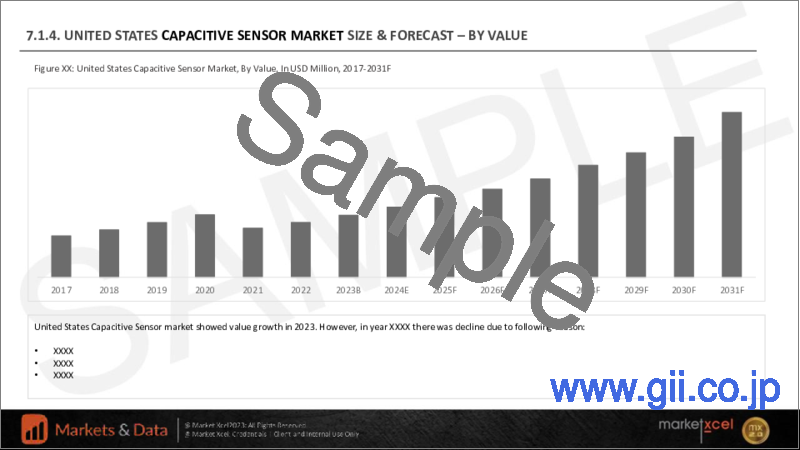
- Figure 11. United States Capacitive Sensor Market, By Value, In USD Billion, 2017-2031F
- Figure 12. United States Capacitive Sensor Market, By Volume, in Thousand Units, 2017-2031F
- Figure 13. United States Capacitive Sensor Market Share (%), By Type, 2017-2031F
- Figure 14. United States Capacitive Sensor Market Share (%), By Application, 2017-2031F
- Figure 15. Canada Capacitive Sensor Market, By Value, In USD Billion, 2017-2031F
- Figure 16. Canada Capacitive Sensor Market, By Volume, in Thousand Units, 2017-2031F
- Figure 17. Canada Capacitive Sensor Market Share (%), By Type, 2017-2031F
- Figure 18. Canada Capacitive Sensor Market Share (%), By Application, 2017-2031F
- Figure 19. Mexico Capacitive Sensor Market, By Value, In USD Billion, 2017-2031F
- Figure 20. Mexico Capacitive Sensor Market, By Volume, in Thousand Units, 2017-2031F
- Figure 21. Mexico Capacitive Sensor Market Share (%), By Type, 2017-2031F
- Figure 22. Mexico Capacitive Sensor Market Share (%), By Application, 2017-2031F
- Figure 23. Europe Capacitive Sensor Market, By Value, In USD Billion, 2017-2031F
- Figure 24. Europe Capacitive Sensor Market, By Volume, in Thousand Units, 2017-2031F
- Figure 25. Europe Capacitive Sensor Market Share (%), By Type, 2017-2031F
- Figure 26. Europe Capacitive Sensor Market Share (%), By Application, 2017-2031F
- Figure 27. Europe Capacitive Sensor Market Share (%), By Country, 2017-2031F
- Figure 28. Germany Capacitive Sensor Market, By Value, In USD Billion, 2017-2031F
- Figure 29. Germany Capacitive Sensor Market, By Volume, in Thousand Units, 2017-2031F
- Figure 30. Germany Capacitive Sensor Market Share (%), By Type, 2017-2031F
- Figure 31. Germany Capacitive Sensor Market Share (%), By Application, 2017-2031F
- Figure 32. France Capacitive Sensor Market, By Value, In USD Billion, 2017-2031F
- Figure 33. France Capacitive Sensor Market, By Volume, in Thousand Units, 2017-2031F
- Figure 34. France Capacitive Sensor Market Share (%), By Type, 2017-2031F
- Figure 35. France Capacitive Sensor Market Share (%), By Application, 2017-2031F
- Figure 36. Italy Capacitive Sensor Market, By Value, In USD Billion, 2017-2031F
- Figure 37. Italy Capacitive Sensor Market, By Volume, in Thousand Units, 2017-2031F
- Figure 38. Italy Capacitive Sensor Market Share (%), By Type, 2017-2031F
- Figure 39. Italy Capacitive Sensor Market Share (%), By Application, 2017-2031F
- Figure 40. United Kingdom Capacitive Sensor Market, By Value, In USD Billion, 2017-2031F
- Figure 41. United Kingdom Capacitive Sensor Market, By Volume, in Thousand Units, 2017-2031F
- Figure 42. United Kingdom Capacitive Sensor Market Share (%), By Type, 2017-2031F
- Figure 43. United Kingdom Capacitive Sensor Market Share (%), By Application, 2017-2031F
- Figure 44. Russia Capacitive Sensor Market, By Value, In USD Billion, 2017-2031F
- Figure 45. Russia Capacitive Sensor Market, By Volume, in Thousand Units, 2017-2031F
- Figure 46. Russia Capacitive Sensor Market Share (%), By Type, 2017-2031F
- Figure 47. Russia Capacitive Sensor Market Share (%), By Application, 2017-2031F
- Figure 48. Netherlands Capacitive Sensor Market, By Value, In USD Billion, 2017-2031F
- Figure 49. Netherlands Capacitive Sensor Market, By Volume, in Thousand Units, 2017-2031F
- Figure 50. Netherlands Capacitive Sensor Market Share (%), By Type, 2017-2031F
- Figure 51. Netherlands Capacitive Sensor Market Share (%), By Application, 2017-2031F
- Figure 52. Spain Capacitive Sensor Market, By Value, In USD Billion, 2017-2031F
- Figure 53. Spain Capacitive Sensor Market, By Volume, in Thousand Units, 2017-2031F
- Figure 54. Spain Capacitive Sensor Market Share (%), By Type, 2017-2031F
- Figure 55. Spain Capacitive Sensor Market Share (%), By Application, 2017-2031F
- Figure 56. Turkey Capacitive Sensor Market, By Value, In USD Billion, 2017-2031F
- Figure 57. Turkey Capacitive Sensor Market, By Volume, in Thousand Units, 2017-2031F
- Figure 58. Turkey Capacitive Sensor Market Share (%), By Type, 2017-2031F
- Figure 59. Turkey Capacitive Sensor Market Share (%), By Application, 2017-2031F
- Figure 60. Poland Capacitive Sensor Market, By Value, In USD Billion, 2017-2031F
- Figure 61. Poland Capacitive Sensor Market, By Volume, in Thousand Units, 2017-2031F
- Figure 62. Poland Capacitive Sensor Market Share (%), By Type, 2017-2031F
- Figure 63. Poland Capacitive Sensor Market Share (%), By Application, 2017-2031F
- Figure 64. South America Capacitive Sensor Market, By Value, In USD Billion, 2017-2031F
- Figure 65. South America Capacitive Sensor Market, By Volume, in Thousand Units, 2017-2031F
- Figure 66. South America Capacitive Sensor Market Share (%), By Type, 2017-2031F
- Figure 67. South America Capacitive Sensor Market Share (%), By Application, 2017-2031F
- Figure 68. South America Capacitive Sensor Market Share (%), By Country, 2017-2031F
- Figure 69. Brazil Capacitive Sensor Market, By Value, In USD Billion, 2017-2031F
- Figure 70. Brazil Capacitive Sensor Market, By Volume, in Thousand Units, 2017-2031F
- Figure 71. Brazil Capacitive Sensor Market Share (%), By Type, 2017-2031F
- Figure 72. Brazil Capacitive Sensor Market Share (%), By Application, 2017-2031F
- Figure 73. Argentina Capacitive Sensor Market, By Value, In USD Billion, 2017-2031F
- Figure 74. Argentina Capacitive Sensor Market, By Volume, in Thousand Units, 2017-2031F
- Figure 75. Argentina Capacitive Sensor Market Share (%), By Type, 2017-2031F
- Figure 76. Argentina Capacitive Sensor Market Share (%), By Application, 2017-2031F
- Figure 77. Asia-Pacific Capacitive Sensor Market, By Value, In USD Billion, 2017-2031F
- Figure 78. Asia-Pacific Capacitive Sensor Market, By Volume, in Thousand Units, 2017-2031F
- Figure 79. Asia-Pacific Capacitive Sensor Market Share (%), By Type, 2017-2031F
- Figure 80. Asia-Pacific Capacitive Sensor Market Share (%), By Application, 2017-2031F
- Figure 81. Asia-Pacific Capacitive Sensor Market Share (%), By Country, 2017-2031F
- Figure 82. India Capacitive Sensor Market, By Value, In USD Billion, 2017-2031F
- Figure 83. India Capacitive Sensor Market, By Volume, in Thousand Units, 2017-2031F
- Figure 84. India Capacitive Sensor Market Share (%), By Type, 2017-2031F
- Figure 85. India Capacitive Sensor Market Share (%), By Application, 2017-2031F
- Figure 86. China Capacitive Sensor Market, By Value, In USD Billion, 2017-2031F
- Figure 87. China Capacitive Sensor Market, By Volume, in Thousand Units, 2017-2031F
- Figure 88. China Capacitive Sensor Market Share (%), By Type, 2017-2031F
- Figure 89. China Capacitive Sensor Market Share (%), By Application, 2017-2031F
- Figure 90. Japan Capacitive Sensor Market, By Value, In USD Billion, 2017-2031F
- Figure 91. Japan Capacitive Sensor Market, By Volume, in Thousand Units, 2017-2031F
- Figure 92. Japan Capacitive Sensor Market Share (%), By Type, 2017-2031F
- Figure 93. Japan Capacitive Sensor Market Share (%), By Application, 2017-2031F
- Figure 94. Australia Capacitive Sensor Market, By Value, In USD Billion, 2017-2031F
- Figure 95. Australia Capacitive Sensor Market, By Volume, in Thousand Units, 2017-2031F
- Figure 96. Australia Capacitive Sensor Market Share (%), By Type, 2017-2031F
- Figure 97. Australia Capacitive Sensor Market Share (%), By Application, 2017-2031F
- Figure 98. Vietnam Capacitive Sensor Market, By Value, In USD Billion, 2017-2031F
- Figure 99. Vietnam Capacitive Sensor Market, By Volume, in Thousand Units, 2017-2031F
- Figure 100. Vietnam Capacitive Sensor Market Share (%), By Type, 2017-2031F
- Figure 101. Vietnam Capacitive Sensor Market Share (%), By Application, 2017-2031F
- Figure 102. South Korea Capacitive Sensor Market, By Value, In USD Billion, 2017-2031F
- Figure 103. South Korea Capacitive Sensor Market, By Volume, in Thousand Units, 2017-2031F
- Figure 104. South Korea Capacitive Sensor Market Share (%), By Type, 2017-2031F
- Figure 105. South Korea Capacitive Sensor Market Share (%), By Application, 2017-2031F
- Figure 106. Indonesia Capacitive Sensor Market, By Value, In USD Billion, 2017-2031F
- Figure 107. Indonesia Capacitive Sensor Market, By Volume, in Thousand Units, 2017-2031F
- Figure 108. Indonesia Capacitive Sensor Market Share (%), By Type, 2017-2031F
- Figure 109. Indonesia Capacitive Sensor Market Share (%), By Application, 2017-2031F
- Figure 110. Philippines Capacitive Sensor Market, By Value, In USD Billion, 2017-2031F
- Figure 111. Philippines Capacitive Sensor Market, By Volume, in Thousand Units, 2017-2031F
- Figure 112. Philippines Capacitive Sensor Market Share (%), By Type, 2017-2031F
- Figure 113. Philippines Capacitive Sensor Market Share (%), By Application, 2017-2031F
- Figure 114. Middle East & Africa Capacitive Sensor Market, By Value, In USD Billion, 2017-2031F
- Figure 115. Middle East & Africa Capacitive Sensor Market, By Volume, in Thousand Units, 2017-2031F
- Figure 116. Middle East & Africa Capacitive Sensor Market Share (%), By Type, 2017-2031F
- Figure 117. Middle East & Africa Capacitive Sensor Market Share (%), By Application, 2017-2031F
- Figure 118. Middle East & Africa Capacitive Sensor Market Share (%), By Country, 2017-2031F
- Figure 119. Saudi Arabia Capacitive Sensor Market, By Value, In USD Billion, 2017-2031F
- Figure 120. Saudi Arabia Capacitive Sensor Market, By Volume, in Thousand Units, 2017-2031F
- Figure 121. Saudi Arabia Capacitive Sensor Market Share (%), By Type, 2017-2031F
- Figure 122. Saudi Arabia Capacitive Sensor Market Share (%), By Application, 2017-2031F
- Figure 123. UAE Capacitive Sensor Market, By Value, In USD Billion, 2017-2031F
- Figure 124. UAE Capacitive Sensor Market, By Volume, in Thousand Units, 2017-2031F
- Figure 125. UAE Capacitive Sensor Market Share (%), By Type, 2017-2031F
- Figure 126. UAE Capacitive Sensor Market Share (%), By Application, 2017-2031F
- Figure 127. South Africa Capacitive Sensor Market, By Value, In USD Billion, 2017-2031F
- Figure 128. South Africa Capacitive Sensor Market, By Volume, in Thousand Units, 2017-2031F
- Figure 129. South Africa Capacitive Sensor Market Share (%), By Type, 2017-2031F
- Figure 130. South Africa Capacitive Sensor Market Share (%), By Application, 2017-2031F
- Figure 131. By Type Map-Market Size (USD Billion) & Growth Rate (%), 2023
- Figure 132. By Application Map-Market Size (USD Billion) & Growth Rate (%), 2023
- Figure 133. By Region Map-Market Size (USD Billion) & Growth Rate (%), 2023
Global capacitive sensor market size was valued at USD 35.15 billion in 2023 which is expected to reach USD 56.45 billion in 2031 with a CAGR of 6.1% for the forecasted period between 2024 and 2031.
Capacitive sensors offer high sensitivity, non-contact operation, accuracy, and resilience to environmental factors, thereby making them versatile for applications such as aerospace and defense, consumer electronics, oil and gas, and healthcare. Factors driving the capacitive sensor market's growth include consumer electronics demand, automotive applications, industrial automation, medical devices, IoT proliferation, ongoing miniaturization, and innovation in sensor technology.
The proliferation of Internet of Things has significantly boosted the demand for capacitive sensors. IoT devices require various sensors, including capacitive type, for functions like touch-sensitive controls, proximity sensing, and user interfaces. As more IoT devices are deployed in smart homes, industrial settings, and healthcare, the demand for capacitive sensors continues to rise, thereby increasing the adoption rate of IoT devices which in turn is contributing to the market's growth.
For example, in May 2023, the worldwide count of connected IoT devices is projected to increase by 16% to reach 16.7 billion active endpoints. Although the growth in 2023 is anticipated to be slightly less compared to 2022, the trend suggests that IoT device connections will expand steadily over the years to come.
Utilization of UAVs is Fostering the Market Growth
The deployment of unmanned aerial vehicles is driving growth of capacitive sensors market. Capacitive sensors play a crucial role in UAV technology by enabling touchscreens, proximity detection, etc. Moreover, the expanding applications of UAVs in various sectors, including surveillance, agriculture, and delivery services, are fueling the demand for capacitive sensors.
For example, in October 2023, Optiemus Infracom has revealed its entry into the Unmanned Systems field by introducing a range of drones crafted and produced in India. This initiative involves a mammoth investment of USD 3.01 million (INR 250 million) investment in Optiemus Unmanned Systems (OUS). The products unveiled by Optiemus Infracom incorporate state-of-the-art features, encompassing advanced sensors, secure communication systems, and stringent safety measures.
Emergence of Highly Advanced Touch Sensors is Amplifying the Market Growth
The emergence of highly advanced touch sensors is significantly boosting the market. These sensors offer increased sensitivity and precision in touchscreens, human-machine interfaces, and various applications. As consumer electronics, automotive, industrial automation, and IoT devices increasingly adopt these advanced touch sensors, the capacitive sensor market experiences substantial growth, driven by the demand for more responsive and interactive touch-based interfaces.
For example, SigmaSense has revealed its intentions to showcase advanced touch sensing capabilities at SID Display Week 2023. The cutting-edge multi-dimensional sensing technology offered by SigmaSense paves the way for unprecedented user experiences, encompassing 3D, multi-surface, and multi-user sensing in various domains such as industrial and rugged devices, mobile devices, foldables, and digital signage applications.
Aerospace and Defense Sector is Catering to Market Opportunities
The aerospace and defense sector is capitalizing on significant market opportunities in the global capacitive sensors market. These sensors are being utilized for various applications, including proximity detection, fuel level monitoring, structural health assessment, and environmental monitoring. Moreover, the sector's rapid adoption of capacitive sensors enhances safety, efficiency, and technological capabilities, addressing the growing demand for advanced sensing solutions in aerospace and defense operations.
United States is undoubtedly leading the aerospace and defense sector due to the presence of highly developed capacitive sensors. For example, in June 2023, the US Department of Defense stated that the military's modernization efforts are on track due to the arrival of interoperable sensors (ISA) that can work together seamlessly. In addition, it announced that ISA's goal is to enhance the Army's capacity to function effectively in adverse conditions by adapting to various tactical scenarios and strengthen its abilities to safeguard the nation.
Asia-Pacific to Lead the Market
Asia-Pacific dominated the capacitive sensor market due to several factors. It experienced substantial industrial growth, increased consumer electronics demand, and extensive adoption of automation technologies. Moreover, the region's expanding automotive industry, coupled with the proliferation of IoT devices, drove the need for capacitive sensors in various applications. Hence, these factors collectively position Asia-Pacific region as the market leader during the prevised timeframe.
For example, in July 2022, Panasonic introduced a Capacitive Knob designed for seamless integration with standard touch sensors. This innovative knob offers an enhanced user interface experience, allowing precise control and navigation on touch-sensitive surfaces. The new product complements touch sensor technology, providing an adequate input method for consumer electronics and industrial control systems, thereby improvising user interactivity and functionality.
Government Initiatives on the Capacitive Sensor Market
Government initiatives are essential for the capacitive sensor market's growth. These sensors, which detect touch and proximity, are vital in numerous industries, from smartphones to automotive and healthcare. Moreover, government support can drive research and development, leading to more innovative and cost-effective solutions. Furthermore, regulatory standards and incentives can promote the adoption of capacitive sensors, enhancing public safety and environmental considerations. Moreover, incentives such as tax or subsidies for manufacturers can boost domestic production and competitiveness, while regulatory guidelines ensure product quality and consumer protection.
For instance, in November 2022, Somalytics Inc., a technology innovator based in Seattle, was acknowledged by the Consumer Technology Association in 2023 CES Innovation Awards. They received this recognition in the Embedded Technology category for their remarkable SomaCap capacitive sensor. Somalytics is at the forefront of enhancing human interactions with the Internet of Things, by introducing these highly advanced capacitive sensors that greatly improve how we naturally interact with and manage the digital realm.
Impact of COVID-19
The capacitive sensor market experienced different phases before and after the COVID-19 pandemic. Pre-COVID-19, the market was on a growth trajectory, driven by increasing demand in consumer electronics, automotive, and healthcare sectors. However, the pandemic disrupted supply chains, causing temporary production slowdowns and a reduction in demand. Moreover, many businesses adapted to remote work, leading to project delays. In post-COVID-19 landscape, the capacitive sensor market rebounded by capitalizing on the need for touchless technology with applications like touchscreens, biometrics, gesture recognition, etc. Furthermore, the market has displayed resilience and adaptability by highlighting the importance of innovation and flexibility in responding to changing consumer preferences and technological trends.
Key Players Landscape and Outlook
The global capacitive sensor market is undergoing rapid advancement, marked by leading companies boosting their investments in UAVs and touchscreen sensors. Furthermore, these enterprises are allocating substantial resources to boost their market footprint and profitability. They are actively engaging in collaborations, acquisitions, and partnerships that are reshaping the industry's structure and accelerating overall market growth.
For instance, in February 2023, Renesas introduced the RL78/G22 MCU, which features a capacitive sensor that can perform detection without direct contact, making it less susceptible to dust and other environmental factors. These recent product launches demonstrate the ongoing innovation and development in the field of capacitive sensor technology.
In November 2022, Infineon Technologies AG introduced the PSoC 4100S Max range, which includes an expanded flash memory and a set of general-purpose inputs/outputs (GPIO). The enhanced design is geared towards supporting next-generation human machine interface (HMI) applications that utilize fifth generation CAPSENSE touch sensors. The PSoC 4100S Max with CAPSENSE technology, available in various packaging options, is well-suited for a range of applications, including industrial control, automotive HMI, and home automation.
In July 2022, Littelfuse, Inc. completed the acquisition of C&K Switches, which is likely to include capacitive sensor capabilities. These acquisitions demonstrate a trend of companies expanding their technical capabilities and product portfolios in the field of capacitive sensors.
Table of Contents
1. Research Methodology
2. Project Scope & Definitions
3. Impact of COVID-19 on Global Capacitive Sensor Market
4. Executive Summary
5. Voice of Customer
- 5.1. Product and Market Intelligence
- 5.2. Sources of Information
- 5.3. Factors Considered in Purchase Decisions
- 5.3.1. Overall Expenses
- 5.3.2. Facility Requirement
- 5.3.3. Number of Installation Units
- 5.3.4. Efficiency
- 5.3.5. After-Sales Support
- 5.4. Purpose of Installation
- 5.5. Demand and Supply Mechanism
- 5.6. Consideration and Understanding of Safety Regulations
- 5.7. Application of Legal Compliances
- 5.8. Existing User or Intended Purchaser
6. Global Capacitive Sensor Market Outlook, 2017-2031F
- 6.1. Market Size & Forecast
- 6.1.1. By Value
- 6.1.2. By Volume
- 6.2. By Type
- 6.2.1. Motion Sensors
- 6.2.2. Touch Sensors
- 6.2.3. Position Sensors
- 6.2.4. Others
- 6.3. By Application
- 6.3.1. Aerospace and Defense
- 6.3.1.1. Aircraft Fuel Level Measurement
- 6.3.1.2. Unmanned Aerial Vehicles (UAVs)
- 6.3.1.3. Others
- 6.3.2. Consumer Electronics
- 6.3.2.1. Proximity Sensing
- 6.3.2.2. Touchscreens
- 6.3.2.3. Others
- 6.3.3. Oil and Gas
- 6.3.3.1. Leak Detection
- 6.3.3.2. Corrosion Monitoring
- 6.3.3.3. Others
- 6.3.4. Healthcare
- 6.3.4.1. Medical Imaging
- 6.3.4.2. Oxygen Concentrators
- 6.3.4.3. Smart Beds
- 6.3.4.4. Others
- 6.3.5. Automotive
- 6.3.5.1. EV
- 6.3.5.2. Non-EV
- 6.3.6. Food and Beverages
- 6.3.7. Others
- 6.3.1. Aerospace and Defense
- 6.4. By Region
- 6.4.1. North America
- 6.4.2. Asia-Pacific
- 6.4.3. Europe
- 6.4.4. South America
- 6.4.5. Middle East and Africa
- 6.5. By Company Market Share (%), 2023
7. Global Capacitive Sensor Market Outlook, By Region, 2017-2031F
- 7.1. North America*
- 7.1.1. Market Size & Forecast
- 7.1.1.1. By Value
- 7.1.1.2. By Volume
- 7.1.2. By Type
- 7.1.2.1. Motion Sensors
- 7.1.2.2. Touch Sensors
- 7.1.2.3. Position Sensors
- 7.1.2.4. Others
- 7.1.3. By Application
- 7.1.3.1. Aerospace and Defense
- 7.1.3.1.1. Aircraft Fuel Level Measurement
- 7.1.3.1.2. Unmanned Aerial Vehicles (UAVs)
- 7.1.3.1.3. Others
- 7.1.3.2. Consumer Electronics
- 7.1.3.2.1. Proximity Sensing
- 7.1.3.2.2. Touchscreens
- 7.1.3.2.3. Others
- 7.1.3.3. Oil and Gas
- 7.1.3.3.1. Leak Detection
- 7.1.3.3.2. Corrosion Monitoring
- 7.1.3.3.3. Others
- 7.1.3.4. Healthcare
- 7.1.3.4.1. Medical Imaging
- 7.1.3.4.2. Oxygen Concentrators
- 7.1.3.4.3. Smart Beds
- 7.1.3.4.4. Others
- 7.1.3.5. Automotive
- 7.1.3.5.1. EV
- 7.1.3.5.2. Non-EV
- 7.1.3.6. Food and Beverages
- 7.1.3.7. Others
- 7.1.4. United States*
- 7.1.4.1. Market Size & Forecast
- 7.1.4.1.1. By Value
- 7.1.4.1.2. By Volume
- 7.1.4.2. By Type
- 7.1.4.2.1. Motion Sensors
- 7.1.4.2.2. Touch Sensors
- 7.1.4.2.3. Position Sensors
- 7.1.4.2.4. Others
- 7.1.4.3. By Application
- 7.1.4.3.1. Aerospace and Defense
- 7.1.4.3.1.1. Aircraft Fuel Level Measurement
- 7.1.4.3.1.2. Unmanned Aerial Vehicles (UAVs)
- 7.1.4.3.1.3. Others
- 7.1.4.3.2. Consumer Electronics
- 7.1.4.3.2.1. Proximity Sensing
- 7.1.4.3.2.2. Touchscreens
- 7.1.4.3.2.3. Others
- 7.1.4.3.3. Oil and Gas
- 7.1.4.3.3.1. Leak Detection
- 7.1.4.3.3.2. Corrosion Monitoring
- 7.1.4.3.3.3. Others
- 7.1.4.3.4. Healthcare
- 7.1.4.3.4.1. Medical Imaging
- 7.1.4.3.4.2. Oxygen Concentrators
- 7.1.4.3.4.3. Smart Beds
- 7.1.4.3.4.4. Others
- 7.1.4.3.5. Automotive
- 7.1.4.3.5.1. EV
- 7.1.4.3.5.2. Non-EV
- 7.1.4.3.6. Food and Beverages
- 7.1.4.3.7. Others
- 7.1.5. Canada
- 7.1.6. Mexico
- 7.1.1. Market Size & Forecast
All segments will be provided for all regions and countries covered
- 7.2. Europe
- 7.2.1. Germany
- 7.2.2. France
- 7.2.3. Italy
- 7.2.4. United Kingdom
- 7.2.5. Russia
- 7.2.6. Netherlands
- 7.2.7. Spain
- 7.2.8. Turkey
- 7.2.9. Poland
- 7.3. South America
- 7.3.1. Brazil
- 7.3.2. Argentina
- 7.4. Asia-Pacific
- 7.4.1. India
- 7.4.2. China
- 7.4.3. Japan
- 7.4.4. Australia
- 7.4.5. Vietnam
- 7.4.6. South Korea
- 7.4.7. Indonesia
- 7.4.8. Philippines
- 7.5. Middle East & Africa
- 7.5.1. Saudi Arabia
- 7.5.2. UAE
- 7.5.3. South Africa
8. Market Mapping, 2023
- 8.1. By Type
- 8.2. By Application
- 8.3. By Region
9. Macro Environment and Industry Structure
- 9.1. Supply Demand Analysis
- 9.2. Import Export Analysis
- 9.3. Value Chain Analysis
- 9.4. PESTEL Analysis
- 9.4.1. Political Factors
- 9.4.2. Economic System
- 9.4.3. Social Implications
- 9.4.4. Technological Advancements
- 9.4.5. Environmental Impacts
- 9.4.6. Legal Compliances and Regulatory Policies (Statutory Bodies Included)
- 9.5. Porter's Five Forces Analysis
- 9.5.1. Supplier Power
- 9.5.2. Buyer Power
- 9.5.3. Substitution Threat
- 9.5.4. Threat from New Entrant
- 9.5.5. Competitive Rivalry
10. Market Dynamics
- 10.1. Growth Drivers
- 10.2. Growth Inhibitors (Challenges and Restraints)
11. Key Players Landscape
- 11.1. Competition Matrix of Top Five Market Leaders
- 11.2. Market Revenue Analysis of Top Five Market Leaders (in %, 2023)
- 11.3. Mergers and Acquisitions/Joint Ventures (If Applicable)
- 11.4. SWOT Analysis (For Five Market Players)
- 11.5. Patent Analysis (If Applicable)
12. Pricing Analysis
13. Case Studies
14. Key Players Outlook
- 14.1. Analog Devices, Inc.
- 14.1.1. Company Details
- 14.1.2. Key Management Personnel
- 14.1.3. Products & Services
- 14.1.4. Financials (As reported)
- 14.1.5. Key Market Focus & Geographical Presence
- 14.1.6. Recent Developments
- 14.2. Infineon Technologies AG
- 14.3. Cypress Semiconductor Corporation
- 14.4. Microchip Technology, Inc.
- 14.5. Micro-Epsilon
- 14.6. NXP Semiconductors N.V.
- 14.7. Omron Corporation
- 14.8. Renesas Electronics Corporation
- 14.9. Schneider Electric
- 14.10. Texas Instruments Incorporated
Companies mentioned above DO NOT hold any order as per market share and can be changed as per information available during research work.
