|
|
市場調査レポート
商品コード
1394222
表面実装技術(SMT)の世界市場の評価:装置タイプ別、用途別、地域別、機会、予測(2016年~2030年)Surface Mount Technology Market Assessment, By Equipment Type, By Application, By Region, Opportunities and Forecast, 2016-2030F |
||||||

|
|||||||
カスタマイズ可能
|
|||||||

| 表面実装技術(SMT)の世界市場の評価:装置タイプ別、用途別、地域別、機会、予測(2016年~2030年) |
|
出版日: 2023年12月08日
発行: Markets & Data
ページ情報: 英文 206 Pages
納期: 3~5営業日
|

全表示
- 概要
- 図表
- 目次
世界の表面実装技術(SMT)市場は近年著しい成長を示しており、今後も力強い拡大ペースを維持すると予測されます。収益は2022年に約60億7,000万米ドル、2030年までに106億7,000万米ドルに達し、2023年~2030年にCAGRで7.3%の健全な成長が予測されています。
市場は、よりコンパクトな電子製品を求める消費者の需要により拡大しています。しかし、IoTや5G技術が進歩していることから、高周波PCB設計はより効率的でなければなりません。さらに、自動化とロボティクスの向上により、SMT製造が合理化され、コストが下がり、品質が向上しています。これらの要素が表面実装技術(SMT)市場の成長を加速させています。
表面実装技術(SMT)の開発は、IoT市場の発展と密接な関係があります。コネクテッドデバイス、センサー、スマートテクノロジーに対するIoTのニーズの高まりは、SMTの小型化と効率化を必要としています。SMTは、IoTデバイスの動力源となる部品の接続と実装に不可欠であり、その数は2023年までに150億を超え、2024年までに1兆米ドル相当の市場を生み出すと予測されています。SMTは、IoTアプリケーションがスマートホーム、医療、農業などの産業に広がり続ける発展途上の市場を支える、効率的な製造と電子装置の組み立てに不可欠です。
例えば、2023年8月、JUKIは、電気部品を迅速に配置する多様な実装オプションを備えた、精巧なフレキシブルマウンター、LX-8をリリースしました。匠プラネットヘッドとP20Sプラネットヘッドを搭載し、生産ニーズに応じてスピードと柔軟性を選択できます。
小型化の役割が市場に寄与
より小型で携帯性に優れた電子装置に対する顧客の需要が高まる中、小型化が表面実装技術(SMT)市場に大きく寄与しています。SMTは、プリント回路基板(PCB)上の部品の小型化と高密度実装を可能にすることで、メーカーが小型、軽量、高機能の電子製品を製造することを可能にします。表面実装技術(SMT)市場の精巧な小型ガジェットへの志向はそれに沿っており、拡大を促進しています。SMTは、このような小さな部品の実装やはんだ付けに有効であるため、現代の電子装置に好まれる組立方法であり、SMTが技術のブレークスルーと製品革新の最前線にとどまることを保証しています。
例えば、2023年9月、研究開発から生産への効果的な移行に向け、Zhejiang Taiyun Groupの一部門であるZhejiang Taiyun Automotive Technologyは、MycronicのMYProアセンブリソリューションを使用しました。週に平均4~5個の新製品を生産する同社は、迅速なNPIとプロトタイプ生産に集中しています。
コンシューマーエレクトロニクスの革新が表面実装技術(SMT)市場を後押し
コンシューマーエレクトロニクスは、洗練されたユーザーフレンドリーな設計を実現するために、よりコンパクトで堅牢な部品を要求し、常に技術の限界を押し広げています。このようなニーズを満たすために、表面実装技術(SMT)は必要不可欠です。高性能なスマートフォン、タブレット、ウェアラブル端末、ゲーム機などの誕生は、SMTがプリント基板に超小型部品を高密度に実装することで可能になっています。SMTにより、プロセッサー、センサー、通信モジュールの配置が容易になり、これらの製品の手頃な価格と消費者への魅力が保たれます。SMTは、コンシューマーエレクトロニクスの進歩に伴う技術革新の促進に重要な役割を果たし、重要な製造技術としての発展を後押ししています。
例えば、2023年7月、シリコンバレーにある設計/製造企業NVZN Labsは、柔軟性と内製性を高めるため、Mycronicの機械を導入しました。迅速な製品づくりを求める顧客の要望に応えるため、手順の短縮に力を入れています。
表面実装技術(SMT)市場における配置装置の優位性
表面実装技術(SMT)市場では、プリント基板上の電子デバイスの精密な組立に重要な役割を果たす配置装置が引き続き優位を占めています。これらの装置に組み込まれた先進のロボット技術と視覚技術により、小型部品の迅速かつ正確な位置決めが可能になります。スマートフォンやIoTガジェットなど、小型で複雑な電子装置のニーズが高まっていることから、位置決め装置の有効性と精度は極めて重要です。SMTの全体的な機能に大きな影響を与え、小型化、高スループット、高品質アセンブリーに対する市場の需要に応えることで、SMTの覇権に拍車をかけています。
例えば、2023年2月、Mycronicが発表したMYTower series Xモデルは、迅速な復旧や自動在庫モニタリングなどの基本機能を維持しながら、独創的な設計により最大2,468個のリールに対応し、保管容量を3倍に増やしました。
当レポートでは、世界の表面実装技術(SMT)市場について調査分析し、市場規模と予測、市場力学、主要企業の情勢と見通しなどを提供しています。
目次
第1章 調査手法
第2章 プロジェクトの範囲と定義
第3章 世界の表面実装技術(SMT)市場に対するCOVID-19の影響
第4章 エグゼクティブサマリー
第5章 顧客の声
- 製品と市場のインテリジェンス
- ブランド認知の方式
- 購入決定において考慮される要素
- プライバシーと安全規制への配慮
第6章 世界の表面実装技術(SMT)市場の見通し(2016年~2030年)
- 市場規模と予測
- 金額
- 数量
- 装置タイプ別
- 検査装置
- 配置装置
- はんだ付け装置
- スクリーン印刷装置
- 洗浄装置
- 再加工、修理装置
- 用途別
- コンシューマーエレクトロニクス
- 通信
- 航空宇宙、防衛
- 自動車
- 医療
- 工業
- エネルギー、電力システム
- 地域別
- 北米
- 欧州
- アジア太平洋
- 南米
- 中東・アフリカ
- 市場シェア:企業別(2022年)
第7章 世界の表面実装技術(SMT)市場の見通し:地域別(2016年~2030年)
- 北米
- 市場規模と予測
- 装置タイプ別
- 用途別
- 米国
- カナダ
- メキシコ
- 欧州
- ドイツ
- フランス
- イタリア
- 英国
- ロシア
- オランダ
- スペイン
- トルコ
- ポーランド
- アジア太平洋
- インド
- 中国
- 日本
- オーストラリア
- ベトナム
- 韓国
- インドネシア
- フィリピン
- 南米
- ブラジル
- アルゼンチン
- 中東・アフリカ
- サウジアラビア
- アラブ首長国連邦
- 南アフリカ
第8章 市場マッピング(2022年)
- 装置タイプ別
- 用途別
- 地域別
第9章 マクロ環境と産業構造
- 需給分析
- 輸出入の分析
- バリューチェーン分析
- PESTEL分析
- ポーターのファイブフォース分析
第10章 市場力学
- 成長促進要因
- 成長抑制要因(課題、抑制要因)
第11章 主要企業情勢
- マーケットリーダー上位5社の競合マトリクス
- マーケットリーダー上位5社の市場収益分析(2022年)
- 合併と買収/合弁事業(該当する場合)
- SWOT分析(市場参入企業5社)
- 特許分析(該当する場合)
第12章 ケーススタディ
第13章 主要企業の見通し
- FUJI CORPORATION
- Hitachi, Ltd.
- JUKI CORPORATION
- KLA Corporation
- Mycronic AB
- Nordson Corporation
- Panasonic Corporation
- Universal Instruments Corporation (Delta Electronics, Inc.)
- Viscom AG
- Yamaha Motor Co., Ltd.
第14章 戦略的推奨事項
第15章 当社について、免責事項
List of Tables
- Table 1. Pricing Analysis of Products from Key Players
- Table 2. Competition Matrix of Top 5 Market Leaders
- Table 3. Mergers & Acquisitions/ Joint Ventures (If Applicable)
- Table 4. About Us - Regions and Countries Where We Have Executed Client Projects
List of Figures
- Figure 1. Global Surface Mount Technology Market, By Value, in USD Billion, 2016-2030F
- Figure 2. Global Surface Mount Technology Market, By Volume, in Thousand Units, 2016-2030F
- Figure 3. Global Surface Mount Technology Market Share, By Equipment Type, in USD Billion, 2016-2030F
- Figure 4. Global Surface Mount Technology Market Share, By Application, in USD Billion, 2016-2030F
- Figure 5. Global Surface Mount Technology Market Share, By Region, in USD Billion, 2016-2030F
- Figure 6. North America Surface Mount Technology Market, By Value, in USD Billion, 2016-2030F
- Figure 7. North America Surface Mount Technology Market, By Volume, in Thousand Units, 2016-2030F
- Figure 8. North America Surface Mount Technology Market Share, By Equipment Type, in USD Billion, 2016-2030F
- Figure 9. North America Surface Mount Technology Market Share, By Application, in USD Billion, 2016-2030F
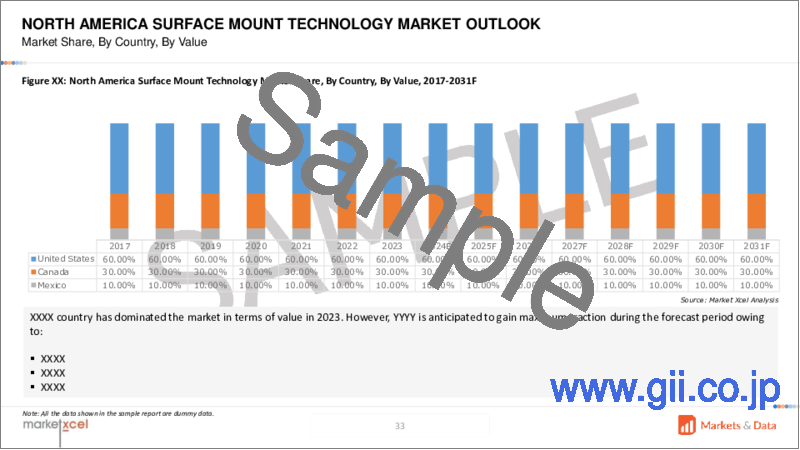
- Figure 10. North America Surface Mount Technology Market Share, By Country, in USD Billion, 2016-2030F
- Figure 11. United States Surface Mount Technology Market, By Value, in USD Billion, 2016-2030F
- Figure 12. United States Surface Mount Technology Market, By Volume, in Thousand Units, 2016-2030F
- Figure 13. United States Surface Mount Technology Market Share, By Equipment Type, in USD Billion, 2016-2030F
- Figure 14. United States Surface Mount Technology Market Share, By Application, in USD Billion, 2016-2030F
- Figure 15. Canada Surface Mount Technology Market, By Value, in USD Billion, 2016-2030F
- Figure 16. Canada Surface Mount Technology Market, By Volume, in Thousand Units, 2016-2030F
- Figure 17. Canada Surface Mount Technology Market Share, By Equipment Type, in USD Billion, 2016-2030F
- Figure 18. Canada Surface Mount Technology Market Share, By Application, in USD Billion, 2016-2030F
- Figure 19. Mexico Surface Mount Technology Market, By Value, in USD Billion, 2016-2030F
- Figure 20. Mexico Surface Mount Technology Market, By Volume, in Thousand Units, 2016-2030F
- Figure 21. Mexico Surface Mount Technology Market Share, By Equipment Type, in USD Billion, 2016-2030F
- Figure 22. Mexico Surface Mount Technology Market Share, By Application, in USD Billion, 2016-2030F
- Figure 23. Europe Surface Mount Technology Market, By Value, in USD Billion, 2016-2030F
- Figure 24. Europe Surface Mount Technology Market, By Volume, in Thousand Units, 2016-2030F
- Figure 25. Europe Surface Mount Technology Market Share, By Equipment Type, in USD Billion, 2016-2030F
- Figure 26. Europe Surface Mount Technology Market Share, By Application, in USD Billion, 2016-2030F
- Figure 27. Europe Surface Mount Technology Market Share, By Country, in USD Billion, 2016-2030F
- Figure 28. Germany Surface Mount Technology Market, By Value, in USD Billion, 2016-2030F
- Figure 29. Germany Surface Mount Technology Market, By Volume, in Thousand Units, 2016-2030F
- Figure 30. Germany Surface Mount Technology Market Share, By Equipment Type, in USD Billion, 2016-2030F
- Figure 31. Germany Surface Mount Technology Market Share, By Application, in USD Billion, 2016-2030F
- Figure 32. France Surface Mount Technology Market, By Value, in USD Billion, 2016-2030F
- Figure 33. France Surface Mount Technology Market, By Volume, in Thousand Units, 2016-2030F
- Figure 34. France Surface Mount Technology Market Share, By Equipment Type, in USD Billion, 2016-2030F
- Figure 35. France Surface Mount Technology Market Share, By Application, in USD Billion, 2016-2030F
- Figure 36. Italy Surface Mount Technology Market, By Value, in USD Billion, 2016-2030F
- Figure 37. Italy Surface Mount Technology Market, By Volume, in Thousand Units, 2016-2030F
- Figure 38. Italy Surface Mount Technology Market Share, By Equipment Type, in USD Billion, 2016-2030F
- Figure 39. Italy Surface Mount Technology Market Share, By Application, in USD Billion, 2016-2030F
- Figure 40. United Kingdom Surface Mount Technology Market, By Value, in USD Billion, 2016-2030F
- Figure 41. United Kingdom Surface Mount Technology Market, By Volume, in Thousand Units, 2016-2030F
- Figure 42. United Kingdom Surface Mount Technology Market Share, By Equipment Type, in USD Billion, 2016-2030F
- Figure 43. United Kingdom Surface Mount Technology Market Share, By Application, in USD Billion, 2016-2030F
- Figure 44. Russia Surface Mount Technology Market, By Value, in USD Billion, 2016-2030F
- Figure 45. Russia Surface Mount Technology Market, By Volume, in Thousand Units, 2016-2030F
- Figure 46. Russia Surface Mount Technology Market Share, By Equipment Type, in USD Billion, 2016-2030F
- Figure 47. Russia Surface Mount Technology Market Share, By Application, in USD Billion, 2016-2030F
- Figure 48. Netherlands Surface Mount Technology Market, By Value, in USD Billion, 2016-2030F
- Figure 49. Netherlands Surface Mount Technology Market, By Volume, in Thousand Units, 2016-2030F
- Figure 50. Netherlands Surface Mount Technology Market Share, By Equipment Type, in USD Billion, 2016-2030F
- Figure 51. Netherlands Surface Mount Technology Market Share, By Application, in USD Billion, 2016-2030F
- Figure 52. Spain Surface Mount Technology Market, By Value, in USD Billion, 2016-2030F
- Figure 53. Spain Surface Mount Technology Market, By Volume, in Thousand Units, 2016-2030F
- Figure 54. Spain Surface Mount Technology Market Share, By Equipment Type, in USD Billion, 2016-2030F
- Figure 55. Spain Surface Mount Technology Market Share, By Application, in USD Billion, 2016-2030F
- Figure 56. Turkey Surface Mount Technology Market, By Value, in USD Billion, 2016-2030F
- Figure 57. Turkey Surface Mount Technology Market, By Volume, in Thousand Units, 2016-2030F
- Figure 58. Turkey Surface Mount Technology Market Share, By Equipment Type, in USD Billion, 2016-2030F
- Figure 59. Turkey Surface Mount Technology Market Share, By Application, in USD Billion, 2016-2030F
- Figure 60. Poland Surface Mount Technology Market, By Value, in USD Billion, 2016-2030F
- Figure 61. Poland Surface Mount Technology Market, By Volume, in Thousand Units, 2016-2030F
- Figure 62. Poland Surface Mount Technology Market Share, By Equipment Type, in USD Billion, 2016-2030F
- Figure 63. Poland Surface Mount Technology Market Share, By Application, in USD Billion, 2016-2030F
- Figure 64. South America Surface Mount Technology Market, By Value, in USD Billion, 2016-2030F
- Figure 65. South America Surface Mount Technology Market, By Volume, in Thousand Units, 2016-2030F
- Figure 66. South America Surface Mount Technology Market Share, By Equipment Type, in USD Billion, 2016-2030F
- Figure 67. South America Surface Mount Technology Market Share, By Application, in USD Billion, 2016-2030F
- Figure 68. South America Surface Mount Technology Market Share, By Country, in USD Billion, 2016-2030F
- Figure 69. Brazil Surface Mount Technology Market, By Value, in USD Billion, 2016-2030F
- Figure 70. Brazil Surface Mount Technology Market, By Volume, in Thousand Units, 2016-2030F
- Figure 71. Brazil Surface Mount Technology Market Share, By Equipment Type, in USD Billion, 2016-2030F
- Figure 72. Brazil Surface Mount Technology Market Share, By Application, in USD Billion, 2016-2030F
- Figure 73. Argentina Surface Mount Technology Market, By Value, in USD Billion, 2016-2030F
- Figure 74. Argentina Surface Mount Technology Market, By Volume, in Thousand Units, 2016-2030F
- Figure 75. Argentina Surface Mount Technology Market Share, By Equipment Type, in USD Billion, 2016-2030F
- Figure 76. Argentina Surface Mount Technology Market Share, By Application, in USD Billion, 2016-2030F
- Figure 77. Asia-Pacific Surface Mount Technology Market, By Value, in USD Billion, 2016-2030F
- Figure 78. Asia-Pacific Surface Mount Technology Market, By Volume, in Thousand Units, 2016-2030F
- Figure 79. Asia-Pacific Surface Mount Technology Market Share, By Equipment Type, in USD Billion, 2016-2030F
- Figure 80. Asia-Pacific Surface Mount Technology Market Share, By Application, in USD Billion, 2016-2030F
- Figure 81. Asia-Pacific Surface Mount Technology Market Share, By Country, in USD Billion, 2016-2030F
- Figure 82. India Surface Mount Technology Market, By Value, in USD Billion, 2016-2030F
- Figure 83. India Surface Mount Technology Market, By Volume, in Thousand Units, 2016-2030F
- Figure 84. India Surface Mount Technology Market Share, By Equipment Type, in USD Billion, 2016-2030F
- Figure 85. India Surface Mount Technology Market Share, By Application, in USD Billion, 2016-2030F
- Figure 86. China Surface Mount Technology Market, By Value, in USD Billion, 2016-2030F
- Figure 87. China Surface Mount Technology Market, By Volume, in Thousand Units, 2016-2030F
- Figure 88. China Surface Mount Technology Market Share, By Equipment Type, in USD Billion, 2016-2030F
- Figure 89. China Surface Mount Technology Market Share, By Application, in USD Billion, 2016-2030F
- Figure 90. Japan Surface Mount Technology Market, By Value, in USD Billion, 2016-2030F
- Figure 91. Japan Surface Mount Technology Market, By Volume, in Thousand Units, 2016-2030F
- Figure 92. Japan Surface Mount Technology Market Share, By Equipment Type, in USD Billion, 2016-2030F
- Figure 93. Japan Surface Mount Technology Market Share, By Application, in USD Billion, 2016-2030F
- Figure 94. Australia Surface Mount Technology Market, By Value, in USD Billion, 2016-2030F
- Figure 95. Australia Surface Mount Technology Market, By Volume, in Thousand Units, 2016-2030F
- Figure 96. Australia Surface Mount Technology Market Share, By Equipment Type, in USD Billion, 2016-2030F
- Figure 97. Australia Surface Mount Technology Market Share, By Application, in USD Billion, 2016-2030F
- Figure 98. Vietnam Surface Mount Technology Market, By Value, in USD Billion, 2016-2030F
- Figure 99. Vietnam Surface Mount Technology Market, By Volume, in Thousand Units, 2016-2030F
- Figure 100. Vietnam Surface Mount Technology Market Share, By Equipment Type, in USD Billion, 2016-2030F
- Figure 101. Vietnam Surface Mount Technology Market Share, By Application, in USD Billion, 2016-2030F
- Figure 102. South Korea Surface Mount Technology Market, By Value, in USD Billion, 2016-2030F
- Figure 103. South Korea Surface Mount Technology Market, By Volume, in Thousand Units, 2016-2030F
- Figure 104. South Korea Surface Mount Technology Market Share, By Equipment Type, in USD Billion, 2016-2030F
- Figure 105. South Korea Surface Mount Technology Market Share, By Application, in USD Billion, 2016-2030F
- Figure 106. Indonesia Surface Mount Technology Market, By Value, in USD Billion, 2016-2030F
- Figure 107. Indonesia Surface Mount Technology Market, By Volume, in Thousand Units, 2016-2030F
- Figure 108. Indonesia Surface Mount Technology Market Share, By Equipment Type, in USD Billion, 2016-2030F
- Figure 109. Indonesia Surface Mount Technology Market Share, By Application, in USD Billion, 2016-2030F
- Figure 110. Philippines Surface Mount Technology Market, By Value, in USD Billion, 2016-2030F
- Figure 111. Philippines Surface Mount Technology Market, By Volume, in Thousand Units, 2016-2030F
- Figure 112. Philippines Surface Mount Technology Market Share, By Equipment Type, in USD Billion, 2016-2030F
- Figure 113. Philippines Surface Mount Technology Market Share, By Application, in USD Billion, 2016-2030F
- Figure 114. Middle East & Africa Surface Mount Technology Market, By Value, in USD Billion, 2016-2030F
- Figure 115. Middle East & Africa Surface Mount Technology Market, By Volume, in Thousand Units, 2016-2030F
- Figure 116. Middle East & Africa Surface Mount Technology Market Share, By Equipment Type, in USD Billion, 2016-2030F
- Figure 117. Middle East & Africa Surface Mount Technology Market Share, By Application, in USD Billion, 2016-2030F
- Figure 118. Middle East & Africa Surface Mount Technology Market Share, By Country, in USD Billion, 2016-2030F
- Figure 119. Saudi Arabia Surface Mount Technology Market, By Value, in USD Billion, 2016-2030F
- Figure 120. Saudi Arabia Surface Mount Technology Market, By Volume, in Thousand Units, 2016-2030F
- Figure 121. Saudi Arabia Surface Mount Technology Market Share, By Equipment Type, in USD Billion, 2016-2030F
- Figure 122. Saudi Arabia Surface Mount Technology Market Share, By Application, in USD Billion, 2016-2030F
- Figure 123. UAE Surface Mount Technology Market, By Value, in USD Billion, 2016-2030F
- Figure 124. UAE Surface Mount Technology Market, By Volume, in Thousand Units, 2016-2030F
- Figure 125. UAE Surface Mount Technology Market Share, By Equipment Type, in USD Billion, 2016-2030F
- Figure 126. UAE Surface Mount Technology Market Share, By Application, in USD Billion, 2016-2030F
- Figure 127. South Africa Surface Mount Technology Market, By Value, in USD Billion, 2016-2030F
- Figure 128. South Africa Surface Mount Technology Market, By Volume, in Thousand Units, 2016-2030F
- Figure 129. South Africa Surface Mount Technology Market Share, By Equipment Type, in USD Billion, 2016-2030F
- Figure 130. South Africa Surface Mount Technology Market Share, By Application, in USD Billion, 2016-2030F
- Figure 131. By Equipment Type Map-Market Size (USD Billion) & Growth Rate (%), 2022
- Figure 132. By Application Map-Market Size (USD Billion) & Growth Rate (%), 2022
- Figure 133. By Region Map-Market Size (USD Billion) & Growth Rate (%), 2022
Global surface mount technology market has experienced significant growth in recent years and is expected to maintain a strong pace of expansion in the coming years. With projected revenue of approximately USD 6.07 billion in 2022, the market is forecasted to reach a value of USD 10.67 billion by 2030, displaying a robust CAGR of 7.3% from 2023 to 2030.
Surface mount technology has many benefits for electronic assembly, such as lower component sizes, increased component density, greater signal integrity, and quicker assembly times. SMT is a favored option for contemporary electronics manufacturing since it lowers manufacturing costs, improves dependability, and allows for the downsizing of electronic components.
The market for surface mount technology is expanding due to consumer demand for more compact and smaller electronic products. However, high-frequency PCB designs must be more efficient as IoT and 5G technologies advance. Furthermore, automation and robotics improvements streamline SMT manufacturing, lowering costs and raising quality. These elements are accelerating the growth of the surface mount technology market.
Surface mount technology development is closely related to the developing Internet of Things (IoT) market. The IoT's rising need for connected devices, sensors, and smart technologies require SMT's downsizing and efficiency. SMT is essential for connecting and mounting the parts that power IoT devices, which are predicted to number over 15 billion by 2023 and generate a market worth USD 1 trillion by 202 4. SMT is essential for effective manufacturing and electronics assembly to support developing markets as IoT applications continue to spread across industries including smart homes, healthcare, and agriculture.
For instance, in August 2023, Juki released LX-8, a sophisticated flexible mounter with a variety of mounting options for placing electrical components quickly. According to their production needs, users can select between speed and flexibility using the machine's exclusive Takumi and P20S Planet heads .
Role of Miniaturization Contribute to the Market
Miniaturization is a key contributor to the surface mount technology market as customer demand for smaller and more portable electronic gadgets rises. SMT enables manufacturers to produce small, light, and highly functioning electronic goods by allowing smaller and densely packed components on printed circuit boards (PCBs). The surface mount technology market's inclination for sleek and compact gadgets is in line with it, promoting the expansion. SMT is the favored assembly method for contemporary electronics due to its effectiveness in putting and soldering these tiny components, guaranteeing that the SMT stays at the forefront of technical breakthroughs and product innovation.
For example, in September 2023, for effective Research and Development to production transitions, Zhejiang Taiyun Automotive Technology, a division of the Zhejiang Taiyun Group, used Mycronic's MYPro assembly solutions. With an average of 4-5 new products per week, they concentrate on quick NPI and prototype production.
Innovation in Consumer Electronics Fuel the Surface Mount Technology Market
Consumer electronics constantly push the limits of technology by demanding more compact and robust components to create sleek and user-friendly designs. To satisfy these needs, surface mount technology is essential since it makes it possible to include cutting-edge functionality in small and visually beautiful devices. The creation of high-performance smartphones, tablets, wearables, and gaming consoles has been made possible by SMT's capacity to densely pack PCBs with micro components. It makes it easier to position processors, sensors, and communication modules, preserving the affordability and consumer appeal of these products. SMT plays a crucial role in fostering innovation as consumer electronics continue to advance, fueling its development as a crucial manufacturing technology.
For example, in July 2023, Mycronic machinery was implemented by NVZN Labs, a design and manufacturing company situated in Silicon Valley, to increase flexibility and internal production. They put a lot of effort into reducing procedures to satisfy clients' requests for quick product creation.
Dominance of Placement Equipment in Surface Mount Technology Market
Placement equipment continues to dominate the surface mount technology market owing to its crucial function in the precision assembly of electronic devices on printed circuit boards. Advanced robotics and vision technologies built into these machines allow for the rapid and precise positioning of miniature components. The effectiveness and accuracy of placement equipment is crucial given the rising need for small and complicated electronic devices, such as smartphones and IoT gadgets. It has a major impact on SMT's overall functionality, fueling its hegemony as it meets the market's demand for miniaturization, high throughput, and high-quality assembly.
For instance, in February 2023, the MYTower series X models introduced by Mycronic, tripled storage capacity through creative design, accommodating up to 2,468 reels, while maintaining essential features like quick retrieval and automated stock monitoring .
Asia-Pacific Dominates Surface Mount Technology Market
Asia-Pacific dominates the surface mount technology market. As Asia-Pacific is a significant electronics manufacturing hub, with many electronics and semiconductor businesses based in nations like China, Japan, South Korea, and Taiwan. These countries have a strong SMT infrastructure, which supports surface mount technology market expansion. Additionally, Asia-Pacific gains from a labor base that is both talented and affordable, which boosts manufacturing productivity. The adoption of sophisticated SMT techniques is a result of the region's strong emphasis on technology and innovation. Consequently, Asia-Pacific is the hub of SMT activity globally due to its proximity to the rapidly expanding consumer electronics industries. As devices like smartphones and wearables continue to develop, the region's demand for SMT is amplified.
For instance, in May 2023, Yamaha Motor unveiled the YRP10 solder paste printer, a high-speed, high-precision, fully automated printer capable of dual-lane production and featuring improved printing accuracy and automation capabilities that contribute to efficient PCB assembly processes.
Government Initiatives Acting as Catalyst
Government initiatives are essential for the development of the global surface mount technology market. Programs have been put in place by several nations, including the United States, to advance the electronics manufacturing industry, of which SMT is a crucial component. Initiatives emphasize encouraging innovation, workforce development, and research and development. For instance, the National Network for Manufacturing Innovation (NNMI) in the United States has started programs to improve advanced manufacturing methods, which are advantageous to SMT. These initiatives boost domestic SMT growth and improve a country's standing in the international electronics market, promoting competitiveness and technical advancement.
For example, in January 2023, Mycronic presented Escape Tracker, an automated programming assistant for inspection models. It automatically refreshes the inspection library based on actual production data, boosting accuracy without manual programming and requiring less time and work .
Impact of COVID-19
Before COVID-19, the surface mount technology market was expanding due to rising demand for compact, high-performing electronic gadgets. Although the pandemic hampered supply chains, production ceased, and SMT equipment and components shipments were affected. On-site installation and maintenance of SMT machinery became difficult due to travel restrictions and lockdowns. Due to the rise in remote work and digital transformation, increased demand for electronics after COVID-19, the SMT market recovered. SMT was crucial for the productive production of smart devices, 5G infrastructure, and IoT technology as these needs grew. The sector adjusted with automation and remote assistance, providing dependable production and growth in the constantly changing electronics market.
Future Market Scenario (2024 - 2030F)
The use of cutting-edge materials, such as flexible substrates and cutting-edge solder formulations, would increase the reliability and effectiveness of surface mount technology components, enabling the creation of more durable electronics.
Predictive maintenance and quality control powered by AI will be standard in SMT procedures, increasing productivity, and lowering faults.
SMT will meet the rising demand for high-frequency applications, including radar systems, driverless vehicles, and 5G infrastructure.
To reduce the effects of geopolitical risks like the ongoing conflict between Russia and Ukraine, SMT market may adjust to more diversified and robust supply chains.
Key Players Landscape and Outlook
The global surface mount technology market is characterized by intense rivalry, with prominent companies including FUJI CORPORATION, Hitachi, Ltd., Panasonic Corporation, Yamaha Motor Co., Ltd., and Nordson Corporation dominating the market. The growing demand for highly efficient and downsized electronic devices, notably in the consumer electronics and automotive industries, is what is driving this market's outlook. SMT is essential for enabling compact and effective electronic assembly as technology develops. Businesses are investing in automation, AI-driven quality control, and environmentally friendly procedures to stay competitive. The market is anticipated to expand as applications based on 5G technology and Internet of Things will develop further, creating potential for SMT solutions.
In March 2023, Nordson expanded the size of its plant in the United States and now provides a variety of industries with cutting-edge adhesive and sealant dispensing systems and services. The Pro-Meter S, a cutting-edge dispensing device built for accuracy and automation in sealant and adhesive application, is a prime example of how this expansion will improve production efficiency and quality control.
In February 2023, Yamaha Motor launched the YRM20DL surface mounter, which provides high-efficiency modular PCB assembly with a dual-lane conveyor, increased productivity, and high-speed, high-accuracy performance.
Table of Contents
1. Research Methodology
2. Project Scope & Definitions
3. Impact of COVID-19 on Global Surface Mount Technology Market
4. Executive Summary
5. Voice of Customer
- 5.1. Product and Market Intelligence
- 5.2. Mode of Brand Awareness
- 5.3. Factors Considered in Purchase Decisions
- 5.3.1. Features and other value-added service
- 5.3.2. IT Infrastructure Compatibility
- 5.3.3. Efficiency of Solutions
- 5.3.4. After-Sales Support
- 5.4. Consideration of Privacy & Safety Regulations
6. Global Surface Mount Technology Market Outlook, 2016-2030F
- 6.1. Market Size & Forecast
- 6.1.1. By Value
- 6.1.2. By Volume
- 6.2. By Equipment Type
- 6.2.1. Inspection Equipment
- 6.2.2. Placement Equipment
- 6.2.3. Soldering Equipment
- 6.2.4. Screen Printing Equipment
- 6.2.5. Cleaning Equipment
- 6.2.6. Rework and Repair Equipment
- 6.3. By Application
- 6.3.1. Consumer Electronics
- 6.3.2. Telecommunications
- 6.3.3. Aerospace and Defense
- 6.3.4. Automotive
- 6.3.5. Medical
- 6.3.6. Industrial
- 6.3.7. Energy and Power Systems
- 6.4. By Region
- 6.4.1. North America
- 6.4.2. Europe
- 6.4.3. Asia-Pacific
- 6.4.4. South America
- 6.4.5. Middle East and Africa
- 6.5. By Company Market Share (%), 2022
7. Global Surface Mount Technology Market Outlook, By Region, 2016-2030F
- 7.1. North America*
- 7.1.1. Market Size & Forecast
- 7.1.1.1. By Value
- 7.1.1.2. By Volume
- 7.1.2. By Equipment Type
- 7.1.2.1. Inspection Equipment
- 7.1.2.2. Placement Equipment
- 7.1.2.3. Soldering Equipment
- 7.1.2.4. Screen Printing Equipment
- 7.1.2.5. Cleaning Equipment
- 7.1.2.6. Rework and Repair Equipment
- 7.1.3. By Application
- 7.1.3.1. Consumer Electronics
- 7.1.3.2. Telecommunications
- 7.1.3.3. Aerospace and Defense
- 7.1.3.4. Automotive
- 7.1.3.5. Medical
- 7.1.3.6. Industrial
- 7.1.3.7. Energy and Power Systems
- 7.1.4. United States*
- 7.1.4.1. Market Size & Forecast
- 7.1.4.1.1. By Value
- 7.1.4.1.2. By Volume
- 7.1.4.2. By Equipment Type
- 7.1.4.2.1. Inspection Equipment
- 7.1.4.2.2. Placement Equipment
- 7.1.4.2.3. Soldering Equipment
- 7.1.4.2.4. Screen Printing Equipment
- 7.1.4.2.5. Cleaning Equipment
- 7.1.4.2.6. Rework and Repair Equipment
- 7.1.4.3. By Application
- 7.1.4.3.1. Consumer Electronics
- 7.1.4.3.2. Telecommunications
- 7.1.4.3.3. Aerospace and Defense
- 7.1.4.3.4. Automotive
- 7.1.4.3.5. Medical
- 7.1.4.3.6. Industrial
- 7.1.4.3.7. Energy and Power Systems
- 7.1.5. Canada
- 7.1.6. Mexico
- 7.1.1. Market Size & Forecast
All segments will be provided for all regions and countries covered:
- 7.2. Europe
- 7.2.1. Germany
- 7.2.2. France
- 7.2.3. Italy
- 7.2.4. United Kingdom
- 7.2.5. Russia
- 7.2.6. Netherlands
- 7.2.7. Spain
- 7.2.8. Turkey
- 7.2.9. Poland
- 7.3. Asia Pacific
- 7.3.1. India
- 7.3.2. China
- 7.3.3. Japan
- 7.3.4. Australia
- 7.3.5. Vietnam
- 7.3.6. South Korea
- 7.3.7. Indonesia
- 7.3.8. Philippines
- 7.4. South America
- 7.4.1. Brazil
- 7.4.2. Argentina
- 7.5. Middle East & Africa
- 7.5.1. Saudi Arabia
- 7.5.2. UAE
- 7.5.3. South Africa
8. Market Mapping, 2022
- 8.1. By Equipment Type
- 8.2. By Application
- 8.3. By Region
9. Macro Environment and Industry Structure
- 9.1. Demand Supply Analysis
- 9.2. Import Export Analysis
- 9.3. Value Chain Analysis
- 9.4. PESTEL Analysis
- 9.4.1. Political Factors
- 9.4.2. Economic System
- 9.4.3. Social Implications
- 9.4.4. Technological Advancements
- 9.4.5. Environmental Impacts
- 9.4.6. Legal Compliances and Regulatory Policies (Statutory Bodies Included)
- 9.5. Porter's Five Forces Analysis
- 9.5.1. Supplier Power
- 9.5.2. Buyer Power
- 9.5.3. Substitution Threat
- 9.5.4. Threat from New Entrant
- 9.5.5. Competitive Rivalry
10. Market Dynamics
- 10.1. Growth Drivers
- 10.2. Growth Inhibitors (Challenges and Restraints)
11. Key Players Landscape
- 11.1. Competition Matrix of Top Five Market Leaders
- 11.2. Market Revenue Analysis of Top Five Market Leaders (in %, 2022)
- 11.3. Mergers and Acquisitions/Joint Ventures (If Applicable)
- 11.4. SWOT Analysis (For Five Market Players)
- 11.5. Patent Analysis (If Applicable)
12. Case Studies
13. Key Players Outlook
- 13.1. FUJI CORPORATION
- 13.1.1. Company Details
- 13.1.2. Key Management Personnel
- 13.1.3. Products & Services
- 13.1.4. Financials (As reported)
- 13.1.5. Key Market Focus & Geographical Presence
- 13.1.6. Recent Developments
- 13.2. Hitachi, Ltd.
- 13.3. JUKI CORPORATION
- 13.4. KLA Corporation
- 13.5. Mycronic AB
- 13.6. Nordson Corporation
- 13.7. Panasonic Corporation
- 13.8. Universal Instruments Corporation (Delta Electronics, Inc.)
- 13.9. Viscom AG
- 13.10. Yamaha Motor Co., Ltd.
Companies mentioned above DO NOT hold any order as per market share and can be changed as per information available during research work.

