|
|
市場調査レポート
商品コード
1394205
ヒマシ油の世界市場の評価:製品タイプ別、用途別、流通チャネル別、地域別、機会、予測(2016年~2030年)Castor Oil Market Assessment, By Product Type, By Application, By Distribution Channel, By Region, Opportunities, and Forecast, 2016-2030F |
||||||

|
|||||||
カスタマイズ可能
|
|||||||

| ヒマシ油の世界市場の評価:製品タイプ別、用途別、流通チャネル別、地域別、機会、予測(2016年~2030年) |
|
出版日: 2023年12月08日
発行: Markets & Data
ページ情報: 英文 201 Pages
納期: 3~5営業日
|

全表示
- 概要
- 図表
- 目次
世界のヒマシ油の市場規模は、2022年の13億5,000万米ドルから2030年までに19億8,000万米ドルに達し、2023年~2030年の予測期間にCAGRで4.9%の成長が見込まれています。消費者の選好が変化し、植物由来の化粧品原料へと動向が移る中、ヒマシ油は今後数年間で需要が高まると予測されます。さらに、ヒマシ油はバイオディーゼルやその他のバイオベース製品の製造に多く使用されており、再生可能エネルギー源として普及が進むと予測されます。ヒマシ油はその特性上、幅広い用途があり、移り変わる消費者や業界の動向に適応できるため、サプライチェーンの混乱や地政学的不確実性などの外部要因に強い製品です。
インドはヒマシ油生産の世界的リーダーです。2021年~2022年に160万トンのヒマシ油が生産され、2022年~2023年に15%増の190万トンに達しました。収穫高の向上は、作付面積の増加と水利の改善に起因しています。さらに、インドは現在、2018年よりも多くのヒマシ油を輸出しており、54万7,000トンから2021年に68万5,000トンを超え、世界の供給の90%近くを占めています。しかし、インドの生産者と輸出業者は、ヒマシ製品のほぼ独占的な生産者であるにもかかわらず、さまざまな内外のリスクにより頻繁に価格変動にさらされています。このことは、価格リスク管理の必要性を浮き彫りにしています。
天然のオーガニック製品への消費者動向の変化によるヒマシ油需要の急増
ヒマシ油は、より健康的な生活を求める世界の動きの一部として、消費者が天然製品やオーガニック製品を好むようになったため、ますます人気が高まっています。ヒマシ油の需要は、特に化粧品やパーソナルケア製品において、消費者が化学品を含まない代替品の利点をより意識するようになるにつれて高まっています。植物由来の持続可能な代用品であり、その天然の性質で知られるヒマシ油は、化粧品の原料として人気が高まっています。ヒマシ油は環境にやさしく、汎用性が高いため、製品成分の透明性を重視する消費者に求められています。これは、クリーンでオーガニックなライフスタイルを採用する人々の増加傾向に合致しています。
バイオベース製品とバイオディーゼル生産の需要促進
ヒマシ油は再生可能な資源として知られるようになってきており、これは世界規模での持続可能性への動きと一致しています。バイオベース製品に対する消費者の認知と選好により、さまざまな用途におけるヒマシ油の需要が増加しています。再生可能エネルギー産業を支えるバイオディーゼル生産の原料としての利用は、重要な用途の1つです。ヒマシ油は非常に汎用性が高く、環境にやさしいソリューションであるため、各国がよりクリーンで環境にやさしいエネルギー源の目標を達成するのに役立ちます。また、世界の再生可能エネルギーへの取り組みやバイオベース製品の開発の進行においても重要な役割を果たしています。
2023年7月、Evogene Ltd.の子会社であるCasterra Ag Ltd.は、アフリカに220万米ドル相当のヒマシ種子を供給すると発表しました。これらのヒマシ種子は、持続可能なバイオ燃料用の油の生産に使用される予定です。
COVID-19の影響
COVID-19の大流行はヒマシ油市場に大きな影響を与え、課題と機会の両方をもたらしました。当初の世界のサプライチェーンの混乱と景気後退は工業活動の減少を招き、化学や製造などの部門におけるヒマシ油の需要に影響を与えました。ロックダウンや規制は農業活動をも妨げ、ヒマシ油の栽培や生産に影響を与えました。しかし、パンデミックによる健康とウェルネスへの注目は、ヒマシ油を含む医薬品やパーソナルケア部門における天然のオーガニック製品に対する需要を促進しました。世界がニューノーマルに適応するにつれ、ヒマシ油市場は、その多様な用途、生物由来の性質、さまざまな産業における持続可能で環境にやさしいソリューションを重視する意識の高まりによって、復活を見せています。COVID-19後の時代は、消費者の選好が進化し、世界の経済活動が再び活発化する中で、ヒマシ油市場が回復し、繁栄する好機です。
当レポートでは、世界のヒマシ油市場について調査分析し、市場規模と予測、市場力学、主要企業の情勢と見通しなどを提供しています。
目次
第1章 調査手法
第2章 プロジェクトの範囲と定義
第3章 世界のヒマシ油市場に対するCOVID-19の影響
第4章 エグゼクティブサマリー
第5章 顧客の声
- 人口統計(年齢/コホート分析 - 団塊の世代とX世代、ミレニアル世代、Z世代、性別、所得 - 低、中、高、地域、国籍など)
- ブランドと製品の認知度
- 購入決定において考慮される要素
- 購入チャネル
- 既存のユーザーまたは対象ユーザー
- 友人、家族からの推奨/オンラインのレビュー
- 製品/ブランドの吸収におけるブランドアンバサダーまたはインフルエンサーマーケティングの役割
第6章 世界のヒマシ油市場の見通し(2016年~2030年)
- 市場規模と予測
- 金額
- 数量
- 製品タイプ別
- 低温圧搾ヒマシ油
- 水添ヒマシ油
- ジャマイカ黒ヒマシ油
- 脱水ヒマシ油
- その他
- 用途別
- 製薬
- 化粧品、パーソナルケア
- 潤滑剤
- コーティング
- バイオディーゼル
- 農業
- プラスチック、樹脂
- 食品、飲料
- 動物飼料
- その他
- 流通チャネル別
- 直販
- ハイパーマーケット/スーパーマーケット
- コンビニエンスストア
- 従来型の食料品店
- 専門店
- オンライン小売
- 薬局・ドラッグストア
- その他
- 地域別
- 北米
- 南米
- 欧州
- アジア太平洋
- 中東・アフリカ
- 市場シェア:企業別(2022年)
第7章 世界のヒマシ油市場の見通し:地域別(2016年~2030年)
- 北米
- 市場規模と予測
- 製品タイプ別
- 用途別
- 流通チャネル
- 米国
- 流通チャネル別
- カナダ
- メキシコ
- 欧州
- ドイツ
- フランス
- イタリア
- 英国
- ロシア
- オランダ
- スペイン
- トルコ
- ポーランド
- 南米
- ブラジル
- アルゼンチン
- アジア太平洋
- インド
- 中国
- 日本
- オーストラリア
- ベトナム
- 韓国
- インドネシア
- フィリピン
- 中東・アフリカ
- サウジアラビア
- アラブ首長国連邦
- 南アフリカ
第8章 市場マッピング(2022年)
- 製品タイプ別
- 用途別
- 流通チャネル別
- 地域別
第9章 マクロ環境と産業構造
- 需給分析
- 輸出入の分析
- バリューチェーン分析
- PESTEL分析
- ポーターのファイブフォース分析
第10章 市場力学
- 成長促進要因
- 成長抑制要因(課題、抑制要因)
第11章 主要企業情勢
- マーケットリーダー上位5社の競合マトリクス
- マーケットリーダー上位5社の市場収益分析(2022年)
- 合併と買収/合弁事業(該当する場合)
- SWOT分析(市場参入企業5社)
- 特許分析(該当する場合)
第12章 価格分析
第13章 ケーススタディ
第14章 主要企業の見通し
- JAYANT AGRO-ORGANICS LIMITED
- Gokulrefoil
- Silverline Chemicals
- N.K.Proteins Pvt Limited
- Adani Group
- Adya Oils & Chemicals Ltd.
- BASF SE
- Ambuja Solvex Pvt. Ltd.
- Arkema
- Connoils
第15章 戦略的推奨事項
第16章 当社について、免責事項
List of Tables
- Table 1. Pricing Analysis of Products from Key Players
- Table 2. Competition Matrix of Top 5 Market Leaders
- Table 3. Mergers & Acquisitions/ Joint Ventures (If Applicable)
- Table 4. About Us - Regions and Countries Where We Have Executed Client Projects
List of Figures
- Figure 1. Global Castor Oil Market, By Value, in USD Billion, 2016-2030F
- Figure 2. Global Castor Oil Market, By Volume, in Million Tons, 2016-2030F
- Figure 3. Global Castor Oil Market Share, By Product Type, in USD Billion, 2016-2030F
- Figure 4. Global Castor Oil Market Share, By Application, in USD Billion, 2016-2030F
- Figure 5. Global Castor Oil Market Share, By Distribution Channel, in USD Billion, 2016-2030F
- Figure 6. Global Castor Oil Market Share, By Region, in USD Billion, 2016-2030F
- Figure 7. North America Castor Oil Market, By Value, in USD Billion, 2016-2030F
- Figure 8. North America Castor Oil Market, By Volume, in Million Tons, 2016-2030F
- Figure 9. North America Castor Oil Market Share, By Product Type, in USD Billion, 2016-2030F
- Figure 10. North America Castor Oil Market Share, By Application, in USD Billion, 2016-2030F
- Figure 11. North America Castor Oil Market Share, By Distribution Channel, in USD Billion, 2016-2030F
- Figure 12. North America Castor Oil Market Share, By Country, in USD Billion, 2016-2030F
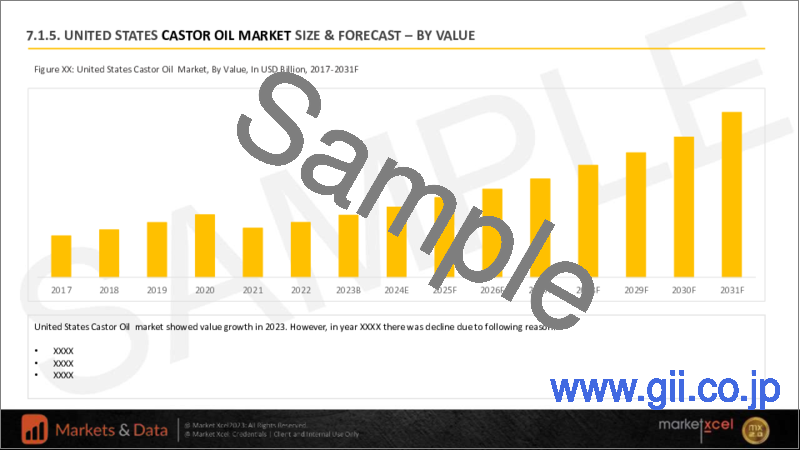
- Figure 13. United States Castor Oil Market, By Value, in USD Billion, 2016-2030F
- Figure 14. United States Castor Oil Market, By Volume, in Million Tons, 2016-2030F
- Figure 15. United States Castor Oil Market Share, By Product Type, in USD Billion, 2016-2030F
- Figure 16. United States Castor Oil Market Share, By Application, in USD Billion, 2016-2030F
- Figure 17. United States Castor Oil Market Share, By Distribution Channel, in USD Billion, 2016-2030F
- Figure 18. Canada Castor Oil Market, By Value, in USD Billion, 2016-2030F
- Figure 19. Canada Castor Oil Market, By Volume, in Million Tons, 2016-2030F
- Figure 20. Canada Castor Oil Market Share, By Product Type, in USD Billion, 2016-2030F
- Figure 21. Canada Castor Oil Market Share, By Application, in USD Billion, 2016-2030F
- Figure 22. Canada Castor Oil Market Share, By Distribution Channel, in USD Billion, 2016-2030F
- Figure 23. Mexico Castor Oil Market, By Value, in USD Billion, 2016-2030F
- Figure 24. Mexico Castor Oil Market, By Volume, in Million Tons, 2016-2030F
- Figure 25. Mexico Castor Oil Market Share, By Product Type, in USD Billion, 2016-2030F
- Figure 26. Mexico Castor Oil Market Share, By Application, in USD Billion, 2016-2030F
- Figure 27. Mexico Castor Oil Market Share, By Distribution Channel, in USD Billion, 2016-2030F
- Figure 28. Europe Castor Oil Market, By Value, in USD Billion, 2016-2030F
- Figure 29. Europe Castor Oil Market, By Volume, in Million Tons, 2016-2030F
- Figure 30. Europe Castor Oil Market Share, By Product Type, in USD Billion, 2016-2030F
- Figure 31. Europe Castor Oil Market Share, By Application, in USD Billion, 2016-2030F
- Figure 32. Europe Castor Oil Market Share, By Distribution Channel, in USD Billion, 2016-2030F
- Figure 33. Europe Castor Oil Market Share, By Country, in USD Billion, 2016-2030F
- Figure 34. Germany Castor Oil Market, By Value, in USD Billion, 2016-2030F
- Figure 35. Germany Castor Oil Market, By Volume, in Million Tons, 2016-2030F
- Figure 36. Germany Castor Oil Market Share, By Product Type, in USD Billion, 2016-2030F
- Figure 37. Germany Castor Oil Market Share, By Application, in USD Billion, 2016-2030F
- Figure 38. Germany Castor Oil Market Share, By Distribution Channel, in USD Billion, 2016-2030F
- Figure 39. France Castor Oil Market, By Value, in USD Billion, 2016-2030F
- Figure 40. France Castor Oil Market, By Volume, in Million Tons, 2016-2030F
- Figure 41. France Castor Oil Market Share, By Product Type, in USD Billion, 2016-2030F
- Figure 42. France Castor Oil Market Share, By Application, in USD Billion, 2016-2030F
- Figure 43. France Castor Oil Market Share, By Distribution Channel, in USD Billion, 2016-2030F
- Figure 44. Italy Castor Oil Market, By Value, in USD Billion, 2016-2030F
- Figure 45. Italy Castor Oil Market, By Volume, in Million Tons, 2016-2030F
- Figure 46. Italy Castor Oil Market Share, By Product Type, in USD Billion, 2016-2030F
- Figure 47. Italy Castor Oil Market Share, By Application, in USD Billion, 2016-2030F
- Figure 48. Italy Castor Oil Market Share, By Distribution Channel, in USD Billion, 2016-2030F
- Figure 49. United Kingdom Castor Oil Market, By Value, in USD Billion, 2016-2030F
- Figure 50. United Kingdom Castor Oil Market, By Volume, in Million Tons, 2016-2030F
- Figure 51. United Kingdom Castor Oil Market Share, By Product Type, in USD Billion, 2016-2030F
- Figure 52. United Kingdom Castor Oil Market Share, By Application, in USD Billion, 2016-2030F
- Figure 53. United Kingdom Castor Oil Market Share, By Distribution Channel, in USD Billion, 2016-2030F
- Figure 54. Russia Castor Oil Market, By Value, in USD Billion, 2016-2030F
- Figure 55. Russia Castor Oil Market, By Volume, in Million Tons, 2016-2030F
- Figure 56. Russia Castor Oil Market Share, By Product Type, in USD Billion, 2016-2030F
- Figure 57. Russia Castor Oil Market Share, By Application, in USD Billion, 2016-2030F
- Figure 58. Russia Castor Oil Market Share, By Distribution Channel, in USD Billion, 2016-2030F
- Figure 59. Netherlands Castor Oil Market, By Value, in USD Billion, 2016-2030F
- Figure 60. Netherlands Castor Oil Market, By Volume, in Million Tons, 2016-2030F
- Figure 61. Netherlands Castor Oil Market Share, By Product Type, in USD Billion, 2016-2030F
- Figure 62. Netherlands Castor Oil Market Share, By Application, in USD Billion, 2016-2030F
- Figure 63. Netherlands Castor Oil Market Share, By Distribution Channel, in USD Billion, 2016-2030F
- Figure 64. Spain Castor Oil Market, By Value, in USD Billion, 2016-2030F
- Figure 65. Spain Castor Oil Market, By Volume, in Million Tons, 2016-2030F
- Figure 66. Spain Castor Oil Market Share, By Product Type, in USD Billion, 2016-2030F
- Figure 67. Spain Castor Oil Market Share, By Application, in USD Billion, 2016-2030F
- Figure 68. Spain Castor Oil Market Share, By Distribution Channel, in USD Billion, 2016-2030F
- Figure 69. Turkey Castor Oil Market, By Value, in USD Billion, 2016-2030F
- Figure 70. Turkey Castor Oil Market, By Volume, in Million Tons, 2016-2030F
- Figure 71. Turkey Castor Oil Market Share, By Product Type, in USD Billion, 2016-2030F
- Figure 72. Turkey Castor Oil Market Share, By Application, in USD Billion, 2016-2030F
- Figure 73. Turkey Castor Oil Market Share, By Distribution Channel, in USD Billion, 2016-2030F
- Figure 74. Poland Castor Oil Market, By Value, in USD Billion, 2016-2030F
- Figure 75. Poland Castor Oil Market, By Volume, in Million Tons, 2016-2030F
- Figure 76. Poland Castor Oil Market Share, By Product Type, in USD Billion, 2016-2030F
- Figure 77. Poland Castor Oil Market Share, By Application, in USD Billion, 2016-2030F
- Figure 78. Poland Castor Oil Market Share, By Distribution Channel, in USD Billion, 2016-2030F
- Figure 79. South America Castor Oil Market, By Value, in USD Billion, 2016-2030F
- Figure 80. South America Castor Oil Market, By Volume, in Million Tons, 2016-2030F
- Figure 81. South America Castor Oil Market Share, By Product Type, in USD Billion, 2016-2030F
- Figure 82. South America Castor Oil Market Share, By Application, in USD Billion, 2016-2030F
- Figure 83. South America Castor Oil Market Share, By Distribution Channel, in USD Billion, 2016-2030F
- Figure 84. South America Castor Oil Market Share, By Country, in USD Billion, 2016-2030F
- Figure 85. Brazil Castor Oil Market, By Value, in USD Billion, 2016-2030F
- Figure 86. Brazil Castor Oil Market, By Volume, in Million Tons, 2016-2030F
- Figure 87. Brazil Castor Oil Market Share, By Product Type, in USD Billion, 2016-2030F
- Figure 88. Brazil Castor Oil Market Share, By Application, in USD Billion, 2016-2030F
- Figure 89. Brazil Castor Oil Market Share, By Distribution Channel, in USD Billion, 2016-2030F
- Figure 90. Argentina Castor Oil Market, By Value, in USD Billion, 2016-2030F
- Figure 91. Argentina Castor Oil Market, By Volume, in Million Tons, 2016-2030F
- Figure 92. Argentina Castor Oil Market Share, By Product Type, in USD Billion, 2016-2030F
- Figure 93. Argentina Castor Oil Market Share, By Application, in USD Billion, 2016-2030F
- Figure 94. Argentina Castor Oil Market Share, By Distribution Channel, in USD Billion, 2016-2030F
- Figure 95. Asia-Pacific Castor Oil Market, By Value, in USD Billion, 2016-2030F
- Figure 96. Asia-Pacific Castor Oil Market, By Volume, in Million Tons, 2016-2030F
- Figure 97. Asia-Pacific Castor Oil Market Share, By Product Type, in USD Billion, 2016-2030F
- Figure 98. Asia-Pacific Castor Oil Market Share, By Application, in USD Billion, 2016-2030F
- Figure 99. Asia-Pacific Castor Oil Market Share, By Distribution Channel, in USD Billion, 2016-2030F
- Figure 100. Asia-Pacific Castor Oil Market Share, By Country, in USD Billion, 2016-2030F
- Figure 101. India Castor Oil Market, By Value, in USD Billion, 2016-2030F
- Figure 102. India Castor Oil Market, By Volume, in Million Tons, 2016-2030F
- Figure 103. India Castor Oil Market Share, By Product Type, in USD Billion, 2016-2030F
- Figure 104. India Castor Oil Market Share, By Application, in USD Billion, 2016-2030F
- Figure 105. India Castor Oil Market Share, By Distribution Channel, in USD Billion, 2016-2030F
- Figure 106. China Castor Oil Market, By Value, in USD Billion, 2016-2030F
- Figure 107. China Castor Oil Market, By Volume, in Million Tons, 2016-2030F
- Figure 108. China Castor Oil Market Share, By Product Type, in USD Billion, 2016-2030F
- Figure 109. China Castor Oil Market Share, By Application, in USD Billion, 2016-2030F
- Figure 110. China Castor Oil Market Share, By Distribution Channel, in USD Billion, 2016-2030F
- Figure 111. Japan Castor Oil Market, By Value, in USD Billion, 2016-2030F
- Figure 112. Japan Castor Oil Market, By Volume, in Million Tons, 2016-2030F
- Figure 113. Japan Castor Oil Market Share, By Product Type, in USD Billion, 2016-2030F
- Figure 114. Japan Castor Oil Market Share, By Application, in USD Billion, 2016-2030F
- Figure 115. Japan Castor Oil Market Share, By Distribution Channel, in USD Billion, 2016-2030F
- Figure 116. Australia Castor Oil Market, By Value, in USD Billion, 2016-2030F
- Figure 117. Australia Castor Oil Market, By Volume, in Million Tons, 2016-2030F
- Figure 118. Australia Castor Oil Market Share, By Product Type, in USD Billion, 2016-2030F
- Figure 119. Australia Castor Oil Market Share, By Application, in USD Billion, 2016-2030F
- Figure 120. Australia Castor Oil Market Share, By Distribution Channel, in USD Billion, 2016-2030F
- Figure 121. Vietnam Castor Oil Market, By Value, in USD Billion, 2016-2030F
- Figure 122. Vietnam Castor Oil Market, By Volume, in Million Tons, 2016-2030F
- Figure 123. Vietnam Castor Oil Market Share, By Product Type, in USD Billion, 2016-2030F
- Figure 124. Vietnam Castor Oil Market Share, By Application, in USD Billion, 2016-2030F
- Figure 125. Vietnam Castor Oil Market Share, By Distribution Channel, in USD Billion, 2016-2030F
- Figure 126. South Korea Castor Oil Market, By Value, in USD Billion, 2016-2030F
- Figure 127. South Korea Castor Oil Market, By Volume, in Million Tons, 2016-2030F
- Figure 128. South Korea Castor Oil Market Share, By Product Type, in USD Billion, 2016-2030F
- Figure 129. South Korea Castor Oil Market Share, By Application, in USD Billion, 2016-2030F
- Figure 130. South Korea Castor Oil Market Share, By Distribution Channel, in USD Billion, 2016-2030F
- Figure 131. Indonesia Castor Oil Market, By Value, in USD Billion, 2016-2030F
- Figure 132. Indonesia Castor Oil Market, By Volume, in Million Tons, 2016-2030F
- Figure 133. Indonesia Castor Oil Market Share, By Product Type, in USD Billion, 2016-2030F
- Figure 134. Indonesia Castor Oil Market Share, By Application, in USD Billion, 2016-2030F
- Figure 135. Indonesia Castor Oil Market Share, By Distribution Channel, in USD Billion, 2016-2030F
- Figure 136. Philippines Castor Oil Market, By Value, in USD Billion, 2016-2030F
- Figure 137. Philippines Castor Oil Market, By Volume, in Million Tons, 2016-2030F
- Figure 138. Philippines Castor Oil Market Share, By Product Type, in USD Billion, 2016-2030F
- Figure 139. Philippines Castor Oil Market Share, By Application, in USD Billion, 2016-2030F
- Figure 140. Philippines Castor Oil Market Share, By Distribution Channel, in USD Billion, 2016-2030F
- Figure 141. Middle East & Africa Castor Oil Market, By Value, in USD Billion, 2016-2030F
- Figure 142. Middle East & Africa Castor Oil Market, By Volume, in Million Tons, 2016-2030F
- Figure 143. Middle East & Africa Castor Oil Market Share, By Product Type, in USD Billion, 2016-2030F
- Figure 144. Middle East & Africa Castor Oil Market Share, By Application, in USD Billion, 2016-2030F
- Figure 145. Middle East & Africa Castor Oil Market Share, By Distribution Channel, in USD Billion, 2016-2030F
- Figure 146. Middle East & Africa Castor Oil Market Share, By Country, in USD Billion, 2016-2030F
- Figure 147. Saudi Arabia Castor Oil Market, By Value, in USD Billion, 2016-2030F
- Figure 148. Saudi Arabia Castor Oil Market, By Volume, in Million Tons, 2016-2030F
- Figure 149. Saudi Arabia Castor Oil Market Share, By Product Type, in USD Billion, 2016-2030F
- Figure 150. Saudi Arabia Castor Oil Market Share, By Application, in USD Billion, 2016-2030F
- Figure 151. Saudi Arabia Castor Oil Market Share, By Distribution Channel, in USD Billion, 2016-2030F
- Figure 152. UAE Castor Oil Market, By Value, in USD Billion, 2016-2030F
- Figure 153. UAE Castor Oil Market, By Volume, in Million Tons, 2016-2030F
- Figure 154. UAE Castor Oil Market Share, By Product Type, in USD Billion, 2016-2030F
- Figure 155. UAE Castor Oil Market Share, By Application, in USD Billion, 2016-2030F
- Figure 156. UAE Castor Oil Market Share, By Distribution Channel, in USD Billion, 2016-2030F
- Figure 157. South Africa Castor Oil Market, By Value, in USD Billion, 2016-2030F
- Figure 158. South Africa Castor Oil Market, By Volume, in Million Tons, 2016-2030F
- Figure 159. South Africa Castor Oil Market Share, By Product Type, in USD Billion, 2016-2030F
- Figure 160. South Africa Castor Oil Market Share, By Application, in USD Billion, 2016-2030F
- Figure 161. South Africa Castor Oil Market Share, By Distribution Channel, in USD Billion, 2016-2030F
- Figure 162. By Product Type Map-Market Size (USD Billion) & Growth Rate (%), 2022
- Figure 163. By Application Map-Market Size (USD Billion) & Growth Rate (%), 2022
- Figure 164. By Distribution Channel Map-Market Size (USD Billion) & Growth Rate (%), 2022
- Figure 165. By Region Map-Market Size (USD Billion) & Growth Rate (%), 2022
Global castor oil market size was valued at USD 1.35 billion in 2022, expected to reach USD 1.98 billion in 2030, with a CAGR of 4.9% for the forecast period between 2023 and 2030. With changing consumer preferences and shifting trends toward plant-based cosmetic ingredients, castor oil is expected to witness higher demand in the coming years. Additionally, castor oil is highly used to make biodiesel and other biobased products and is expected to become more prevalent as a renewable energy source. With its properties, castor oil has a wide range of uses and can adapt to shifting consumer and industrial trends, it is a product resistant to external factors such as supply chain disruptions and geopolitical uncertainty.
The therapeutic approach of castor oil is also creating a demand from the pharmaceutical industry. Castor oil's acute impact extends into the pharmaceutical industry, where its versatile properties are harnessed for medicinal purposes. Renowned for its therapeutic qualities, castor oil is a key ingredient in pharmaceutical laxatives, offering a natural remedy with time-tested effectiveness. Embraced for its dual role in promoting health and enhancing overall wellbeing, castor oil remains a versatile cornerstone in pharmaceutical sector.
India is the global leader in castor oil production. During 2021-2022, 1.6 million tons of castor oil was produced in the country, which increased by 15% to reach 1.9 million tons in 2022-2023. The improved yields can be attributed to higher acreage and better water availability. Furthermore, India now exports more castor oil than in 2018, from 547,000 tonnes to over 685,000 tonnes in 2021, nearly 90% of the global supply. However, Indian growers and exporters are frequently exposed to price volatility due to various internal and external risks, despite being near-monopoly producers of Castor products. This highlights the need for price risk management.
Shifting Consumer Trends Toward Natural and Organic Products Soars Demand for Castor Oil
Castor oil is becoming increasingly popular due to consumers' preference for natural and organic products as part of a global movement towards healthier living. Castor oil demand is rising, particularly in cosmetics and personal care products, as consumers become more conscious of the advantages of chemical-free alternatives. Being a plant-based sustainable substitute and known for its natural qualities, Castor oil is becoming a popular ingredient in cosmetic products known for its natural qualities. Castor oil's eco-friendliness and versatility make it a sought-after option for consumers who value transparency in product ingredients. This aligns with the growing trend of people adopting clean and organic lifestyles.
For instance, Sugar Beauty showed the properties of castor oil as it is well known for strengthening and moisturizing the hair and is also known for treating thin brows and sparse lashes. Further, it is stated that it contains a rich combination of proteins, fatty acids, and antioxidants derived from castor beans that provides a shining feel in skincare, haircare, and cosmetics. Through its properties, it has created a major position as it acts like a moisturizer to the skin and has anti-inflammatory and antibacterial properties that can help the skin, hairs and scalp.
Castor Oil is Essential for High-Efficiency Lubrication and Chemical Synthesis for Industrial Superiority
In the chemical industry, castor oil is essential because it is a flexible raw material that can be used to create important compounds. Its contributions include synthesizing derivatives like polyesters and polyamides and important chemicals like undecylenic acid and sebacic acid. Castor oil has unique qualities that make it a valuable lubricant in high-performance machinery, in addition to its chemical applications. Castor oil is superior to conventional lubricants due to its high viscosity and heat resistance, making it useful in demanding operating conditions. This dual use in industrial lubrication and chemical synthesis highlights the importance of castor oil as a multipurpose resource that enhances the effectiveness and functionality of various industrial processes.
For instance, castor oil is one of the world's most versatile oilseeds that is used in multiple industries. The by-products of castor oil are used in more than 700 products, ranging from nylon to polyester to pharmaceutical, cosmetic, and high-performance castor oil. It has a major use in the industrial sector. Furthermore, it is seen that India is the world leader in castor oil production as it accounts for over 75% of the global production and 90% of exports, with an annual output of 3,50,000 to ns. In addition, when it comes to processing castor oil, China and Brazil are slowing down behind India; their share of the global output is 5% and 12%, respectively.
Driving Demand for Bio-Based Products and the Production of Biodiesel
Castor oil is becoming more well-known as a renewable resource, which is in line with the movement toward sustainability on a global scale. The demand for castor oil in various applications has increased due to consumer awareness of and preference for bio-based products. Its use as a feedstock for biodiesel production, which supports the renewable energy industry, is one significant application. Castor oil is a highly versatile and environmentally friendly solution that can help nations achieve their goals of cleaner, greener energy sources. It also plays a significant role in the global advancement of renewable energy initiatives and the development of bio-based products.
In July 2023, Casterra Ag Ltd., a subsidiary of Evogene Ltd. announced to supply castor seeds worth USD 2.2 million to African territories. These castor seeds are to be used for producing oil for sustainable biofuel.
Impact of COVID-19
The COVID-19 pandemic has significantly impacted the castor oil market, introducing both challenges and opportunities. The initial disruption in global supply chains and economic downturns led to a decrease in industrial activities, affecting the demand for castor oil in sectors such as chemicals and manufacturing. Lockdowns and restrictions also hindered agricultural operations, impacting castor bean cultivation and oil production. However, the pandemic-induced focus on health and wellness has propelled the demand for natural and organic products in the pharmaceutical and personal care sectors, including those containing castor oil. As the world adapts to the new normal, the castor oil market is witnessing a resurgence, driven by the growing awareness of its diverse applications, bio-based nature, and the increasing emphasis on sustainable and eco-friendly solutions in various industries. The post-COVID-19 era presents an opportunity for the castor oil market to rebound and thrive amidst evolving consumer preferences and renewed global economic activities.
Key Players Landscape and Outlook
The castor oil market is characterized by key players contributing significantly to its growth and development. Prominent companies such as Jayant Agro-Organics Limited, ITOH OIL CHEMICALS CO., LTD., and Gokulrefoil play pivotal roles in producing, processing, and distributing castor oil globally. To maintain a competitive edge, these key players actively engage in strategic initiatives, including research and development, product innovation, and geographical expansion. The outlook for the castor oil market is optimistic, with increasing demand across various industries, such as pharmaceuticals, cosmetics, and chemicals.
As the market embraces sustainability and bio-based solutions, key players will likely explore opportunities in renewable energy applications, such as biodiesel production. Collaboration with regional partners, adherence to quality standards, and a focus on meeting the rising consumer demand for natural and organic products are anticipated to shape the future landscape of the castor oil market.
For instance , BASF SE in 2022, became the first manufacturing company that successfully completed the certification process conducted by SuCCESS (Sustainable Castor Caring for Environmental and Social Standards) Code, which resulted in making BASF SE as a global leader in the castor oil market.
Table of Contents
1. Research Methodology
2. Project Scope & Definitions
3. Impact of COVID-19 on Global Castor Oil Market
4. Executive Summary
5. Voice of Customer
- 5.1. Demographics (Age/Cohort Analysis - Baby Boomers and Gen X, Millennials, Gen Z; Gender; Income - Low, Mid and High; Geography; Nationality; etc.)
- 5.2. Brand and Product Awareness
- 5.3. Factors Considered in Purchase Decision
- 5.3.1. Ingredient Preferences
- 5.3.2. Durability
- 5.3.3. Price
- 5.3.4. Eco-Friendly Solutions
- 5.3.5. Availability and Accessibility
- 5.4. Purchase Channel
- 5.5. Existing or Intended User
- 5.6. Recommendations from friends, family/online reviews
- 5.7. Role of Brand Ambassador or Influencer Marketing on Product/Brand Absorption
6. Global Castor Oil Market Outlook, 2016-2030F
- 6.1. Market Size & Forecast
- 6.1.1. By Value
- 6.1.2. By Volume
- 6.2. By Product Type
- 6.2.1. Cold Pressed Castor Oil
- 6.2.2. Hydrogenated Castor Oil
- 6.2.3. Jamaican Black Castor Oil
- 6.2.4. Dehydrated Castor Oil
- 6.2.5. Others
- 6.3. By Application
- 6.3.1. Pharmaceutical
- 6.3.2. Cosmetic and Personal Care
- 6.3.2.1. Skin Care
- 6.3.2.2. Hair Care
- 6.3.2.3. Nail Care
- 6.3.2.4. Others
- 6.3.3. Lubricants
- 6.3.4. Coatings
- 6.3.5. Biodiesel
- 6.3.6. Agriculture
- 6.3.7. Plastics and Resins
- 6.3.8. Food and Beverages
- 6.3.9. Animal feed
- 6.3.10. Others
- 6.4. By Distribution Channel
- 6.4.1. Direct Sales
- 6.4.2. Hypermarket/Supermarket
- 6.4.3. Convenience Stores
- 6.4.4. Traditional Grocery Stores
- 6.4.5. Specialty Stores
- 6.4.6. Online Retail
- 6.4.7. Pharmacies & Drug Stores
- 6.4.8. Others
- 6.5. By Region
- 6.5.1. North America
- 6.5.2. South America
- 6.5.3. Europe
- 6.5.4. Asia-Pacific
- 6.5.5. Middle East & Africa
- 6.6. By Company Market Share (%), 2022
7. Global Castor Oil Market Outlook, By Region, 2016-2030F
- 7.1. North America*
- 7.1.1. Market Size & Forecast
- 7.1.1.1. By Value
- 7.1.1.2. By Volume
- 7.1.2. By Product Type
- 7.1.2.1. Cold Pressed Castor Oil
- 7.1.2.2. Hydrogenated Castor Oil
- 7.1.2.3. Jamaican Black Castor Oil
- 7.1.2.4. Dehydrated Castor Oil
- 7.1.2.5. Others
- 7.1.3. By Application
- 7.1.3.1. Pharmaceutical
- 7.1.3.2. Cosmetic and Personal Care
- 7.1.3.2.1. Skin Care
- 7.1.3.2.2. Hair Care
- 7.1.3.2.3. Nail Care
- 7.1.3.2.4. Others
- 7.1.3.3. Lubricants
- 7.1.3.4. Coatings
- 7.1.3.5. Biodiesel
- 7.1.3.6. Agriculture
- 7.1.3.7. Plastics and Resins
- 7.1.3.8. Food and Beverages
- 7.1.3.9. Animal feed
- 7.1.3.10. Others
- 7.1.4. Distribution Channel
- 7.1.4.1. Direct Sales
- 7.1.4.2. Hypermarket/Supermarket
- 7.1.4.3. Convenience Stores
- 7.1.4.4. Traditional Grocery Stores
- 7.1.4.5. Specialty Stores
- 7.1.4.6. Online Retail
- 7.1.4.7. Pharmacies & Drug Stores
- 7.1.4.8. Others
- 7.1.5. United States*
- 7.1.5.1. Market Size & Forecast
- 7.1.5.1.1. By Value
- 7.1.5.1.2. By Volume
- 7.1.5.2. By Product Type
- 7.1.5.2.1. Cold Pressed Castor Oil
- 7.1.5.2.2. Hydrogenated Castor Oil
- 7.1.5.2.3. Jamaican Black Castor Oil
- 7.1.5.2.4. Dehydrated Castor Oil
- 7.1.5.2.5. Others
- 7.1.5.3. By Application
- 7.1.5.3.1. Pharmaceutical
- 7.1.5.3.2. Cosmetic and Personal Care
- 7.1.5.3.2.1. Skin Care
- 7.1.5.3.2.2. Hair Care
- 7.1.5.3.2.3. Nail Care
- 7.1.5.3.2.4. Others
- 7.1.5.3.3. Lubricants
- 7.1.5.3.4. Coatings
- 7.1.5.3.5. Biodiesel
- 7.1.5.3.6. Agriculture
- 7.1.5.3.7. Plastics and Resins
- 7.1.5.3.8. Food and Beverages
- 7.1.5.3.9. Animal feed
- 7.1.5.4. Others
- 7.1.6. By Distribution Channel
- 7.1.6.1. Direct Sales
- 7.1.6.2. Hypermarket/Supermarket
- 7.1.6.3. Convenience Stores
- 7.1.6.4. Traditional Grocery Stores
- 7.1.6.5. Specialty Stores
- 7.1.6.6. Online Retail
- 7.1.6.7. Pharmacies & Drug Stores
- 7.1.6.8. Others
- 7.1.7. Canada
- 7.1.8. Mexico
- 7.1.1. Market Size & Forecast
All segments will be provided for all regions and countries covered:
- 7.2. Europe
- 7.2.1. Germany
- 7.2.2. France
- 7.2.3. Italy
- 7.2.4. United Kingdom
- 7.2.5. Russia
- 7.2.6. Netherlands
- 7.2.7. Spain
- 7.2.8. Turkey
- 7.2.9. Poland
- 7.3. South America
- 7.3.1. Brazil
- 7.3.2. Argentina
- 7.4. Asia-Pacific
- 7.4.1. India
- 7.4.2. China
- 7.4.3. Japan
- 7.4.4. Australia
- 7.4.5. Vietnam
- 7.4.6. South Korea
- 7.4.7. Indonesia
- 7.4.8. Philippines
- 7.5. Middle East & Africa
- 7.5.1. Saudi Arabia
- 7.5.2. UAE
- 7.5.3. South Africa
8. Market Mapping, 2022
- 8.1. By Product Type
- 8.2. By Application
- 8.3. By Distribution Channel
- 8.4. By Region
9. Macro Environment and Industry Structure
- 9.1. Supply Demand Analysis
- 9.2. Import Export Analysis
- 9.3. Value Chain Analysis
- 9.4. PESTEL Analysis
- 9.4.1. Political Factors
- 9.4.2. Economic System
- 9.4.3. Social Implications
- 9.4.4. Technological Advancements
- 9.4.5. Environmental Impacts
- 9.4.6. Legal Compliances and Regulatory Policies (Statutory Bodies Included)
- 9.5. Porter's Five Forces Analysis
- 9.5.1. Supplier Power
- 9.5.2. Buyer Power
- 9.5.3. Substitution Threat
- 9.5.4. Threat from New Entrant
- 9.5.5. Competitive Rivalry
10. Market Dynamics
- 10.1. Growth Drivers
- 10.2. Growth Inhibitors (Challenges and Restraints)
11. Key Players Landscape
- 11.1. Competition Matrix of Top Five Market Leaders
- 11.2. Market Revenue Analysis of Top Five Market Leaders (in %, 2022)
- 11.3. Mergers and Acquisitions/Joint Ventures (If Applicable)
- 11.4. SWOT Analysis (For Five Market Players)
- 11.5. Patent Analysis (If Applicable)
12. Pricing Analysis
13. Case Studies
14. Key Players Outlook
- 14.1. JAYANT AGRO-ORGANICS LIMITED
- 14.1.1. Company Details
- 14.1.2. Key Management Personnel
- 14.1.3. Products & Services
- 14.1.4. Financials (As reported)
- 14.1.5. Key Market Focus & Geographical Presence
- 14.1.6. Recent Developments
- 14.2. Gokulrefoil
- 14.3. Silverline Chemicals
- 14.4. N.K.Proteins Pvt Limited
- 14.5. Adani Group
- 14.6. Adya Oils & Chemicals Ltd.
- 14.7. BASF SE
- 14.8. Ambuja Solvex Pvt. Ltd.
- 14.9. Arkema
- 14.10. Connoils
Companies mentioned above DO NOT hold any order as per market share and can be changed as per information available during research work.

