|
|
市場調査レポート
商品コード
1389878
使い捨て手袋の世界市場:材料の種類別・製品種類別・用途別・最終用途産業別・地域別の評価、機会と予測 (2016年~2030年)Disposable Gloves Market Assessment, By Material Type, By Product Type, By Application, By End-use Industry, By Region, Opportunities, and Forecast, 2016-2030F |
||||||
|
|
|||||||
カスタマイズ可能
|
|||||||


| 使い捨て手袋の世界市場:材料の種類別・製品種類別・用途別・最終用途産業別・地域別の評価、機会と予測 (2016年~2030年) |
|
出版日: 2023年12月04日
発行: Markets & Data
ページ情報: 英文 208 Pages
納期: 3~5営業日
|

全表示
- 概要
- 図表
- 目次
世界の使い捨て手袋市場は、2022年に83億4,000万米ドルと評価され、2023年から2030年の予測期間中に7.7%のCAGRで成長し、2030年に151億米ドルに達すると予測されています。外科手術の増加や製造施設における使い捨て手袋の採用増加が、市場成長を促進する顕著な要素です。同様に、粉末付きの使い捨て手袋の新シリーズ開発のための最近のパートナーシップは、予測期間中に使い捨て手袋市場成長のための有利な可能性を作成します。
慢性疾患の有病率の増加、事故事例の増加、歯科手術の急増は、外科手術の成長につながる主な側面です。さらに、危険な職業における個人保護具の配備を義務付ける政府の規制や、労働災害事例の増加が、産業現場における使い捨て手袋の需要を押し上げています。したがって、外科手術の増加や作業員の安全対策が、有害物質への暴露を防ぎ、優れた衛生基準を確保するために使い捨て手袋の採用を後押ししており、これが市場の成長を後押ししています。とはいえ、使い捨て手袋の製造に関する厳しい欧州連合や各国レベルの基準が、市場成長の大きなボトルネックとなっています。
当レポートでは、世界の使い捨て手袋の市場について分析し、製品の概略や市場の基本構造、全体的な市場規模の動向見通し、セグメント別・地域別の詳細動向、市場の背景事情や主な影響要因、主要企業のプロファイル・市場シェアなどを調査しております。
目次
第1章 調査手法
第2章 プロジェクトの範囲と定義
第3章 エグゼクティブサマリー
第4章 顧客側の見解
- 市場認識と製品情報
- ブランドの認知度とロイヤルティ
- 購入意思決定時に考慮される要素
- 購入頻度
- 購入手段
第5章 使い捨て手袋市場の将来展望 (2016年~2030年)
- 市場規模と予測
- 金額ベース
- 数量ベース
- 材料の種類別
- 天然ゴムラテックス
- ニトリル
- ビニール
- ネオプレン
- ポリエステル
- ポリイソプレン
- その他
- 製品種類別
- 粉末付き
- 粉末無し
- 用途別
- 健康診断
- 部屋の清掃
- フードサービス
- その他
- 最終用途産業別
- インフラ整備
- 医療
- 食品・飲料
- 化学製品
- 石油・ガス
- その他
- 地域別
- 北米
- 欧州
- 南米
- アジア太平洋
- 中東・アフリカ
第6章 使い捨て手袋市場の将来展望:地域別 (2016年~2030年)
- 北米
- 市場規模と予測
- 金額ベース
- 数量ベース
- 材料の種類別
- 製品種類別
- 用途別
- 最終用途産業別
- 米国
- 市場規模と予測
- 材料の種類別
- 製品種類別
- 用途別
- 最終用途産業別
- カナダ
- メキシコ
- 市場規模と予測
各セグメントの情報は、対象となる全ての地域・国について提供されます。
- 欧州
- ドイツ
- フランス
- イタリア
- 英国
- ロシア
- オランダ
- スペイン
- トルコ
- ポーランド
- 南米
- ブラジル
- アルゼンチン
- アジア太平洋
- インド
- 中国
- 日本
- オーストラリア
- ベトナム
- 韓国
- インドネシア
- フィリピン
- 中東・アフリカ
- サウジアラビア
- アラブ首長国連邦
- 南アフリカ
第7章 供給サイド分析
- 生産能力:企業別
- 生産量:企業別
- 運用効率:企業別
- 主要工場の所在地 (第25位まで)
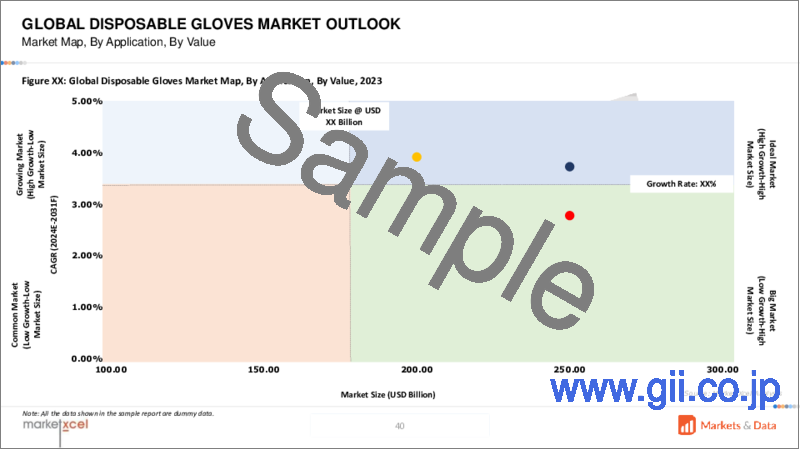
第8章 市場マッピング (2022年)
- 材料の種類別
- 製品種類別
- 用途別
- 最終用途産業別
- 地域別
第9章 マクロ環境と産業構造
- 需給分析
- 輸出入分析 (数量・金額ベース)
- サプライ/バリューチェーン分析
- PESTEL分析
- ポーターのファイブフォース分析
第10章 市場力学
- 成長促進要因
- 成長抑制要因 (課題、制約)
第11章 主要企業の情勢
- 市場リーダー上位5社:競合マトリックス
- 市場リーダー上位5社:市場収益分析 (%、2022年)
- 企業合併・買収 (M&A)/合弁事業 (該当する場合)
- SWOT分析 (市場参入企業5社の場合)
- 特許分析 (該当する場合)
第12章 価格分析
第13章 ケーススタディ
第14章 主要企業の見通し
- ANSELL LTD.
- 企業概要
- 経営幹部
- 製品・サービス
- 財務状況 (報告どおり)
- 重点市場と地理的プレゼンス
- 最近の動向
- Top Glove Corporation Bhd
- Unigloves (UK) Limited.
- Hartalega Holdings Berhad
- Safeskin Corporation (KCWW)
- Semperit AG Holding (Harps Holdings Sdn. Bhd.)
- Medline Industries, Inc.
- B. Braun SE
- MRK Healthcare Pvt. Ltd.
- The Glove Company
- Superior Glove.
上記企業は市場シェア順ではなく、調査作業中に入手した情報に従って変更される可能性があります。
第15章 戦略提言
第16章 Market Xcelについて、免責事項
List of Tables
- Table 1. Pricing Analysis of Products from Key Players
- Table 2. Competition Matrix of Top 5 Market Leaders
- Table 3. Mergers & Acquisitions/ Joint Ventures (If Applicable)
- Table 4. About Us - Regions and Countries Where We Have Executed Client Projects
List of Figures
- Figure 1. Global Disposable Gloves Market, By Value, In USD Billion, 2016-2030F
- Figure 2. Global Disposable Gloves Market, By Volume, In Kilotons, 2016-2030F
- Figure 3. Global Disposable Gloves Market Share, By Material Type, In USD Billion, 2016-2030F
- Figure 4. Global Disposable Gloves Market Share, By Product Type, In USD Billion, 2016-2030F
- Figure 5. Global Disposable Gloves Market Share, By Application, In USD Billion, 2016-2030F
- Figure 6. Global Disposable Gloves Market Share, By End-use Industry, In USD Billion, 2016-2030F
- Figure 7. Global Disposable Gloves Market Share, By Region, In USD Billion, 2016-2030F
- Figure 8. North America Disposable Gloves Market, By Value, In USD Billion, 2016-2030F
- Figure 9. North America Disposable Gloves Market, By Volume, In Kilotons, 2016-2030F
- Figure 10. North America Disposable Gloves Market Share, By Material Type, In USD Billion, 2016-2030F
- Figure 11. North America Disposable Gloves Market Share, By Product Type, In USD Billion, 2016-2030F
- Figure 12. North America Disposable Gloves Market Share, By Application, In USD Billion, 2016-2030F
- Figure 13. North America Disposable Gloves Market Share, By End-use Industry, In USD Billion, 2016-2030F
- Figure 14. North America Disposable Gloves Market Share, By Country, In USD Billion, 2016-2030F
- Figure 15. United States Disposable Gloves Market, By Value, In USD Billion, 2016-2030F
- Figure 16. United States Disposable Gloves Market, By Volume, In Kilotons, 2016-2030F
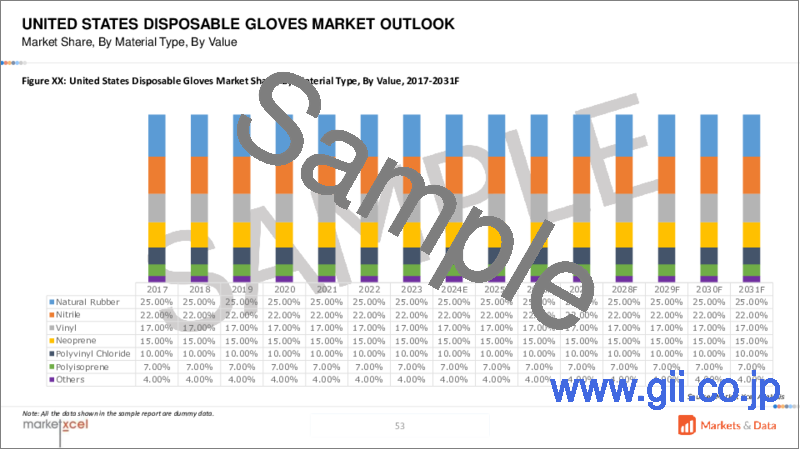
- Figure 17. United States Disposable Gloves Market Share, By Material Type, In USD Billion, 2016-2030F
- Figure 18. United States Disposable Gloves Market Share, By Product Type, In USD Billion, 2016-2030F
- Figure 19. United States Disposable Gloves Market Share, By Application, In USD Billion, 2016-2030F
- Figure 20. United States Disposable Gloves Market Share, By End-use Industry, In USD Billion, 2016-2030F
- Figure 21. Canada Disposable Gloves Market, By Value, In USD Billion, 2016-2030F
- Figure 22. Canada Disposable Gloves Market, By Volume, In Kilotons, 2016-2030F
- Figure 23. Canada Disposable Gloves Market Share, By Material Type, In USD Billion, 2016-2030F
- Figure 24. Canada Disposable Gloves Market Share, By Product Type, In USD Billion, 2016-2030F
- Figure 25. Canada Disposable Gloves Market Share, By Application, In USD Billion, 2016-2030F
- Figure 26. Canada Disposable Gloves Market Share, By End-use Industry, In USD Billion, 2016-2030F
- Figure 27. Mexico Disposable Gloves Market, By Value, In USD Billion, 2016-2030F
- Figure 28. Mexico Disposable Gloves Market, By Volume, In Kilotons, 2016-2030F
- Figure 29. Mexico Disposable Gloves Market Share, By Material Type, In USD Billion, 2016-2030F
- Figure 30. Mexico Disposable Gloves Market Share, By Product Type, In USD Billion, 2016-2030F
- Figure 31. Mexico Disposable Gloves Market Share, By Application, In USD Billion, 2016-2030F
- Figure 32. Mexico Disposable Gloves Market Share, By End-use Industry, In USD Billion, 2016-2030F
- Figure 33. Europe Disposable Gloves Market, By Value, In USD Billion, 2016-2030F
- Figure 34. Europe Disposable Gloves Market, By Volume, In Kilotons, 2016-2030F
- Figure 35. Europe Disposable Gloves Market Share, By Material Type, In USD Billion, 2016-2030F
- Figure 36. Europe Disposable Gloves Market Share, By Product Type, In USD Billion, 2016-2030F
- Figure 37. Europe Disposable Gloves Market Share, By Application, In USD Billion, 2016-2030F
- Figure 38. Europe Disposable Gloves Market Share, By End-use Industry, In USD Billion, 2016-2030F
- Figure 39. Europe Disposable Gloves Market Share, By Country, In USD Billion, 2016-2030F
- Figure 40. Germany Disposable Gloves Market, By Value, In USD Billion, 2016-2030F
- Figure 41. Germany Disposable Gloves Market, By Volume, In Kilotons, 2016-2030F
- Figure 42. Germany Disposable Gloves Market Share, By Material Type, In USD Billion, 2016-2030F
- Figure 43. Germany Disposable Gloves Market Share, By Product Type, In USD Billion, 2016-2030F
- Figure 44. Germany Disposable Gloves Market Share, By Application, In USD Billion, 2016-2030F
- Figure 45. Germany Disposable Gloves Market Share, By End-use Industry, In USD Billion, 2016-2030F
- Figure 46. France Disposable Gloves Market, By Value, In USD Billion, 2016-2030F
- Figure 47. France Disposable Gloves Market, By Volume, In Kilotons, 2016-2030F
- Figure 48. France Disposable Gloves Market Share, By Material Type, In USD Billion, 2016-2030F
- Figure 49. France Disposable Gloves Market Share, By Product Type, In USD Billion, 2016-2030F
- Figure 50. France Disposable Gloves Market Share, By Application, In USD Billion, 2016-2030F
- Figure 51. France Disposable Gloves Market Share, By End-use Industry, In USD Billion, 2016-2030F
- Figure 52. Italy Disposable Gloves Market, By Value, In USD Billion, 2016-2030F
- Figure 53. Italy Disposable Gloves Market, By Volume, In Kilotons, 2016-2030F
- Figure 54. Italy Disposable Gloves Market Share, By Material Type, In USD Billion, 2016-2030F
- Figure 55. Italy Disposable Gloves Market Share, By Product Type, In USD Billion, 2016-2030F
- Figure 56. Italy Disposable Gloves Market Share, By Application, In USD Billion, 2016-2030F
- Figure 57. Italy Disposable Gloves Market Share, By End-use Industry, In USD Billion, 2016-2030F
- Figure 58. United Kingdom Disposable Gloves Market, By Value, In USD Billion, 2016-2030F
- Figure 59. United Kingdom Disposable Gloves Market, By Volume, In Kilotons, 2016-2030F
- Figure 60. United Kingdom Disposable Gloves Market Share, By Material Type, In USD Billion, 2016-2030F
- Figure 61. United Kingdom Disposable Gloves Market Share, By Product Type, In USD Billion, 2016-2030F
- Figure 62. United Kingdom Disposable Gloves Market Share, By Application, In USD Billion, 2016-2030F
- Figure 63. United Kingdom Disposable Gloves Market Share, By End-use Industry, In USD Billion, 2016-2030F
- Figure 64. Russia Disposable Gloves Market, By Value, In USD Billion, 2016-2030F
- Figure 65. Russia Disposable Gloves Market, By Volume, In Kilotons, 2016-2030F
- Figure 66. Russia Disposable Gloves Market Share, By Material Type, In USD Billion, 2016-2030F
- Figure 67. Russia Disposable Gloves Market Share, By Product Type, In USD Billion, 2016-2030F
- Figure 68. Russia Disposable Gloves Market Share, By Application, In USD Billion, 2016-2030F
- Figure 69. Russia Disposable Gloves Market Share, By End-use Industry, In USD Billion, 2016-2030F
- Figure 70. Netherlands Disposable Gloves Market, By Value, In USD Billion, 2016-2030F
- Figure 71. Netherlands Disposable Gloves Market, By Volume, In Kilotons, 2016-2030F
- Figure 72. Netherlands Disposable Gloves Market Share, By Material Type, In USD Billion, 2016-2030F
- Figure 73. Netherlands Disposable Gloves Market Share, By Product Type, In USD Billion, 2016-2030F
- Figure 74. Netherlands Disposable Gloves Market Share, By Application, In USD Billion, 2016-2030F
- Figure 75. Netherlands Disposable Gloves Market Share, By End-use Industry, In USD Billion, 2016-2030F
- Figure 76. Spain Disposable Gloves Market, By Value, In USD Billion, 2016-2030F
- Figure 77. Spain Disposable Gloves Market, By Volume, In Kilotons, 2016-2030F
- Figure 78. Spain Disposable Gloves Market Share, By Material Type, In USD Billion, 2016-2030F
- Figure 79. Spain Disposable Gloves Market Share, By Product Type, In USD Billion, 2016-2030F
- Figure 80. Spain Disposable Gloves Market Share, By Application, In USD Billion, 2016-2030F
- Figure 81. Spain Disposable Gloves Market Share, By End-use Industry, In USD Billion, 2016-2030F
- Figure 82. Turkey Disposable Gloves Market, By Value, In USD Billion, 2016-2030F
- Figure 83. Turkey Disposable Gloves Market, By Volume, In Kilotons, 2016-2030F
- Figure 84. Turkey Disposable Gloves Market Share, By Material Type, In USD Billion, 2016-2030F
- Figure 85. Turkey Disposable Gloves Market Share, By Product Type, In USD Billion, 2016-2030F
- Figure 86. Turkey Disposable Gloves Market Share, By Application, In USD Billion, 2016-2030F
- Figure 87. Turkey Disposable Gloves Market Share, By End-use Industry, In USD Billion, 2016-2030F
- Figure 88. Poland Disposable Gloves Market, By Value, In USD Billion, 2016-2030F
- Figure 89. Poland Disposable Gloves Market, By Volume, In Kilotons, 2016-2030F
- Figure 90. Poland Disposable Gloves Market Share, By Material Type, In USD Billion, 2016-2030F
- Figure 91. Poland Disposable Gloves Market Share, By Product Type, In USD Billion, 2016-2030F
- Figure 92. Poland Disposable Gloves Market Share, By Application, In USD Billion, 2016-2030F
- Figure 93. Poland Disposable Gloves Market Share, By End-use Industry, In USD Billion, 2016-2030F
- Figure 94. South America Disposable Gloves Market, By Value, In USD Billion, 2016-2030F
- Figure 95. South America Disposable Gloves Market, By Volume, In Kilotons, 2016-2030F
- Figure 96. South America Disposable Gloves Market Share, By Material Type, In USD Billion, 2016-2030F
- Figure 97. South America Disposable Gloves Market Share, By Product Type, In USD Billion, 2016-2030F
- Figure 98. South America Disposable Gloves Market Share, By Application, In USD Billion, 2016-2030F
- Figure 99. South America Disposable Gloves Market Share, By End-use Industry, In USD Billion, 2016-2030F
- Figure 100. South America Disposable Gloves Market Share, By Country, In USD Billion, 2016-2030F
- Figure 101. Brazil Disposable Gloves Market, By Value, In USD Billion, 2016-2030F
- Figure 102. Brazil Disposable Gloves Market, By Volume, In Kilotons, 2016-2030F
- Figure 103. Brazil Disposable Gloves Market Share, By Material Type, In USD Billion, 2016-2030F
- Figure 104. Brazil Disposable Gloves Market Share, By Product Type, In USD Billion, 2016-2030F
- Figure 105. Brazil Disposable Gloves Market Share, By Application, In USD Billion, 2016-2030F
- Figure 106. Brazil Disposable Gloves Market Share, By End-use Industry, In USD Billion, 2016-2030F
- Figure 107. Argentina Disposable Gloves Market, By Value, In USD Billion, 2016-2030F
- Figure 108. Argentina Disposable Gloves Market, By Volume, In Kilotons, 2016-2030F
- Figure 109. Argentina Disposable Gloves Market Share, By Material Type, In USD Billion, 2016-2030F
- Figure 110. Argentina Disposable Gloves Market Share, By Product Type, In USD Billion, 2016-2030F
- Figure 111. Argentina Disposable Gloves Market Share, By Application, In USD Billion, 2016-2030F
- Figure 112. Argentina Disposable Gloves Market Share, By End-use Industry, In USD Billion, 2016-2030F
- Figure 113. Asia-Pacific Disposable Gloves Market, By Value, In USD Billion, 2016-2030F
- Figure 114. Asia-Pacific Disposable Gloves Market, By Volume, In Kilotons, 2016-2030F
- Figure 115. Asia-Pacific Disposable Gloves Market Share, By Material Type, In USD Billion, 2016-2030F
- Figure 116. Asia-Pacific Disposable Gloves Market Share, By Product Type, In USD Billion, 2016-2030F
- Figure 117. Asia-Pacific Disposable Gloves Market Share, By Application, In USD Billion, 2016-2030F
- Figure 118. Asia-Pacific Disposable Gloves Market Share, By End-use Industry, In USD Billion, 2016-2030F
- Figure 119. Asia-Pacific Disposable Gloves Market Share, By Country, In USD Billion, 2016-2030F
- Figure 120. India Disposable Gloves Market, By Value, In USD Billion, 2016-2030F
- Figure 121. India Disposable Gloves Market, By Volume, In Kilotons, 2016-2030F
- Figure 122. India Disposable Gloves Market Share, By Material Type, In USD Billion, 2016-2030F
- Figure 123. India Disposable Gloves Market Share, By Product Type, In USD Billion, 2016-2030F
- Figure 124. India Disposable Gloves Market Share, By Application, In USD Billion, 2016-2030F
- Figure 125. India Disposable Gloves Market Share, By End-use Industry, In USD Billion, 2016-2030F
- Figure 126. China Disposable Gloves Market, By Value, In USD Billion, 2016-2030F
- Figure 127. China Disposable Gloves Market, By Volume, In Kilotons, 2016-2030F
- Figure 128. China Disposable Gloves Market Share, By Material Type, In USD Billion, 2016-2030F
- Figure 129. China Disposable Gloves Market Share, By Product Type, In USD Billion, 2016-2030F
- Figure 130. China Disposable Gloves Market Share, By Application, In USD Billion, 2016-2030F
- Figure 131. China Disposable Gloves Market Share, By End-use Industry, In USD Billion, 2016-2030F
- Figure 132. Japan Disposable Gloves Market, By Value, In USD Billion, 2016-2030F
- Figure 133. Japan Disposable Gloves Market, By Volume, In Kilotons, 2016-2030F
- Figure 134. Japan Disposable Gloves Market Share, By Material Type, In USD Billion, 2016-2030F
- Figure 135. Japan Disposable Gloves Market Share, By Product Type, In USD Billion, 2016-2030F
- Figure 136. Japan Disposable Gloves Market Share, By Application, In USD Billion, 2016-2030F
- Figure 137. Japan Disposable Gloves Market Share, By End-use Industry, In USD Billion, 2016-2030F
- Figure 138. Australia Disposable Gloves Market, By Value, In USD Billion, 2016-2030F
- Figure 139. Australia Disposable Gloves Market, By Volume, In Kilotons, 2016-2030F
- Figure 140. Australia Disposable Gloves Market Share, By Material Type, In USD Billion, 2016-2030F
- Figure 141. Australia Disposable Gloves Market Share, By Product Type, In USD Billion, 2016-2030F
- Figure 142. Australia Disposable Gloves Market Share, By Application, In USD Billion, 2016-2030F
- Figure 143. Australia Disposable Gloves Market Share, By End-use Industry, In USD Billion, 2016-2030F
- Figure 144. Vietnam Disposable Gloves Market, By Value, In USD Billion, 2016-2030F
- Figure 145. Vietnam Disposable Gloves Market, By Volume, In Kilotons, 2016-2030F
- Figure 146. Vietnam Disposable Gloves Market Share, By Material Type, In USD Billion, 2016-2030F
- Figure 147. Vietnam Disposable Gloves Market Share, By Product Type, In USD Billion, 2016-2030F
- Figure 148. Vietnam Disposable Gloves Market Share, By Application, In USD Billion, 2016-2030F
- Figure 149. Vietnam Disposable Gloves Market Share, By End-use Industry, In USD Billion, 2016-2030F
- Figure 150. South Korea Disposable Gloves Market, By Value, In USD Billion, 2016-2030F
- Figure 151. South Korea Disposable Gloves Market, By Volume, In Kilotons, 2016-2030F
- Figure 152. South Korea Disposable Gloves Market Share, By Material Type, In USD Billion, 2016-2030F
- Figure 153. South Korea Disposable Gloves Market Share, By Product Type, In USD Billion, 2016-2030F
- Figure 154. South Korea Disposable Gloves Market Share, By Application, In USD Billion, 2016-2030F
- Figure 155. South Korea Disposable Gloves Market Share, By End-use Industry, In USD Billion, 2016-2030F
- Figure 156. Indonesia Disposable Gloves Market, By Value, In USD Billion, 2016-2030F
- Figure 157. Indonesia Disposable Gloves Market, By Volume, In Kilotons, 2016-2030F
- Figure 158. Indonesia Disposable Gloves Market Share, By Material Type, In USD Billion, 2016-2030F
- Figure 159. Indonesia Disposable Gloves Market Share, By Product Type, In USD Billion, 2016-2030F
- Figure 160. Indonesia Disposable Gloves Market Share, By Application, In USD Billion, 2016-2030F
- Figure 161. Indonesia Disposable Gloves Market Share, By End-use Industry, In USD Billion, 2016-2030F
- Figure 162. Philippines Disposable Gloves Market, By Value, In USD Billion, 2016-2030F
- Figure 163. Philippines Disposable Gloves Market, By Volume, In Kilotons, 2016-2030F
- Figure 164. Philippines Disposable Gloves Market Share, By Material Type, In USD Billion, 2016-2030F
- Figure 165. Philippines Disposable Gloves Market Share, By Product Type, In USD Billion, 2016-2030F
- Figure 166. Philippines Disposable Gloves Market Share, By Application, In USD Billion, 2016-2030F
- Figure 167. Philippines Disposable Gloves Market Share, By End-use Industry, In USD Billion, 2016-2030F
- Figure 168. Middle East & Africa Disposable Gloves Market, By Value, In USD Billion, 2016-2030F
- Figure 169. Middle East & Africa Disposable Gloves Market, By Volume, In Kilotons, 2016-2030F
- Figure 170. Middle East & Africa Disposable Gloves Market Share, By Material Type, In USD Billion, 2016-2030F
- Figure 171. Middle East & Africa Disposable Gloves Market Share, By Product Type, In USD Billion, 2016-2030F
- Figure 172. Middle East & Africa Disposable Gloves Market Share, By Application, In USD Billion, 2016-2030F
- Figure 173. Middle East & Africa Disposable Gloves Market Share, By End-use Industry, In USD Billion, 2016-2030F
- Figure 174. Middle East & Africa Disposable Gloves Market Share, By Country, In USD Billion, 2016-2030F
- Figure 175. Saudi Arabia Disposable Gloves Market, By Value, In USD Billion, 2016-2030F
- Figure 176. Saudi Arabia Disposable Gloves Market, By Volume, In Kilotons, 2016-2030F
- Figure 177. Saudi Arabia Disposable Gloves Market Share, By Material Type, In USD Billion, 2016-2030F
- Figure 178. Saudi Arabia Disposable Gloves Market Share, By Product Type, In USD Billion, 2016-2030F
- Figure 179. Saudi Arabia Disposable Gloves Market Share, By Application, In USD Billion, 2016-2030F
- Figure 180. Saudi Arabia Disposable Gloves Market Share, By End-use Industry, In USD Billion, 2016-2030F
- Figure 181. UAE Disposable Gloves Market, By Value, In USD Billion, 2016-2030F
- Figure 182. UAE Disposable Gloves Market, By Volume, In Kilotons, 2016-2030F
- Figure 183. UAE Disposable Gloves Market Share, By Material Type, In USD Billion, 2016-2030F
- Figure 184. UAE Disposable Gloves Market Share, By Product Type, In USD Billion, 2016-2030F
- Figure 185. UAE Disposable Gloves Market Share, By Application, In USD Billion, 2016-2030F
- Figure 186. UAE Disposable Gloves Market Share, By End-use Industry, In USD Billion, 2016-2030F
- Figure 187. South Africa Disposable Gloves Market, By Value, In USD Billion, 2016-2030F
- Figure 188. South Africa Disposable Gloves Market, By Volume, In Kilotons, 2016-2030F
- Figure 189. South Africa Disposable Gloves Market Share, By Material Type, In USD Billion, 2016-2030F
- Figure 190. South Africa Disposable Gloves Market Share, By Product Type, In USD Billion, 2016-2030F
- Figure 191. South Africa Disposable Gloves Market Share, By Application, In USD Billion, 2016-2030F
- Figure 192. South Africa Disposable Gloves Market Share, By End-use Industry, In USD Billion, 2016-2030F
- Figure 193. By Material Type Map-Market Size (USD Billion) & Growth Rate (%), 2022
- Figure 194. By Product Type Map-Market Size (USD Billion) & Growth Rate (%), 2022
- Figure 195. By Application Map-Market Size (USD Billion) & Growth Rate (%), 2022
- Figure 196. By End-use Industry Map-Market Size (USD Billion) & Growth Rate (%), 2022
- Figure 197. By Region Map-Market Size (USD Billion) & Growth Rate (%), 2022
Global Disposable Gloves Market was valued at USD 8.34 billion in 2022, expected to grow to USD 15.1 billion in 2030 with a CAGR of 7.7% during the forecast period between 2023 and 2030. The increasing surgical proceedings and the rising adoption of disposable gloves in manufacturing facilities are the prominent elements driving the market growth. Likewise, the recent partnerships for a new range of powdered disposable gloves development will create a lucrative potential for the disposable gloves market growth during the forecast period.
The increasing prevalence of chronic diseases, rising cases of accidents, and surging dental surgeries are the main aspects leading to the growth of surgical procedures. Moreover, the government regulations for the mandatory deployment of personal protection equipment in hazardous occupations and the increasing workplace accident cases are boosting the demand for disposable gloves in industrial settings. Therefore, the rising surgical procedures and the safety measures for workers are boosting the adoption of disposable gloves to prevent exposure to toxic substances & ensure superior hygiene standards, this, in turn, is propelling the market growth. Nevertheless, the stringent European Union and country-level standards for disposable gloves manufacturing are posing a major bottleneck for the market growth.
The Increasing Surgical Procedures is Driving the Demand for Disposable Gloves
The medical-grade disposable glove is a type of personal protection equipment utilized in surgical procedures to safeguard the wearer and the patient from spreading infection that causes illness during medical procedures. The increase in surgical procedures is accredited to variables, including the increasing prevalence of cardiovascular diseases and rising cosmetics surgeries.
For instance, according to the recent statistics published by the Organisation for Economic Co-operation and Development (OECD), in 2021, the total surgical proceedings in Turkey were 600,856, and in 2022, it was 725,908, an increase of 20.8%. As a result, the increase in surgical proceedings is fueling the demand for disposable gloves to prevent infection from spreading during operating procedures. As a result, an increase in surgical procedures is supplementing the market growth.
The Rising Adoption of Biodegradable Nitrile Gloves is Accelerating the Market Growth
The vital features of biodegradable nitrile disposable gloves include faster breakdown time and superior durability. As a result, the manufacturers of nitrile gloves are innovating in the biodegradable nitrile disposable gloves development to ensure superior sustainability as the industrial preference for eco-friendly materials & products is increasing.
For illustration, in June 2022, Eastwest Medico, a Denmark-based manufacturer of disposable gloves launched PROSENSO, a new range of biodegradable disposable nitrile gloves. The product is ideal for application in end-use industries such as healthcare and food & beverage. Hence, the recent launch of a new range of biodegradable disposable nitrile gloves is spurring the utilization of products to ensure a reduction in waste landfills due to disposable gloves, which, in turn, is augmenting the market growth.
Significant Share of North America in the Disposable Gloves Market
North American economy is driven by the recent advancements in the healthcare infrastructure, stringent measures to ensure workers' safety in the factories, and the major market players' presence in the region. Therefore, the demand for disposable gloves is increasing in the North America region, owing to the above factors.
For example, in July 2023, Nutex Health Inc. opened a new hospital in Louisiana, the United States. The hospital is spread across 21,000 square feet and has 8 private examination rooms, an emergency room, 10 private inpatient beds, an in-house imaging service, a pharmacy, and a laboratory. Henceforth, the launch of new hospitals in the North America region is driving the demand for disposable gloves for examination and surgical applications, thereby proliferating the disposable gloves market growth.
Future Outlook Scenario
The chemical industry growth in the coming years will drive the demand for disposable gloves to ensure protection from chemicals, thereby creating a favourable potential for market growth in the coming years. For example, according to the American Chemistry Council (ACC), the United States chemical industry will register a growth rate of 1.2% in 2024.
The development of hospital facilities is increasing due to the increasing government funding and the rising prevalence of cancer cases. For illustration, as of October 2023, about 40 government hospitals in the United Kingdom are in the development stages. The construction of the 40 hospitals will be completed by the end of 2030. Hence, the increase in hospital development will create a lucrative opportunity for the disposable gloves market size growth in the upcoming years.
The recent strategic collaborations for the expansion of disposable gloves production will boost the supply of gloves in gloves in the global market, which, in turn, will create a prominent growth outlook in the coming years. For instance, in March 2022, American Nitrile, LLC, a United States-based manufacturer of disposable gloves formed a strategic collaboration with Orion Infrastructure Capital to develop 12 production lines with a capacity of 3.6 billion nitrile gloves per annum.
Key Players Landscape and Outlook
The key market players with strong capabilities of disposable gloves production in bulk quantity include: ANSELL LTD., Top Glove Corporation Bhd, Unigloves (UK) Limited., and Hartalega Holdings Berhad. In recent years, companies have been adopting acquisition strategies to increase their revenue share in the global disposable gloves industry.
In December 2022, Harps Holdings Sdn. Bhd., a manufacturer of disposable gloves in Singapore, acquired the medical of Semperit AG Holding, including medical disposable gloves, for USD 122 million. The prime focus of Harps Holdings Sdn. Bhd. was to increase the disposable gloves product offering in the global market.
Table of Contents
1. Research Methodology
2. Project Scope & Definitions
3. Executive Summary
4. Voice of Customer
- 4.1. Market Awareness and Product Information
- 4.2. Brand Awareness and Loyalty
- 4.3. Factors Considered in Purchase Decision
- 4.3.1. Brand Name
- 4.3.2. Quality
- 4.3.3. Quantity
- 4.3.4. Price
- 4.3.5. Product Specification
- 4.3.6. Application Specification
- 4.3.7. Shelf Life
- 4.3.8. Availability of Product
- 4.4. Frequency of Purchase
- 4.5. Medium of Purchase
5. Disposable Gloves Market Outlook, 2016-2030F
- 5.1. Market Size & Forecast
- 5.1.1. By Value
- 5.1.2. By Volume
- 5.2. By Material Type
- 5.2.1. Natural Rubber Latex
- 5.2.2. Nitrile
- 5.2.3. Vinyl
- 5.2.4. Neoprene
- 5.2.5. Polyester
- 5.2.6. Polyisoprene
- 5.2.7. Others
- 5.3. By Product Type
- 5.3.1. Powdered
- 5.3.2. Non-powdered
- 5.4. By Application
- 5.4.1. Medical Examination
- 5.4.2. Cleaning Rooms
- 5.4.3. Food Services
- 5.4.4. Others
- 5.5. By End-use Industry
- 5.5.1. Infrastructure Development
- 5.5.2. Healthcare
- 5.5.3. Food & Beverage
- 5.5.4. Chemical
- 5.5.5. Oil & Gas
- 5.5.6. Others
- 5.6. By Region
- 5.6.1. North America
- 5.6.2. Europe
- 5.6.3. South America
- 5.6.4. Asia-Pacific
- 5.6.5. Middle East and Africa
6. Disposable Gloves Market Outlook, By Region, 2016-2030F
- 6.1. North America*
- 6.1.1. Market Size & Forecast
- 6.1.1.1. By Value
- 6.1.1.2. By Volume
- 6.1.2. By Material Type
- 6.1.2.1. Natural Rubber Latex
- 6.1.2.2. Nitrile
- 6.1.2.3. Vinyl
- 6.1.2.4. Neoprene
- 6.1.2.5. Polyester
- 6.1.2.6. Polyisoprene
- 6.1.2.7. Others
- 6.1.3. By Product Type
- 6.1.3.1. Powdered
- 6.1.3.2. Non-powdered
- 6.1.4. By Application
- 6.1.4.1. Medical Examination
- 6.1.4.2. Cleaning Rooms
- 6.1.4.3. Food Services
- 6.1.4.4. Others
- 6.1.5. By End-use Industry
- 6.1.5.1. Infrastructure Development
- 6.1.5.2. Healthcare
- 6.1.5.3. Food & Beverage
- 6.1.5.4. Chemical
- 6.1.5.5. Oil & Gas
- 6.1.5.6. Others
- 6.1.6. United States*
- 6.1.6.1. Market Size & Forecast
- 6.1.6.1.1. By Value
- 6.1.6.1.2. By Volume
- 6.1.6.2. By Material Type
- 6.1.6.2.1. Natural Rubber Latex
- 6.1.6.2.2. Nitrile
- 6.1.6.2.3. Vinyl
- 6.1.6.2.4. Neoprene
- 6.1.6.2.5. Polyester
- 6.1.6.2.6. Polyisoprene
- 6.1.6.2.7. Others
- 6.1.6.3. By Product Type
- 6.1.6.3.1. Powdered
- 6.1.6.3.2. Non-powdered
- 6.1.6.4. By Application
- 6.1.6.4.1. Medical Examination
- 6.1.6.4.2. Cleaning Rooms
- 6.1.6.4.3. Food Services
- 6.1.6.4.4. Others
- 6.1.6.5. By End-use Industry
- 6.1.6.5.1. Infrastructure Development
- 6.1.6.5.2. Healthcare
- 6.1.6.5.3. Food & Beverage
- 6.1.6.5.4. Chemical
- 6.1.6.5.5. Oil & Gas
- 6.1.6.5.6. Others
- 6.1.7. Canada
- 6.1.8. Mexico
- 6.1.1. Market Size & Forecast
All segments will be provided for all regions and countries covered:
- 6.2. Europe
- 6.2.1. Germany
- 6.2.2. France
- 6.2.3. Italy
- 6.2.4. United Kingdom
- 6.2.5. Russia
- 6.2.6. Netherlands
- 6.2.7. Spain
- 6.2.8. Turkey
- 6.2.9. Poland
- 6.3. South America
- 6.3.1. Brazil
- 6.3.2. Argentina
- 6.4. Asia-Pacific
- 6.4.1. India
- 6.4.2. China
- 6.4.3. Japan
- 6.4.4. Australia
- 6.4.5. Vietnam
- 6.4.6. South Korea
- 6.4.7. Indonesia
- 6.4.8. Philippines
- 6.5. Middle East & Africa
- 6.5.1. Saudi Arabia
- 6.5.2. UAE
- 6.5.3. South Africa
7. Supply Side Analysis
- 7.1. Capacity, By Company
- 7.2. Production, By Company
- 7.3. Operating Efficiency, By Company
- 7.4. Key Plant Locations (Up to 25)
8. Market Mapping, 2022
- 8.1. By Material Type
- 8.2. By Product Type
- 8.3. By Application
- 8.4. By End-use Industry
- 8.5. By Region
9. Macro Environment and Industry Structure
- 9.1. Supply Demand Analysis
- 9.2. Import Export Analysis - Volume and Value
- 9.3. Supply/Value Chain Analysis
- 9.4. PESTEL Analysis
- 9.4.1. Political Factors
- 9.4.2. Economic System
- 9.4.3. Social Implications
- 9.4.4. Technological Advancements
- 9.4.5. Environmental Impacts
- 9.4.6. Legal Compliances and Regulatory Policies (Statutory Bodies Included)
- 9.5. Porter's Five Forces Analysis
- 9.5.1. Supplier Power
- 9.5.2. Buyer Power
- 9.5.3. Substitution Threat
- 9.5.4. Threat from New Entrant
- 9.5.5. Competitive Rivalry
10. Market Dynamics
- 10.1. Growth Drivers
- 10.2. Growth Inhibitors (Challenges, Restraints)
11. Key Players Landscape
- 11.1. Competition Matrix of Top Five Market Leaders
- 11.2. Market Revenue Analysis of Top Five Market Leaders (in %, 2022)
- 11.3. Mergers and Acquisitions/Joint Ventures (If Applicable)
- 11.4. SWOT Analysis (For Five Market Players)
- 11.5. Patent Analysis (If Applicable)
12. Pricing Analysis
13. Case Studies
14. Key Players Outlook
- 14.1. ANSELL LTD.
- 14.1.1. Company Details
- 14.1.2. Key Management Personnel
- 14.1.3. Products & Services
- 14.1.4. Financials (As reported)
- 14.1.5. Key Market Focus & Geographical Presence
- 14.1.6. Recent Developments
- 14.2. Top Glove Corporation Bhd
- 14.3. Unigloves (UK) Limited.
- 14.4. Hartalega Holdings Berhad
- 14.5. Safeskin Corporation (KCWW)
- 14.6. Semperit AG Holding (Harps Holdings Sdn. Bhd.)
- 14.7. Medline Industries, Inc.
- 14.8. B. Braun SE
- 14.9. MRK Healthcare Pvt. Ltd.
- 14.10. The Glove Company
- 14.11. Superior Glove.
Companies mentioned above DO NOT hold any order as per market share and can be changed as per information available during research work.

