|
|
市場調査レポート
商品コード
1389873
業務用ディスプレイの世界市場:種類別 (デジタルサイネージ、モニター、インタラクティブディスプレイ)・技術別 (LED、液晶、OLED)・エンドユーザー別 (小売業、ホスピタリティ、エンターテインメント、医療、その他)・地域別の評価、機会と予測 (2016年~2030年)Commercial Display Market Assessment, By Type [Digital Signage, Monitors, Interactive Displays], By Technology [LED, LCD, OLED], By End-user [Retail, Hospitality, Entertainment, Healthcare, Others], By Region, Opportunities and Forecast, 2016-2030F |
||||||
|
|
|||||||
カスタマイズ可能
|
|||||||


| 業務用ディスプレイの世界市場:種類別 (デジタルサイネージ、モニター、インタラクティブディスプレイ)・技術別 (LED、液晶、OLED)・エンドユーザー別 (小売業、ホスピタリティ、エンターテインメント、医療、その他)・地域別の評価、機会と予測 (2016年~2030年) |
|
出版日: 2023年12月04日
発行: Market Xcel - Markets and Data
ページ情報: 英文 201 Pages
納期: 3~5営業日
|

- 全表示
- 概要
- 図表
- 目次
世界の業務用ディスプレイ市場は、近年大きな成長を遂げており、今後も力強い拡大ペースを維持すると予想されています。2022年の予測収益は約399億1,000万米ドルで、2023年から2030年までのCAGRは8.1%と堅調で、2030年には744億2,000万米ドルに達すると予測されています。
世界の業務用ディスプレイ市場は、業務用途に合わせた幅広いデジタルディスプレイ・ソリューションを包含するダイナミックな分野です。デジタルサイネージ、インタラクティブキオスク、ビデオウォール、業務用モニターなど、これらのディスプレイは、小売業、医療、ホスピタリティ、教育、企業など、さまざまな業界で幅広く使用されています。デジタルサイネージのような重要なコンポーネントは、現代の広告や情報発信において極めて重要な役割を果たし、小売店、空港、公共スペースなどで顧客エンゲージメントやブランド認知度を高めます。
ビデオウォールは、複数のスクリーンをシームレスに統合することで作成され、特にコントロールルームや娯楽施設において、データの視覚化、エンターテインメント、プロモーション活動に採用されています。タッチスクリーンパネルからインタラクティブキオスクまで、インタラクティブディスプレイは、教育、小売、企業環境において、インタラクティブな学習、セルフサービス取引、共同作業環境を可能にすることで、顧客体験に革命をもたらしています。さらに、OLED、4K、LEDなどのディスプレイ技術の進歩は、業務用ディスプレイの視覚的品質、エネルギー効率、柔軟性を高め続け、その普及を促進しています。企業がDXにますます注力するようになるにつれ、革新的なディスプレイソリューションへの需要が高まり、魅力的な顧客体験、効率的なコミュニケーション、データの可視化などのニーズが後押ししています。スマート技術の統合により、これらのディスプレイはよりインタラクティブになり、データ駆動型になり、特定の商業ニーズに合わせて調整されるようになり、世界の業務用ディスプレイ市場の継続的な成長と進化を確実なものにしています。
当レポートでは、世界の業務用ディスプレイの市場について分析し、製品の概略や市場の基本構造、全体的な市場規模の動向見通し、セグメント別・地域別の詳細動向、市場の背景事情や主な影響要因、主要企業のプロファイル・市場シェアなどを調査しております。
目次
第1章 調査手法
第2章 プロジェクトの範囲と定義
第3章 新型コロナウイルス感染症 (COVID-19) が世界の業務用ディスプレイ市場に与える影響
第4章 エグゼクティブサマリー
第5章 世界の業務用ディスプレイ市場の将来展望 (2016年~2030年)
- 市場規模と予測
- 金額ベース
- 数量ベース
- 種類別
- デジタルサイネージ
- モニター
- インタラクティブディスプレイ
- 技術別
- LED
- 液晶 (LCD)
- OLED
- エンドユーザー別
- 小売業
- ホスピタリティ
- エンターテインメント
- 医療
- その他
- 地域別
- 北米
- 欧州
- 南米
- アジア太平洋
- 中東・アフリカ
- 企業別市場シェア (%、2022年)
第6章 世界の業務用ディスプレイ市場の将来展望:地域別 (2016年~2030年)
- 北米
- 市場規模と予測
- 種類別
- 技術別
- エンドユーザー別
- 米国
- 市場規模と予測
- 種類別
- 技術別
- エンドユーザー別
- カナダ
- メキシコ
各セグメントの情報は、対象となる全ての地域・国について提供されます。
- 欧州
- ドイツ
- フランス
- イタリア
- 英国
- ロシア
- オランダ
- スペイン
- トルコ
- ポーランド
- 南米
- ブラジル
- アルゼンチン
- アジア太平洋
- インド
- 中国
- 日本
- オーストラリア
- ベトナム
- 韓国
- インドネシア
- フィリピン
- 中東・アフリカ
- サウジアラビア
- アラブ首長国連邦
- 南アフリカ
第7章 市場マッピング (2022年)
- 種類別
- 技術別
- エンドユーザー別
- 地域別
第8章 マクロ環境と産業構造
- 需給分析
- 輸出入分析
- バリューチェーン分析
- PESTEL分析
- ポーターのファイブフォース分析
第9章 市場力学
- 成長促進要因
- 成長抑制要因 (課題、制約)
第10章 主要企業の情勢
- 市場リーダー上位5社:競合マトリックス
- 市場リーダー上位5社:市場収益分析 (%、2022年)
- 企業合併・買収 (M&A)/合弁事業 (該当する場合)
- SWOT分析 (市場参入企業5社の場合)
- 特許分析 (該当する場合)
第11章 価格分析
第12章 ケーススタディ (該当する場合)
第13章 主要企業の見通し
- Samsung Electronics Co., Ltd.
- 企業概要
- 経営幹部
- 製品・サービス
- 財務状況 (報告どおり)
- 重点市場と地理的プレゼンス
- 最近の動向
- LG Corporation
- Panasonic Corporation
- Sony Group Corporation
- Hitachi, Ltd.
- Sharp Corporation
- BrightSign LLC
- ViewSonic Corporation
- NEC Corporation
- Planar Systems, Inc.
上記企業は市場シェア順ではなく、調査作業中に入手した情報に従って変更される可能性があります。
第14章 戦略提言
第15章 Market Xcelについて、免責事項
List of Tables
- Table 1. Pricing Analysis of Products from Key Players
- Table 2. Competition Matrix of Top 5 Market Leaders
- Table 3. Mergers & Acquisitions/ Joint Ventures (If Applicable)
- Table 4. About Us - Regions and Countries Where We Have Executed Client Projects
List of Figures
- Figure 1. Global Commercial Display Market, By Value, in USD Billion, 2016-2030F
- Figure 2. Global Commercial Display Market, By Volume, in Units, 2016-2030F
- Figure 3. Global Commercial Display Market Share, By Type, in USD Billion, 2016-2030F
- Figure 4. Global Commercial Display Market Share, By Technology, in USD Billion, 2016-2030F
- Figure 5. Global Commercial Display Market Share, By End-user, in USD Billion, 2016-2030F
- Figure 6. Global Commercial Display Market Share, By Region, in USD Billion, 2016-2030F
- Figure 7. North America Commercial Display Market, By Value, in USD Billion, 2016-2030F
- Figure 8. North America Commercial Display Market, By Volume, in Units, 2016-2030F
- Figure 9. North America Commercial Display Market Share, By Type, in USD Billion, 2016-2030F
- Figure 10. North America Commercial Display Market Share, By Technology, in USD Billion, 2016-2030F
- Figure 11. North America Commercial Display Market Share, By End-user, in USD Billion, 2016-2030F
- Figure 12. North America Commercial Display Market Share, By Country, in USD Billion, 2016-2030F
- Figure 13. United States Commercial Display Market, By Value, in USD Billion, 2016-2030F
- Figure 14. United States Commercial Display Market, By Volume, in Units, 2016-2030F
- Figure 15. United States Commercial Display Market Share, By Type, in USD Billion, 2016-2030F
- Figure 16. United States Commercial Display Market Share, By Technology, in USD Billion, 2016-2030F
- Figure 17. United States Commercial Display Market Share, By End-user, in USD Billion, 2016-2030F
- Figure 18. Canada Commercial Display Market, By Value, in USD Billion, 2016-2030F
- Figure 19. Canada Commercial Display Market, By Volume, in Units, 2016-2030F
- Figure 20. Canada Commercial Display Market Share, By Type, in USD Billion, 2016-2030F
- Figure 21. Canada Commercial Display Market Share, By Technology, in USD Billion, 2016-2030F
- Figure 22. Canada Commercial Display Market Share, By End-user, in USD Billion, 2016-2030F
- Figure 23. Mexico Commercial Display Market, By Value, in USD Billion, 2016-2030F
- Figure 24. Mexico Commercial Display Market, By Volume, in Units, 2016-2030F
- Figure 25. Mexico Commercial Display Market Share, By Type, in USD Billion, 2016-2030F
- Figure 26. Mexico Commercial Display Market Share, By Technology, in USD Billion, 2016-2030F
- Figure 27. Mexico Commercial Display Market Share, By End-user, in USD Billion, 2016-2030F
- Figure 28. Europe Commercial Display Market, By Value, in USD Billion, 2016-2030F
- Figure 29. Europe Commercial Display Market, By Volume, in Units, 2016-2030F
- Figure 30. Europe Commercial Display Market Share, By Type, in USD Billion, 2016-2030F
- Figure 31. Europe Commercial Display Market Share, By Technology, in USD Billion, 2016-2030F
- Figure 32. Europe Commercial Display Market Share, By End-user, in USD Billion, 2016-2030F
- Figure 33. Europe Commercial Display Market Share, By Country, in USD Billion, 2016-2030F
- Figure 34. Germany Commercial Display Market, By Value, in USD Billion, 2016-2030F
- Figure 35. Germany Commercial Display Market, By Volume, in Units, 2016-2030F
- Figure 36. Germany Commercial Display Market Share, By Type, in USD Billion, 2016-2030F
- Figure 37. Germany Commercial Display Market Share, By Technology, in USD Billion, 2016-2030F
- Figure 38. Germany Commercial Display Market Share, By End-user, in USD Billion, 2016-2030F
- Figure 39. France Commercial Display Market, By Value, in USD Billion, 2016-2030F
- Figure 40. France Commercial Display Market, By Volume, in Units, 2016-2030F
- Figure 41. France Commercial Display Market Share, By Type, in USD Billion, 2016-2030F
- Figure 42. France Commercial Display Market Share, By Technology, in USD Billion, 2016-2030F
- Figure 43. France Commercial Display Market Share, By End-user, in USD Billion, 2016-2030F
- Figure 44. Italy Commercial Display Market, By Value, in USD Billion, 2016-2030F
- Figure 45. Italy Commercial Display Market, By Volume, in Units, 2016-2030F
- Figure 46. Italy Commercial Display Market Share, By Type, in USD Billion, 2016-2030F
- Figure 47. Italy Commercial Display Market Share, By Technology, in USD Billion, 2016-2030F
- Figure 48. Italy Commercial Display Market Share, By End-user, in USD Billion, 2016-2030F
- Figure 49. United Kingdom Commercial Display Market, By Value, in USD Billion, 2016-2030F
- Figure 50. United Kingdom Commercial Display Market, By Volume, in Units, 2016-2030F
- Figure 51. United Kingdom Commercial Display Market Share, By Type, in USD Billion, 2016-2030F
- Figure 52. United Kingdom Commercial Display Market Share, By Technology, in USD Billion, 2016-2030F
- Figure 53. United Kingdom Commercial Display Market Share, By End-user, in USD Billion, 2016-2030F
- Figure 54. Russia Commercial Display Market, By Value, in USD Billion, 2016-2030F
- Figure 55. Russia Commercial Display Market, By Volume, in Units, 2016-2030F
- Figure 56. Russia Commercial Display Market Share, By Type, in USD Billion, 2016-2030F
- Figure 57. Russia Commercial Display Market Share, By Technology, in USD Billion, 2016-2030F
- Figure 58. Russia Commercial Display Market Share, By End-user, in USD Billion, 2016-2030F
- Figure 59. Netherlands Commercial Display Market, By Value, in USD Billion, 2016-2030F
- Figure 60. Netherlands Commercial Display Market, By Volume, in Units, 2016-2030F
- Figure 61. Netherlands Commercial Display Market Share, By Type, in USD Billion, 2016-2030F
- Figure 62. Netherlands Commercial Display Market Share, By Technology, in USD Billion, 2016-2030F
- Figure 63. Netherlands Commercial Display Market Share, By End-user, in USD Billion, 2016-2030F
- Figure 64. Spain Commercial Display Market, By Value, in USD Billion, 2016-2030F
- Figure 65. Spain Commercial Display Market, By Volume, in Units, 2016-2030F
- Figure 66. Spain Commercial Display Market Share, By Type, in USD Billion, 2016-2030F
- Figure 67. Spain Commercial Display Market Share, By Technology, in USD Billion, 2016-2030F
- Figure 68. Spain Commercial Display Market Share, By End-user, in USD Billion, 2016-2030F
- Figure 69. Turkey Commercial Display Market, By Value, in USD Billion, 2016-2030F
- Figure 70. Turkey Commercial Display Market, By Volume, in Units, 2016-2030F
- Figure 71. Turkey Commercial Display Market Share, By Type, in USD Billion, 2016-2030F
- Figure 72. Turkey Commercial Display Market Share, By Technology, in USD Billion, 2016-2030F
- Figure 73. Turkey Commercial Display Market Share, By End-user, in USD Billion, 2016-2030F
- Figure 74. Poland Commercial Display Market, By Value, in USD Billion, 2016-2030F
- Figure 75. Poland Commercial Display Market, By Volume, in Units, 2016-2030F
- Figure 76. Poland Commercial Display Market Share, By Type, in USD Billion, 2016-2030F
- Figure 77. Poland Commercial Display Market Share, By Technology, in USD Billion, 2016-2030F
- Figure 78. Poland Commercial Display Market Share, By End-user, in USD Billion, 2016-2030F
- Figure 79. South America Commercial Display Market, By Value, in USD Billion, 2016-2030F
- Figure 80. South America Commercial Display Market, By Volume, in Units, 2016-2030F
- Figure 81. South America Commercial Display Market Share, By Type, in USD Billion, 2016-2030F
- Figure 82. South America Commercial Display Market Share, By Technology, in USD Billion, 2016-2030F
- Figure 83. South America Commercial Display Market Share, By End-user, in USD Billion, 2016-2030F
- Figure 84. South America Commercial Display Market Share, By Country, in USD Billion, 2016-2030F
- Figure 85. Brazil Commercial Display Market, By Value, in USD Billion, 2016-2030F
- Figure 86. Brazil Commercial Display Market, By Volume, in Units, 2016-2030F
- Figure 87. Brazil Commercial Display Market Share, By Type, in USD Billion, 2016-2030F
- Figure 88. Brazil Commercial Display Market Share, By Technology, in USD Billion, 2016-2030F
- Figure 89. Brazil Commercial Display Market Share, By End-user, in USD Billion, 2016-2030F
- Figure 90. Argentina Commercial Display Market, By Value, in USD Billion, 2016-2030F
- Figure 91. Argentina Commercial Display Market, By Volume, in Units, 2016-2030F
- Figure 92. Argentina Commercial Display Market Share, By Type, in USD Billion, 2016-2030F
- Figure 93. Argentina Commercial Display Market Share, By Technology, in USD Billion, 2016-2030F
- Figure 94. Argentina Commercial Display Market Share, By End-user, in USD Billion, 2016-2030F
- Figure 95. Asia-Pacific Commercial Display Market, By Value, in USD Billion, 2016-2030F
- Figure 96. Asia-Pacific Commercial Display Market, By Volume, in Units, 2016-2030F
- Figure 97. Asia-Pacific Commercial Display Market Share, By Type, in USD Billion, 2016-2030F
- Figure 98. Asia-Pacific Commercial Display Market Share, By Technology, in USD Billion, 2016-2030F
- Figure 99. Asia-Pacific Commercial Display Market Share, By End-user, in USD Billion, 2016-2030F
- Figure 100. Asia-Pacific Commercial Display Market Share, By Country, in USD Billion, 2016-2030F
- Figure 101. India Commercial Display Market, By Value, in USD Billion, 2016-2030F
- Figure 102. India Commercial Display Market, By Volume, in Units, 2016-2030F
- Figure 103. India Commercial Display Market Share, By Type, in USD Billion, 2016-2030F
- Figure 104. India Commercial Display Market Share, By Technology, in USD Billion, 2016-2030F
- Figure 105. India Commercial Display Market Share, By End-user, in USD Billion, 2016-2030F
- Figure 106. China Commercial Display Market, By Value, in USD Billion, 2016-2030F
- Figure 107. China Commercial Display Market, By Volume, in Units, 2016-2030F
- Figure 108. China Commercial Display Market Share, By Type, in USD Billion, 2016-2030F
- Figure 109. China Commercial Display Market Share, By Technology, in USD Billion, 2016-2030F
- Figure 110. China Commercial Display Market Share, By End-user, in USD Billion, 2016-2030F
- Figure 111. Japan Commercial Display Market, By Value, in USD Billion, 2016-2030F
- Figure 112. Japan Commercial Display Market, By Volume, in Units, 2016-2030F
- Figure 113. Japan Commercial Display Market Share, By Type, in USD Billion, 2016-2030F
- Figure 114. Japan Commercial Display Market Share, By Technology, in USD Billion, 2016-2030F
- Figure 115. Japan Commercial Display Market Share, By End-user, in USD Billion, 2016-2030F
- Figure 116. Australia Commercial Display Market, By Value, in USD Billion, 2016-2030F
- Figure 117. Australia Commercial Display Market, By Volume, in Units, 2016-2030F
- Figure 118. Australia Commercial Display Market Share, By Type, in USD Billion, 2016-2030F
- Figure 119. Australia Commercial Display Market Share, By Technology, in USD Billion, 2016-2030F
- Figure 120. Australia Commercial Display Market Share, By End-user, in USD Billion, 2016-2030F
- Figure 121. Vietnam Commercial Display Market, By Value, in USD Billion, 2016-2030F
- Figure 122. Vietnam Commercial Display Market, By Volume, in Units, 2016-2030F
- Figure 123. Vietnam Commercial Display Market Share, By Type, in USD Billion, 2016-2030F
- Figure 124. Vietnam Commercial Display Market Share, By Technology, in USD Billion, 2016-2030F
- Figure 125. Vietnam Commercial Display Market Share, By End-user, in USD Billion, 2016-2030F
- Figure 126. South Korea Commercial Display Market, By Value, in USD Billion, 2016-2030F
- Figure 127. South Korea Commercial Display Market, By Volume, in Units, 2016-2030F
- Figure 128. South Korea Commercial Display Market Share, By Type, in USD Billion, 2016-2030F
- Figure 129. South Korea Commercial Display Market Share, By Technology, in USD Billion, 2016-2030F
- Figure 130. South Korea Commercial Display Market Share, By End-user, in USD Billion, 2016-2030F
- Figure 131. Indonesia Commercial Display Market, By Value, in USD Billion, 2016-2030F
- Figure 132. Indonesia Commercial Display Market, By Volume, in Units, 2016-2030F
- Figure 133. Indonesia Commercial Display Market Share, By Type, in USD Billion, 2016-2030F
- Figure 134. Indonesia Commercial Display Market Share, By Technology, in USD Billion, 2016-2030F
- Figure 135. Indonesia Commercial Display Market Share, By End-user, in USD Billion, 2016-2030F
- Figure 136. Philippines Commercial Display Market, By Value, in USD Billion, 2016-2030F
- Figure 137. Philippines Commercial Display Market, By Volume, in Units, 2016-2030F
- Figure 138. Philippines Commercial Display Market Share, By Type, in USD Billion, 2016-2030F
- Figure 139. Philippines Commercial Display Market Share, By Technology, in USD Billion, 2016-2030F
- Figure 140. Philippines Commercial Display Market Share, By End-user, in USD Billion, 2016-2030F
- Figure 141. Middle East & Africa Commercial Display Market, By Value, in USD Billion, 2016-2030F
- Figure 142. Middle East & Africa Commercial Display Market, By Volume, in Units, 2016-2030F
- Figure 143. Middle East & Africa Commercial Display Market Share, By Type, in USD Billion, 2016-2030F
- Figure 144. Middle East & Africa Commercial Display Market Share, By Technology, in USD Billion, 2016-2030F
- Figure 145. Middle East & Africa Commercial Display Market Share, By End-user, in USD Billion, 2016-2030F
- Figure 146. Middle East & Africa Commercial Display Market Share, By Country, in USD Billion, 2016-2030F
- Figure 147. Saudi Arabia Commercial Display Market, By Value, in USD Billion, 2016-2030F
- Figure 148. Saudi Arabia Commercial Display Market, By Volume, in Units, 2016-2030F
- Figure 149. Saudi Arabia Commercial Display Market Share, By Type, in USD Billion, 2016-2030F
- Figure 150. Saudi Arabia Commercial Display Market Share, By Technology, in USD Billion, 2016-2030F
- Figure 151. Saudi Arabia Commercial Display Market Share, By End-user, in USD Billion, 2016-2030F
- Figure 152. UAE Commercial Display Market, By Value, in USD Billion, 2016-2030F
- Figure 153. UAE Commercial Display Market, By Volume, in Units, 2016-2030F
- Figure 154. UAE Commercial Display Market Share, By Type, in USD Billion, 2016-2030F
- Figure 155. UAE Commercial Display Market Share, By Technology, in USD Billion, 2016-2030F
- Figure 156. UAE Commercial Display Market Share, By End-user, in USD Billion, 2016-2030F
- Figure 157. South Africa Commercial Display Market, By Value, in USD Billion, 2016-2030F
- Figure 158. South Africa Commercial Display Market, By Volume, in Units, 2016-2030F
- Figure 159. South Africa Commercial Display Market Share, By Type, in USD Billion, 2016-2030F
- Figure 160. South Africa Commercial Display Market Share, By Technology, in USD Billion, 2016-2030F
- Figure 161. South Africa Commercial Display Market Share, By End-user, in USD Billion, 2016-2030F
- Figure 162. By Type Map-Market Size (USD Billion) & Growth Rate (%), 2022
- Figure 163. By Technology Map-Market Size (USD Billion) & Growth Rate (%), 2022
- Figure 164. By End-user Map-Market Size (USD Billion) & Growth Rate (%), 2022
- Figure 165. By Region Map-Market Size (USD Billion) & Growth Rate (%), 2022
Global commercial display market has experienced significant growth in recent years and is expected to maintain a strong pace of expansion in the coming years. With projected revenue of approximately USD 39.91 billion in 2022, the market is forecasted to reach a value of USD 74.42 billion by 2030, displaying a robust CAGR of 8.1% from 2023 to 2030.
Global commercial display market is a dynamic sector encompassing a wide array of digital display solutions tailored for commercial applications. These displays, including digital signage, interactive kiosks, video walls, and professional-grade monitors, find extensive use across diverse industries such as retail, healthcare, hospitality, education, and corporate sectors. Key components like digital signage play a pivotal role in modern advertising and information dissemination, enhancing customer engagement and brand visibility in retail stores, airports, and public spaces.
Video walls are created by seamlessly integrating multiple screens, and are employed for data visualization, entertainment, and promotional activities, especially in control rooms and entertainment venues. Interactive displays, ranging from touchscreen panels to interactive kiosks, are revolutionizing customer experiences by enabling interactive learning, self-service transactions, and collaborative work environments in education, retail, and corporate settings. Moreover, advancements in display technologies, including OLED, 4K, and LED, continue to enhance the visual quality, energy efficiency, and flexibility of commercial displays, driving their adoption. As businesses increasingly focus on digital transformation, the demand for innovative display solutions rises, propelled by factors such as the need for engaging customer experiences, efficient communication, and data visualization. With the integration of smart technologies, these displays are becoming more interactive, data-driven, and tailored to specific commercial needs, ensuring the continuous growth and evolution of global commercial display market.
Expansion of Retail Industry Driving Commercial Display Market
The expansion of the retail industry is a significant driver behind the growth of the commercial display market. Retailers worldwide are leveraging advanced display technologies to create immersive and interactive customer shopping experiences. Digital signage, interactive kiosks, and video walls are widely adopted in retail spaces to showcase products, deliver targeted advertisements, and provide real-time information. These displays enhance customer engagement, influence purchasing decisions, and create a visually appealing store atmosphere. Retailers use digital displays for wayfinding and promoting exclusive offers, enhancing customer satisfaction and boosting sales. As the retail industry continues to expand globally, the demand for commercial displays is rising, making them an essential tool for modern retail environments. The ability of commercial displays to captivate consumers, deliver personalized content, and drive sales makes them indispensable for retailers seeking innovative ways to enhance the customer shopping journey and stay competitive in the market.
In August 2023, Avalue Technology, renowned for its comprehensive line of computing solutions, made the strategic decision to introduce a series of fresh color e-displays. The novel color e-paper display encompasses four dynamic color choices: black, red, white, and yellow. These displays feature vivid saturation and color vibrancy, rendering them exceptionally suitable for digital signage and promotional posters. Additionally, they incorporate an enhanced refresh rate, ensuring a smooth and uninterrupted reading experience. Furthermore, these displays have advanced features such as flash alert technology, which can effectively alert individuals to potential warnings or important notifications.
Increasing Smart Transportation Influencing Commercial Display Market
The rising integration of smart technologies in transportation systems significantly influences the commercial display market. Smart transportation solutions, including digital signage, interactive kiosks, and information displays, are becoming fundamental components in modern public transit hubs, airports, and train stations. These displays provide real-time travel information, wayfinding assistance, emergency notifications, and advertising opportunities. In smart buses and trains, interactive displays offer route details, schedules, and onboard amenities to enhance passenger experience.
Moreover, digital displays are instrumental in managing traffic flow and communicating essential information on highways and roads, contributing to overall transportation efficiency and safety. As cities globally invest in smart transportation infrastructure to improve urban mobility, the demand for commercial displays in these applications is soaring. Businesses are capitalizing on expanding smart transportation networks, deploying digital displays for passenger engagement, safety, and efficient operations. This trend enhances the passenger experience and drives the innovation and growth of the commercial display market.
For instance, in November 2021, E Ink, a leading digital paper technology provider, collaborated with TPV Technology, a manufacturer of PC monitors and LCD TVs, to create a 25.3-inch E Ink Spectra 3100 display specifically designed for applications in the transportation and retail sectors.
North America Dominates the Commercial Display Market
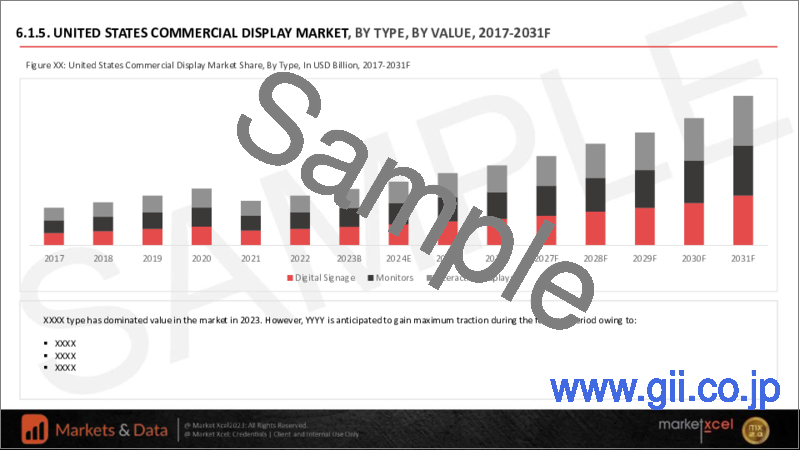
North America emerged as the market leader, boasting the highest revenue share in 2022. Key players like SAMSUNG and TCL North America have established strong regional customer bases, driving their market dominance. The region has witnessed widespread adoption of advanced display solutions across various sectors, further fueling the market growth. Specifically, the United States holds the largest market share in North America's commercial display market. Growing environmental concerns related to energy conservation have prompted the adoption of innovative display technologies like micro-LED and OLED, driving the demand for commercial displays in the United States. Furthermore, the region's proactive approach to significant advertising expenditure, aimed at launching products on a large scale due to intense market competition, has contributed significantly to the substantial market share held by the United States.
Government Initiatives
New European Union regulations are enforcing stringent energy efficient standards for displays from 2023. The regulations, part of an EU eco-design initiative, employ an energy efficiency index based on display size and luminance. While professional displays, like those used in digital signage, are exempt, these rules are expected to influence new product development in the business-to-business sector. The regulations, which cap energy consumption, present challenges for 8K displays as they consume more than double the energy of 4K counterparts. Manufacturers selling 8K devices will likely need to implement energy-saving presets to comply, potentially limiting the use of 8K capabilities. Samsung, a proponent of 8K TVs, plans to ship devices with default brightness-limiting eco modes, allowing users to switch to higher brightness settings, remaining within regulations' bounds.
The Indian government has introduced new regulations in 2023 allowing giant digital LED billboards to be installed across the city and state. The rules empower officials to review applications and address irregularities. These digital displays can be placed at various public locations like bridges, bus stands, parks, and railway stations. Licenses are valid for three years, with renewal required two years in advance. Printed displays can scroll with a dwell time of 10 seconds and a transition time of one second, but animated displays and moving videos are prohibited in busy areas. Design approval from local bodies is mandatory. Application fees for hoardings are USD 24.02 (INR 2,000) with a license fee of USD 72.07 (INR 6,000), which can be increased by up to 20% for LED or LCD advertisements.
Impact of COVID-19
The increased emphasis on automation and remote monitoring, driven by the need for social distancing and minimizing physical presence on factory floors, boosted the demand for commercial displays. Industries sought advanced displays to facilitate remote control, real-time data analysis, and predictive maintenance, which drove the market's recovery. Moreover, the healthcare sector's demand for medical grade displays surged due to the need for diagnostic equipment and telemedicine solutions. The pandemic underscored the importance of reliable display systems in healthcare, leading to increased investments in this sector. While the initial stages of the pandemic posed challenges to the commercial display market, the industry's adaptability and the increasing need for automation and remote monitoring solutions ultimately led to a rebound in demand, shaping the market's trajectory amidst the pandemic's challenges.
Key Players Landscape and Outlook
The commercial display market is witnessing a swift growth trajectory due to the increasing emphasis placed by companies worldwide on establishing advanced digital infrastructure. Furthermore, the market expansion is greatly facilitated by industrial automation, along with significant investments made by companies to enhance research and development resources, engage in collaboration projects, bolster marketing efforts, and expand distribution networks. These factors collectively contribute to the rapid expansion of the market.
In March 2022, Planar introduced two innovative LED video wall display lines tailored for dynamic events and areas with high ambient light: the Planar Luminate Pro Series and Planar Venue Pro Series. These families incorporate mechanical features that streamline the setup and dismantling processes for temporary and mobile events. Additionally, they offer full front installation and serviceability, making them suitable for both temporary setups and more enduring wall-mounted installations.
Table of Contents
1. Research Methodology
2. Project Scope & Definitions
3. Impact of COVID-19 on Global Commercial Display Market
4. Executive Summary
5. Global Commercial Display Market Outlook, 2016-2030F
- 5.1. Market Size & Forecast
- 5.1.1. By Value
- 5.1.2. By Volume
- 5.2. By Type
- 5.2.1. Digital Signage
- 5.2.2. Monitors
- 5.2.3. Interactive Displays
- 5.3. By Technology
- 5.3.1. LED
- 5.3.2. LCD
- 5.3.3. OLED
- 5.4. By End-user
- 5.4.1. Retail
- 5.4.2. Hospitality
- 5.4.3. Entertainment
- 5.4.4. Healthcare
- 5.4.5. Others
- 5.5. By Region
- 5.5.1. North America
- 5.5.2. Europe
- 5.5.3. South America
- 5.5.4. Asia-Pacific
- 5.5.5. Middle East and Africa
- 5.6. By Company Market Share (%), 2022
6. Global Commercial Display Market Outlook, By Region, 2016-2030F
- 6.1. North America*
- 6.1.1. Market Size & Forecast
- 6.1.1.1. By Value
- 6.1.1.2. By Volume
- 6.1.2. By Type
- 6.1.2.1. Digital Signage
- 6.1.2.2. Monitors
- 6.1.2.3. Interactive Displays
- 6.1.3. By Technology
- 6.1.3.1. LED
- 6.1.3.2. LCD
- 6.1.3.3. OLED
- 6.1.4. By End-user
- 6.1.4.1. Retail
- 6.1.4.2. Hospitality
- 6.1.4.3. Entertainment
- 6.1.4.4. Healthcare
- 6.1.4.5. Others
- 6.1.5. United States*
- 6.1.5.1. Market Size & Forecast
- 6.1.5.1.1. By Value
- 6.1.5.1.2. By Volume
- 6.1.5.2. By Type
- 6.1.5.2.1. Digital Signage
- 6.1.5.2.2. Monitors
- 6.1.5.2.3. Interactive Displays
- 6.1.5.3. By Technology
- 6.1.5.3.1. LED
- 6.1.5.3.2. LCD
- 6.1.5.3.3. OLED
- 6.1.5.4. By End-user
- 6.1.5.4.1. Retail
- 6.1.5.4.2. Hospitality
- 6.1.5.4.3. Entertainment
- 6.1.5.4.4. Healthcare
- 6.1.5.4.5. Others
- 6.1.6. Canada
- 6.1.7. Mexico
- 6.1.1. Market Size & Forecast
All segments will be provided for all regions and countries covered:
- 6.2. Europe
- 6.2.1. Germany
- 6.2.2. France
- 6.2.3. Italy
- 6.2.4. United Kingdom
- 6.2.5. Russia
- 6.2.6. Netherlands
- 6.2.7. Spain
- 6.2.8. Turkey
- 6.2.9. Poland
- 6.3. South America
- 6.3.1. Brazil
- 6.3.2. Argentina
- 6.4. Asia-Pacific
- 6.4.1. India
- 6.4.2. China
- 6.4.3. Japan
- 6.4.4. Australia
- 6.4.5. Vietnam
- 6.4.6. South Korea
- 6.4.7. Indonesia
- 6.4.8. Philippines
- 6.5. Middle East & Africa
- 6.5.1. Saudi Arabia
- 6.5.2. UAE
- 6.5.3. South Africa
7. Market Mapping, 2022
- 7.1. By Type
- 7.2. By Technology
- 7.3. By End-user
- 7.4. By Region
8. Macro Environment and Industry Structure
- 8.1. Supply Demand Analysis
- 8.2. Supply Chain Analysis
- 8.3. PESTEL Analysis
- 8.4. Porter's Five Forces Analysis
9. Market Dynamics
- 9.1. Growth Drivers
- 9.2. Growth Inhibitors (Challenges, Restraints)
10. Key Players Landscape
- 10.1. Competition Matrix of Top Five Market Leaders
- 10.2. Market Revenue Analysis of Top Five Market Leaders (in %, 2022)
- 10.3. Mergers and Acquisitions/Joint Ventures (If Applicable)
- 10.4. SWOT Analysis (For Five Market Players)
- 10.5. Patent Analysis (If Applicable)
11. Pricing Analysis
12. Case Studies (If applicable)
13. Key Players Outlook
- 13.1. Samsung Electronics Co., Ltd.
- 13.1.1. Company Details
- 13.1.2. Key Management Personnel
- 13.1.3. Products & Services
- 13.1.4. Financials (As reported)
- 13.1.5. Key Market Focus & Geographical Presence
- 13.1.6. Recent Developments
- 13.2. LG Corporation
- 13.3. Panasonic Corporation
- 13.4. Sony Group Corporation
- 13.5. Hitachi, Ltd.
- 13.6. Sharp Corporation
- 13.7. BrightSign LLC
- 13.8. ViewSonic Corporation
- 13.9. NEC Corporation
- 13.10. Planar Systems, Inc.
Companies mentioned above DO NOT hold any order as per market share and can be changed as per information available during research work.