|
|
市場調査レポート
商品コード
1388971
タイヤの世界市場:タイヤ別・車種別・タイヤの種類別・リムサイズ別・需要の種類別・流通チャネル別・地域別の評価、機会と予測 (2016年~2030年)Tyre Market Assessment, By Tyre, By Vehicle Type, By Tyre Type, By Rim Size, By Demand Type, By Distribution Channel, By Region, Opportunities and Forecast, 2016-2030F |
||||||
カスタマイズ可能
|
|||||||


| タイヤの世界市場:タイヤ別・車種別・タイヤの種類別・リムサイズ別・需要の種類別・流通チャネル別・地域別の評価、機会と予測 (2016年~2030年) |
|
出版日: 2023年12月01日
発行: Market Xcel - Markets and Data
ページ情報: 英文 516 Pages
納期: 3~5営業日
|

- 全表示
- 概要
- 図表
- 目次
世界のタイヤの市場規模は、2022年に2,612億9,000万米ドルと評価され、予測期間中 (2023年~2030年) に6.15%のCAGRで成長し、2030年には4,258億1,000万米ドルに達すると予測されています。タイヤ市場は近年著しい成長と進化を遂げています。いくつかの要因が新たな促進要因として浮上し、市場情勢を形成しています。インド、中国、日本、UAE、その他東南アジア諸国などの新興国における世界の自動車生産・販売台数の増加がタイヤ需要を促進しています。可処分所得の増加と都市化により自動車保有率が上昇し、交換用タイヤやアフターサービスの必要性が高まっています。また、持続可能性や環境への配慮が重視されるようになり、低燃費で環境に優しいタイヤへの需要が高まっています。二酸化炭素排出量削減を目的とした規制強化により、タイヤメーカーは研究開発に投資し、燃費を最適化し転がり抵抗を低減する革新的なタイヤ技術を導入しています。
さらに、最近のタイヤ市場の動向は、安全性・性能・耐久性の向上に重点を置いています。トラクション、マテリアルハンドリング、ウェットグリップを向上させるために、シリカベースの化合物などの先進的なタイヤ材料が利用されています。タイヤメーカーはまた、タイヤの状態をリアルタイムで監視し、全体的な性能と安全性を高めるために、センサーや接続機能などのスマート技術を取り入れています。また、SUV、電気自動車 (EV)、自律走行車など、特定の車種に特化したタイヤの開発も大きく進展しています。
全体として、タイヤ市場は消費者の要求の変化、技術の進歩、環境への配慮に対応して進化し続けています。安全性、性能、持続可能性、特殊タイヤソリューションへの注目は、今後さらなる技術革新を促し、市場の成長を促進すると予想されます。
当レポートでは、世界のタイヤの市場について分析し、製品の概略や市場の基本構造、全体的な市場規模の動向見通し、セグメント別・地域別の詳細動向、市場の背景事情や主な影響要因、主要企業のプロファイル・市場シェアなどを調査しております。
目次
第1章 調査手法
第2章 プロジェクトの範囲と定義
第3章 新型コロナウイルス感染症 (COVID-19) が世界のタイヤ市場に与える影響
第4章 ロシア・ウクライナ戦争の影響
第5章 エグゼクティブサマリー
第6章 顧客側の見解
- 消費者回答者の人口統計
- タイヤの種類
- 推奨タイヤブランド
- タイヤ交換
- 購入の決定要因
- 購入手段
- パフォーマンス属性
- タイヤの寿命
- 持続可能性とエコフレンドリーなタイヤ
- 近い将来の技術進歩
第7章 タイヤ市場の将来展望 (2016年~2030年)
- 市場規模と予測
- 金額ベース
- 数量ベース
- タイヤ別
- 冬用タイヤ
- 夏用タイヤ
- オールシーズンタイヤ
- 車種別
- 乗用車
- 二輪車
- 三輪車
- 四輪車
- 商用車
- 小型商用車 (LCV)
- 中型・大型商用車 (MCV・HCV)
- オフロード車
- 農業
- 鉱業・建設業
- その他
- 乗用車
- タイヤの種類別
- ラジアル
- バイアス
- リムサイズ別
- 20インチ以下
- 20インチ以上
- 需要の種類別
- 新品 (OEM)
- 交換品
- 流通チャネル別
- OEM (相手先商標製品製造業者)
- マルチブランド流通業者
- 単一ブランド流通業者
- オンライン
- 地域別
- 北米
- 欧州
- 南米
- アジア太平洋
- 中東・アフリカ
- 企業別市場シェア (%、2022年)
第8章 タイヤ市場の将来展望:地域別 (2016年~2030年)
- 北米*
- タイヤ別
- 車種別
- タイヤの種類別
- リムサイズ別
- 需要の種類別
- 流通チャネル別
- 米国*
- タイヤ別
- 車種別
- タイヤの種類別
- リムサイズ別
- 需要の種類別
- 流通チャネル別
- カナダ
- メキシコ
各セグメントの情報は、対象となる全ての地域・国について提供されます。
- 欧州
- ドイツ
- フランス
- イタリア
- 英国
- ロシア
- オランダ
- スペイン
- トルコ
- ポーランド
- 南米
- ブラジル
- アルゼンチン
- アジア太平洋
- インド
- 中国
- 日本
- オーストラリア
- ベトナム
- 韓国
- インドネシア
- フィリピン
- 中東・アフリカ
- サウジアラビア
- アラブ首長国連邦
- 南アフリカ
第9章 市場マッピング (2022年)
- タイヤ別
- 車種別
- タイヤの種類別
- リムサイズ別
- 需要の種類別
- 流通チャネル別
- 地域別
第10章 マクロ環境と産業構造
- 需給分析
- 輸出入分析 (数量・金額ベース)
- サプライ/バリューチェーン分析
- PESTEL分析
- ポーターのファイブフォース分析
第11章 市場力学
- 成長促進要因
- 成長抑制要因 (課題、制約)
第12章 主要企業の情勢
- 市場リーダー上位5社:競合マトリックス
- 市場リーダー上位5社:市場収益分析 (%、2022年)
- 企業合併・買収 (M&A)/合弁事業 (該当する場合)
- SWOT分析 (市場参入企業5社の場合)
- 特許分析 (該当する場合)
第13章 価格分析
第14章 ケーススタディ
第15章 主要企業の見通し
- Bridgestone Corporation
- 企業概要
- 経営幹部
- 製品・サービス
- 財務状況 (報告どおり)
- 重点市場と地理的プレゼンス
- 最近の動向
- Michelin
- Continental AG
- Goodyear Tyre &Rubber Company
- Pirelli &C. SpA.
- Sumitomo Rubber Industries, Ltd.
- Hankook Tyre &Technology Co., Ltd.
- Yokohama Rubber Company, Limited
- Hangzhou Zhongce Rubber Co., Ltd.
- Toyo Tyre Corporation
上記企業は市場シェア順ではなく、調査作業中に入手した情報に従って変更される可能性があります。
第16章 戦略提言
第17章 Market Xcelについて、免責事項
List of Tables
- Table 1. Pricing Analysis of Products from Key Players
- Table 2. Competition Matrix of Top 5 Market Leaders
- Table 3. Mergers & Acquisitions/ Joint Ventures (If Applicable)
- Table 4. About Us - Regions and Countries Where We Have Executed Client Projects
List of Figures
- Figure 1. Global Tyre Market, By Value, In USD Billion, 2016-2030F
- Figure 2. Global Tyre Market, By Volume, In Million Tyres, 2016-2030F
- Figure 3. Global Tyre Market Share, By Tyre, In USD Billion, 2016-2030F
- Figure 4. Global Tyre Market Share, By Vehicle Type, In USD Billion, 2016-2030F
- Figure 5. Global Tyre Market Share, By Tyre Type, In USD Billion, 2016-2030F
- Figure 6. Global Tyre Market Share, By Rim Size, In USD Billion, 2016-2030F
- Figure 7. Global Tyre Market Share, By Demand Type, In USD Billion, 2016-2030F
- Figure 8. Global Tyre Market Share, By Distribution Channel, In USD Billion, 2016-2030F
- Figure 9. Global Tyre Market Share, By Region, In USD Billion, 2016-2030F
- Figure 10. North America Tyre Market, By Value, In USD Billion, 2016-2030F
- Figure 11. North America Tyre Market, By Volume, In Million Tyres, 2016-2030F
- Figure 12. North America Tyre Market Share, By Tyre, In USD Billion, 2016-2030F
- Figure 13. North America Tyre Market Share, By Vehicle Type, In USD Billion, 2016-2030F
- Figure 14. North America Tyre Market Share, By Tyre Type, In USD Billion, 2016-2030F
- Figure 15. North America Tyre Market Share, By Rim Size, In USD Billion, 2016-2030F
- Figure 16. North America Tyre Market Share, By Demand Type, In USD Billion, 2016-2030F
- Figure 17. North America Tyre Market Share, By Distribution Channel, In USD Billion, 2016-2030F
- Figure 18. North America Tyre Market Share, By Country, In USD Billion, 2016-2030F
- Figure 19. United States Tyre Market, By Value, In USD Billion, 2016-2030F
- Figure 20. United States Tyre Market, By Volume, In Million Tyres, 2016-2030F
- Figure 21. United States Tyre Market Share, By Tyre, In USD Billion, 2016-2030F
- Figure 22. United States Tyre Market Share, By Vehicle Type, In USD Billion, 2016-2030F
- Figure 23. United States Tyre Market Share, By Tyre Type, In USD Billion, 2016-2030F
- Figure 24. United States Tyre Market Share, By Rim Size, In USD Billion, 2016-2030F
- Figure 25. United States Tyre Market Share, By Demand Type, In USD Billion, 2016-2030F
- Figure 26. United States Tyre Market Share, By Distribution Channel, In USD Billion, 2016-2030F
- Figure 27. Canada Tyre Market, By Value, In USD Billion, 2016-2030F
- Figure 28. Canada Tyre Market, By Volume, In Million Tyres, 2016-2030F
- Figure 29. Canada Tyre Market Share, By Tyre, In USD Billion, 2016-2030F
- Figure 30. Canada Tyre Market Share, By Vehicle Type, In USD Billion, 2016-2030F
- Figure 31. Canada Tyre Market Share, By Tyre Type, In USD Billion, 2016-2030F
- Figure 32. Canada Tyre Market Share, By Rim Size, In USD Billion, 2016-2030F
- Figure 33. Canada Tyre Market Share, By Demand Type, In USD Billion, 2016-2030F
- Figure 34. Canada Tyre Market Share, By Distribution Channel, In USD Billion, 2016-2030F
- Figure 35. Mexico Tyre Market, By Value, In USD Billion, 2016-2030F
- Figure 36. Mexico Tyre Market, By Volume, In Million Tyres, 2016-2030F
- Figure 37. Mexico Tyre Market Share, By Tyre, In USD Billion, 2016-2030F
- Figure 38. Mexico Tyre Market Share, By Vehicle Type, In USD Billion, 2016-2030F
- Figure 39. Mexico Tyre Market Share, By Tyre Type, In USD Billion, 2016-2030F
- Figure 40. Mexico Tyre Market Share, By Rim Size, In USD Billion, 2016-2030F
- Figure 41. Mexico Tyre Market Share, By Demand Type, In USD Billion, 2016-2030F
- Figure 42. Mexico Tyre Market Share, By Distribution Channel, In USD Billion, 2016-2030F
- Figure 43. Europe Tyre Market, By Value, In USD Billion, 2016-2030F
- Figure 44. Europe Tyre Market, By Volume, In Million Tyres, 2016-2030F
- Figure 45. Europe Tyre Market Share, By Tyre, In USD Billion, 2016-2030F
- Figure 46. Europe Tyre Market Share, By Vehicle Type, In USD Billion, 2016-2030F
- Figure 47. Europe Tyre Market Share, By Tyre Type, In USD Billion, 2016-2030F
- Figure 48. Europe Tyre Market Share, By Rim Size, In USD Billion, 2016-2030F
- Figure 49. Europe Tyre Market Share, By Demand Type, In USD Billion, 2016-2030F
- Figure 50. Europe Tyre Market Share, By Distribution Channel, In USD Billion, 2016-2030F
- Figure 51. Europe Tyre Market Share, By Country, In USD Billion, 2016-2030F
- Figure 52. Germany Tyre Market, By Value, In USD Billion, 2016-2030F
- Figure 53. Germany Tyre Market, By Volume, In Million Tyres, 2016-2030F
- Figure 54. Germany Tyre Market Share, By Tyre, In USD Billion, 2016-2030F
- Figure 55. Germany Tyre Market Share, By Vehicle Type, In USD Billion, 2016-2030F
- Figure 56. Germany Tyre Market Share, By Tyre Type, In USD Billion, 2016-2030F
- Figure 57. Germany Tyre Market Share, By Rim Size, In USD Billion, 2016-2030F
- Figure 58. Germany Tyre Market Share, By Demand Type, In USD Billion, 2016-2030F
- Figure 59. Germany Tyre Market Share, By Distribution Channel, In USD Billion, 2016-2030F
- Figure 60. France Tyre Market, By Value, In USD Billion, 2016-2030F
- Figure 61. France Tyre Market, By Volume, In Million Tyres, 2016-2030F
- Figure 62. France Tyre Market Share, By Tyre, In USD Billion, 2016-2030F
- Figure 63. France Tyre Market Share, By Vehicle Type, In USD Billion, 2016-2030F
- Figure 64. France Tyre Market Share, By Tyre Type, In USD Billion, 2016-2030F
- Figure 65. France Tyre Market Share, By Rim Size, In USD Billion, 2016-2030F
- Figure 66. France Tyre Market Share, By Demand Type, In USD Billion, 2016-2030F
- Figure 67. France Tyre Market Share, By Distribution Channel, In USD Billion, 2016-2030F
- Figure 68. Italy Tyre Market, By Value, In USD Billion, 2016-2030F
- Figure 69. Italy Tyre Market, By Volume, In Million Tyres, 2016-2030F
- Figure 70. Italy Tyre Market Share, By Tyre, In USD Billion, 2016-2030F
- Figure 71. Italy Tyre Market Share, By Vehicle Type, In USD Billion, 2016-2030F
- Figure 72. Italy Tyre Market Share, By Tyre Type, In USD Billion, 2016-2030F
- Figure 73. Italy Tyre Market Share, By Rim Size, In USD Billion, 2016-2030F
- Figure 74. Italy Tyre Market Share, By Demand Type, In USD Billion, 2016-2030F
- Figure 75. Italy Tyre Market Share, By Distribution Channel, In USD Billion, 2016-2030F
- Figure 76. United Kingdom Tyre Market, By Value, In USD Billion, 2016-2030F
- Figure 77. United Kingdom Tyre Market, By Volume, In Million Tyres, 2016-2030F
- Figure 78. United Kingdom Tyre Market Share, By Tyre, In USD Billion, 2016-2030F
- Figure 79. United Kingdom Tyre Market Share, By Vehicle Type, In USD Billion, 2016-2030F
- Figure 80. United Kingdom Tyre Market Share, By Tyre Type, In USD Billion, 2016-2030F
- Figure 81. United Kingdom Tyre Market Share, By Rim Size, In USD Billion, 2016-2030F
- Figure 82. United Kingdom Tyre Market Share, By Demand Type, In USD Billion, 2016-2030F
- Figure 83. United Kingdom Tyre Market Share, By Distribution Channel, In USD Billion, 2016-2030F
- Figure 84. Russia Tyre Market, By Value, In USD Billion, 2016-2030F
- Figure 85. Russia Tyre Market, By Volume, In Million Tyres, 2016-2030F
- Figure 86. Russia Tyre Market Share, By Tyre, In USD Billion, 2016-2030F
- Figure 87. Russia Tyre Market Share, By Vehicle Type, In USD Billion, 2016-2030F
- Figure 88. Russia Tyre Market Share, By Tyre Type, In USD Billion, 2016-2030F
- Figure 89. Russia Tyre Market Share, By Rim Size, In USD Billion, 2016-2030F
- Figure 90. Russia Tyre Market Share, By Demand Type, In USD Billion, 2016-2030F
- Figure 91. Russia Tyre Market Share, By Distribution Channel, In USD Billion, 2016-2030F
- Figure 92. Netherlands Tyre Market, By Value, In USD Billion, 2016-2030F
- Figure 93. Netherlands Tyre Market, By Volume, In Million Tyres, 2016-2030F
- Figure 94. Netherlands Tyre Market Share, By Tyre, In USD Billion, 2016-2030F
- Figure 95. Netherlands Tyre Market Share, By Vehicle Type, In USD Billion, 2016-2030F
- Figure 96. Netherlands Tyre Market Share, By Tyre Type, In USD Billion, 2016-2030F
- Figure 97. Netherlands Tyre Market Share, By Rim Size, In USD Billion, 2016-2030F
- Figure 98. Netherlands Tyre Market Share, By Demand Type, In USD Billion, 2016-2030F
- Figure 99. Netherlands Tyre Market Share, By Distribution Channel, In USD Billion, 2016-2030F
- Figure 100. Spain Tyre Market, By Value, In USD Billion, 2016-2030F
- Figure 101. Spain Tyre Market, By Volume, In Million Tyres, 2016-2030F
- Figure 102. Spain Tyre Market Share, By Tyre, In USD Billion, 2016-2030F
- Figure 103. Spain Tyre Market Share, By Vehicle Type, In USD Billion, 2016-2030F
- Figure 104. Spain Tyre Market Share, By Tyre Type, In USD Billion, 2016-2030F
- Figure 105. Spain Tyre Market Share, By Rim Size, In USD Billion, 2016-2030F
- Figure 106. Spain Tyre Market Share, By Demand Type, In USD Billion, 2016-2030F
- Figure 107. Spain Tyre Market Share, By Distribution Channel, In USD Billion, 2016-2030F
- Figure 108. Turkey Tyre Market, By Value, In USD Billion, 2016-2030F
- Figure 109. Turkey Tyre Market, By Volume, In Million Tyres, 2016-2030F
- Figure 110. Turkey Tyre Market Share, By Tyre, In USD Billion, 2016-2030F
- Figure 111. Turkey Tyre Market Share, By Vehicle Type, In USD Billion, 2016-2030F
- Figure 112. Turkey Tyre Market Share, By Tyre Type, In USD Billion, 2016-2030F
- Figure 113. Turkey Tyre Market Share, By Rim Size, In USD Billion, 2016-2030F
- Figure 114. Turkey Tyre Market Share, By Demand Type, In USD Billion, 2016-2030F
- Figure 115. Turkey Tyre Market Share, By Distribution Channel, In USD Billion, 2016-2030F
- Figure 116. Poland Tyre Market, By Value, In USD Billion, 2016-2030F
- Figure 117. Poland Tyre Market, By Volume, In Million Tyres, 2016-2030F
- Figure 118. Poland Tyre Market Share, By Tyre, In USD Billion, 2016-2030F
- Figure 119. Poland Tyre Market Share, By Vehicle Type, In USD Billion, 2016-2030F
- Figure 120. Poland Tyre Market Share, By Tyre Type, In USD Billion, 2016-2030F
- Figure 121. Poland Tyre Market Share, By Rim Size, In USD Billion, 2016-2030F
- Figure 122. Poland Tyre Market Share, By Demand Type, In USD Billion, 2016-2030F
- Figure 123. Poland Tyre Market Share, By Distribution Channel, In USD Billion, 2016-2030F
- Figure 124. South America Tyre Market, By Value, In USD Billion, 2016-2030F
- Figure 125. South America Tyre Market, By Volume, In Million Tyres, 2016-2030F
- Figure 126. South America Tyre Market Share, By Tyre, In USD Billion, 2016-2030F
- Figure 127. South America Tyre Market Share, By Vehicle Type, In USD Billion, 2016-2030F
- Figure 128. South America Tyre Market Share, By Tyre Type, In USD Billion, 2016-2030F
- Figure 129. South America Tyre Market Share, By Rim Size, In USD Billion, 2016-2030F
- Figure 130. South America Tyre Market Share, By Demand Type, In USD Billion, 2016-2030F
- Figure 131. South America Tyre Market Share, By Distribution Channel, In USD Billion, 2016-2030F
- Figure 132. South America Tyre Market Share, By Country, In USD Billion, 2016-2030F
- Figure 133. Brazil Tyre Market, By Value, In USD Billion, 2016-2030F
- Figure 134. Brazil Tyre Market, By Volume, In Million Tyres, 2016-2030F
- Figure 135. Brazil Tyre Market Share, By Tyre, In USD Billion, 2016-2030F
- Figure 136. Brazil Tyre Market Share, By Vehicle Type, In USD Billion, 2016-2030F
- Figure 137. Brazil Tyre Market Share, By Tyre Type, In USD Billion, 2016-2030F
- Figure 138. Brazil Tyre Market Share, By Rim Size, In USD Billion, 2016-2030F
- Figure 139. Brazil Tyre Market Share, By Demand Type, In USD Billion, 2016-2030F
- Figure 140. Brazil Tyre Market Share, By Distribution Channel, In USD Billion, 2016-2030F
- Figure 141. Argentina Tyre Market, By Value, In USD Billion, 2016-2030F
- Figure 142. Argentina Tyre Market, By Volume, In Million Tyres, 2016-2030F
- Figure 143. Argentina Tyre Market Share, By Tyre, In USD Billion, 2016-2030F
- Figure 144. Argentina Tyre Market Share, By Vehicle Type, In USD Billion, 2016-2030F
- Figure 145. Argentina Tyre Market Share, By Tyre Type, In USD Billion, 2016-2030F
- Figure 146. Argentina Tyre Market Share, By Rim Size, In USD Billion, 2016-2030F
- Figure 147. Argentina Tyre Market Share, By Demand Type, In USD Billion, 2016-2030F
- Figure 148. Argentina Tyre Market Share, By Distribution Channel, In USD Billion, 2016-2030F
- Figure 149. Asia-Pacific Tyre Market, By Value, In USD Billion, 2016-2030F
- Figure 150. Asia-Pacific Tyre Market, By Volume, In Million Tyres, 2016-2030F
- Figure 151. Asia-Pacific Tyre Market Share, By Tyre, In USD Billion, 2016-2030F
- Figure 152. Asia-Pacific Tyre Market Share, By Vehicle Type, In USD Billion, 2016-2030F
- Figure 153. Asia-Pacific Tyre Market Share, By Tyre Type, In USD Billion, 2016-2030F
- Figure 154. Asia-Pacific Tyre Market Share, By Rim Size, In USD Billion, 2016-2030F
- Figure 155. Asia-Pacific Tyre Market Share, By Demand Type, In USD Billion, 2016-2030F
- Figure 156. Asia-Pacific Tyre Market Share, By Distribution Channel, In USD Billion, 2016-2030F
- Figure 157. Asia-Pacific Tyre Market Share, By Country, In USD Billion, 2016-2030F
- Figure 158. India Tyre Market, By Value, In USD Billion, 2016-2030F
- Figure 159. India Tyre Market, By Volume, In Million Tyres, 2016-2030F
- Figure 160. India Tyre Market Share, By Tyre, In USD Billion, 2016-2030F
- Figure 161. India Tyre Market Share, By Vehicle Type, In USD Billion, 2016-2030F
- Figure 162. India Tyre Market Share, By Tyre Type, In USD Billion, 2016-2030F
- Figure 163. India Tyre Market Share, By Rim Size, In USD Billion, 2016-2030F
- Figure 164. India Tyre Market Share, By Demand Type, In USD Billion, 2016-2030F
- Figure 165. India Tyre Market Share, By Distribution Channel, In USD Billion, 2016-2030F
- Figure 166. China Tyre Market, By Value, In USD Billion, 2016-2030F
- Figure 167. China Tyre Market, By Volume, In Million Tyres, 2016-2030F
- Figure 168. China Tyre Market Share, By Tyre, In USD Billion, 2016-2030F
- Figure 169. China Tyre Market Share, By Vehicle Type, In USD Billion, 2016-2030F
- Figure 170. China Tyre Market Share, By Tyre Type, In USD Billion, 2016-2030F
- Figure 171. China Tyre Market Share, By Rim Size, In USD Billion, 2016-2030F
- Figure 172. China Tyre Market Share, By Demand Type, In USD Billion, 2016-2030F
- Figure 173. China Tyre Market Share, By Distribution Channel, In USD Billion, 2016-2030F
- Figure 174. Japan Tyre Market, By Value, In USD Billion, 2016-2030F
- Figure 175. Japan Tyre Market, By Volume, In Million Tyres, 2016-2030F
- Figure 176. Japan Tyre Market Share, By Tyre, In USD Billion, 2016-2030F
- Figure 177. Japan Tyre Market Share, By Vehicle Type, In USD Billion, 2016-2030F
- Figure 178. Japan Tyre Market Share, By Tyre Type, In USD Billion, 2016-2030F
- Figure 179. Japan Tyre Market Share, By Rim Size, In USD Billion, 2016-2030F
- Figure 180. Japan Tyre Market Share, By Demand Type, In USD Billion, 2016-2030F
- Figure 181. Japan Tyre Market Share, By Distribution Channel, In USD Billion, 2016-2030F
- Figure 182. Australia Tyre Market, By Value, In USD Billion, 2016-2030F
- Figure 183. Australia Tyre Market, By Volume, In Million Tyres, 2016-2030F
- Figure 184. Australia Tyre Market Share, By Tyre, In USD Billion, 2016-2030F
- Figure 185. Australia Tyre Market Share, By Vehicle Type, In USD Billion, 2016-2030F
- Figure 186. Australia Tyre Market Share, By Tyre Type, In USD Billion, 2016-2030F
- Figure 187. Australia Tyre Market Share, By Rim Size, In USD Billion, 2016-2030F
- Figure 188. Australia Tyre Market Share, By Demand Type, In USD Billion, 2016-2030F
- Figure 189. Australia Tyre Market Share, By Distribution Channel, In USD Billion, 2016-2030F
- Figure 190. Vietnam Tyre Market, By Value, In USD Billion, 2016-2030F
- Figure 191. Vietnam Tyre Market, By Volume, In Million Tyres, 2016-2030F
- Figure 192. Vietnam Tyre Market Share, By Tyre, In USD Billion, 2016-2030F
- Figure 193. Vietnam Tyre Market Share, By Vehicle Type, In USD Billion, 2016-2030F
- Figure 194. Vietnam Tyre Market Share, By Tyre Type, In USD Billion, 2016-2030F
- Figure 195. Vietnam Tyre Market Share, By Rim Size, In USD Billion, 2016-2030F
- Figure 196. Vietnam Tyre Market Share, By Demand Type, In USD Billion, 2016-2030F
- Figure 197. Vietnam Tyre Market Share, By Distribution Channel, In USD Billion, 2016-2030F
- Figure 198. South Korea Tyre Market, By Value, In USD Billion, 2016-2030F
- Figure 199. South Korea Tyre Market, By Volume, In Million Tyres, 2016-2030F
- Figure 200. South Korea Tyre Market Share, By Tyre, In USD Billion, 2016-2030F
- Figure 201. South Korea Tyre Market Share, By Vehicle Type, In USD Billion, 2016-2030F
- Figure 202. South Korea Tyre Market Share, By Tyre Type, In USD Billion, 2016-2030F
- Figure 203. South Korea Tyre Market Share, By Rim Size, In USD Billion, 2016-2030F
- Figure 204. South Korea Tyre Market Share, By Demand Type, In USD Billion, 2016-2030F
- Figure 205. South Korea Tyre Market Share, By Distribution Channel, In USD Billion, 2016-2030F
- Figure 206. Indonesia Tyre Market, By Value, In USD Billion, 2016-2030F
- Figure 207. Indonesia Tyre Market, By Volume, In Million Tyres, 2016-2030F
- Figure 208. Indonesia Tyre Market Share, By Tyre, In USD Billion, 2016-2030F
- Figure 209. Indonesia Tyre Market Share, By Vehicle Type, In USD Billion, 2016-2030F
- Figure 210. Indonesia Tyre Market Share, By Tyre Type, In USD Billion, 2016-2030F
- Figure 211. Indonesia Tyre Market Share, By Rim Size, In USD Billion, 2016-2030F
- Figure 212. Indonesia Tyre Market Share, By Demand Type, In USD Billion, 2016-2030F
- Figure 213. Indonesia Tyre Market Share, By Distribution Channel, In USD Billion, 2016-2030F
- Figure 214. Philippines Tyre Market, By Value, In USD Billion, 2016-2030F
- Figure 215. Philippines Tyre Market, By Volume, In Million Tyres, 2016-2030F
- Figure 216. Philippines Tyre Market Share, By Tyre, In USD Billion, 2016-2030F
- Figure 217. Philippines Tyre Market Share, By Vehicle Type, In USD Billion, 2016-2030F
- Figure 218. Philippines Tyre Market Share, By Tyre Type, In USD Billion, 2016-2030F
- Figure 219. Philippines Tyre Market Share, By Rim Size, In USD Billion, 2016-2030F
- Figure 220. Philippines Tyre Market Share, By Demand Type, In USD Billion, 2016-2030F
- Figure 221. Philippines Tyre Market Share, By Distribution Channel, In USD Billion, 2016-2030F
- Figure 222. Middle East & Africa Tyre Market, By Value, In USD Billion, 2016-2030F
- Figure 223. Middle East & Africa Tyre Market, By Volume, In Million Tyres, 2016-2030F
- Figure 224. Middle East & Africa Tyre Market Share, By Tyre, In USD Billion, 2016-2030F
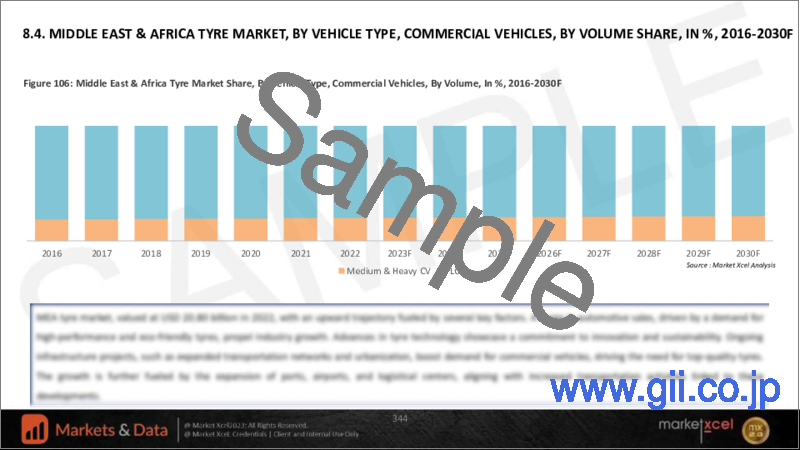
- Figure 225. Middle East & Africa Tyre Market Share, By Vehicle Type, In USD Billion, 2016-2030F
- Figure 226. Middle East & Africa Tyre Market Share, By Tyre Type, In USD Billion, 2016-2030F
- Figure 227. Middle East & Africa Tyre Market Share, By Rim Size, In USD Billion, 2016-2030F
- Figure 228. Middle East & Africa Tyre Market Share, By Demand Type, In USD Billion, 2016-2030F
- Figure 229. Middle East & Africa Tyre Market Share, By Distribution Channel, In USD Billion, 2016-2030F
- Figure 230. Middle East & Africa Tyre Market Share, By Country, In USD Billion, 2016-2030F
- Figure 231. Saudi Arabia Tyre Market, By Value, In USD Billion, 2016-2030F
- Figure 232. Saudi Arabia Tyre Market, By Volume, In Million Tyres, 2016-2030F
- Figure 233. Saudi Arabia Tyre Market Share, By Tyre, In USD Billion, 2016-2030F
- Figure 234. Saudi Arabia Tyre Market Share, By Vehicle Type, In USD Billion, 2016-2030F
- Figure 235. Saudi Arabia Tyre Market Share, By Tyre Type, In USD Billion, 2016-2030F
- Figure 236. Saudi Arabia Tyre Market Share, By Rim Size, In USD Billion, 2016-2030F
- Figure 237. Saudi Arabia Tyre Market Share, By Demand Type, In USD Billion, 2016-2030F
- Figure 238. Saudi Arabia Tyre Market Share, By Distribution Channel, In USD Billion, 2016-2030F
- Figure 239. UAE Tyre Market, By Value, In USD Billion, 2016-2030F
- Figure 240. UAE Tyre Market, By Volume, In Million Tyres, 2016-2030F
- Figure 241. UAE Tyre Market Share, By Tyre, In USD Billion, 2016-2030F
- Figure 242. UAE Tyre Market Share, By Vehicle Type, In USD Billion, 2016-2030F
- Figure 243. UAE Tyre Market Share, By Tyre Type, In USD Billion, 2016-2030F
- Figure 244. UAE Tyre Market Share, By Rim Size, In USD Billion, 2016-2030F
- Figure 245. UAE Tyre Market Share, By Demand Type, In USD Billion, 2016-2030F
- Figure 246. UAE Tyre Market Share, By Distribution Channel, In USD Billion, 2016-2030F
- Figure 247. South Africa Tyre Market, By Value, In USD Billion, 2016-2030F
- Figure 248. South Africa Tyre Market, By Volume, In Million Tyres, 2016-2030F
- Figure 249. South Africa Tyre Market Share, By Tyre, In USD Billion, 2016-2030F
- Figure 250. South Africa Tyre Market Share, By Vehicle Type, In USD Billion, 2016-2030F
- Figure 251. South Africa Tyre Market Share, By Tyre Type, In USD Billion, 2016-2030F
- Figure 252. South Africa Tyre Market Share, By Rim Size, In USD Billion, 2016-2030F
- Figure 253. South Africa Tyre Market Share, By Demand Type, In USD Billion, 2016-2030F
- Figure 254. South Africa Tyre Market Share, By Distribution Channel, In USD Billion, 2016-2030F
- Figure 255. By Tyre Map-Market Size (USD Billion) & Growth Rate (%), 2022
- Figure 256. By Vehicle Type Map-Market Size (USD Billion) & Growth Rate (%), 2022
- Figure 257. By Tyre Type Map-Market Size (USD Billion) & Growth Rate (%), 2022
- Figure 258. By Rim Size Map-Market Size (USD Billion) & Growth Rate (%), 2022
- Figure 259. By Demand Type Map-Market Size (USD Billion) & Growth Rate (%), 2022
- Figure 260. By Distribution Channel Map-Market Size (USD Billion) & Growth Rate (%), 2022
- Figure 261. By Region Map-Market Size (USD Billion) & Growth Rate (%), 2022
Global Tyre Market size was valued at USD 261.29 billion in 2022, which is expected to reach USD 425.81 billion in 2030 with a CAGR of 6.15% for the forecast period between 2023 and 2030. The tyre market has witnessed significant growth and evolution in recent years. Several factors have emerged as new drivers, shaping the market landscape. The increasing global automotive production and sales in emerging economies such as India, China, Japan, UAE, and other Southeast Asian countries have fuelled the demand for tyres. Rising disposable incomes and urbanization have led to higher vehicle ownership rates, driving the need for replacement tyres and aftermarket services. The growing emphasis on sustainability and environmental concerns has also resulted in a rising demand for fuel-efficient and eco-friendly tyres. Stricter regulations aimed at reducing carbon emissions have prompted tyre manufacturers to invest in research and development to introduce innovative tyre technologies that optimize fuel economy and reduce rolling resistance.
Moreover, recent developments in the tyre market have focused on enhancing safety, performance, and durability. Advanced tyre materials, such as silica-based compounds, are being utilized to improve traction, handling, and wet grip. Tyre manufacturers are also incorporating smart technologies, including sensors and connectivity features, to enable real-time monitoring of tyre conditions and enhance overall performance and safety. The market has also witnessed significant advancements in developing specialized tyres for specific vehicle types, such as SUVs, electric vehicles (EVs), and autonomous vehicles.
Overall, the tyre market continues to evolve in response to changing consumer demands, technological advancements, and environmental concerns. The focus on safety, performance, sustainability, and specialized tyre solutions is expected to drive further innovations and propel the market's growth in the coming years.
Surging Demand for Fuel-Efficient Tyres Driven by Environmental Concerns and Stricter Emission Regulations
The tyre market is experiencing a rising demand for fuel-efficient tyres owing to growing environmental concerns and stricter regulations aimed at reducing carbon emissions. Consumers are increasingly seeking tyres that offer lower rolling resistance, as they contribute to improved fuel economy and reduced greenhouse gas emissions. Additionally, vehicle manufacturers are focusing on developing more fuel-efficient vehicles, which require tyres that can optimize energy efficiency. As a result, tyre manufacturers are investing in research and development to introduce innovative tyre technologies that balance fuel efficiency, performance, and safety. The demand for fuel-efficient tyres is expected to continue its upward trajectory as sustainability becomes a critical factor in the purchasing decisions of consumers and fleet operators.
The Goodyear Efficient Grip Performance SUV tyre is designed for SUVs, providing fuel efficiency, dampening road noise and vibrations, and enhanced performance for a smooth driving experience.
Michelin Energy XM2+ offers a combination of fuel efficiency, durability, and safety. Ideal for those seeking high performance with low fuel consumption, it boasts a 22% reduction in rolling resistance.
Development of New Tyre Technologies
Tyre market has witnessed significant advancements in new tyre technologies. Manufacturers invest in research and development to introduce innovative solutions catering to evolving consumer needs. These technologies include advanced tread compounds that optimize fuel efficiency, reduce rolling resistance, and enhance traction on various road surfaces. Tyre construction techniques are also evolving, incorporating lightweight materials that improve handling and reduce overall vehicle weight. Additionally, smart tyre technologies with built-in sensors and connectivity features enable real-time monitoring of tyre pressure, temperature, and performance. These developments aim to enhance safety, performance, durability, and sustainability, ensuring that tyre manufacturers stay at the forefront of technological advancements and meet the demands of an ever-changing automotive industry.
In Jun 2023, Pirelli unveiled the P Zero AS Plus 3, a cutting-edge Ultra-High performance All-Season tyre, crafted exclusively for premium vehicles. The tyre seamlessly blends the sporty performance associated with Pirelli's iconic P Zero range with the comfort and longevity characteristic of the Pirelli "Plus" line. Specifically developed to cater to North American drivers, it fulfills the demand for all-season tyres capable of delivering excellent handling and covering extensive distances while ensuring comfort and durability.
In May 2022, Hankook tyre and Kumho Petrochemical Co., Ltd., a global petrochemical company, collaborated on a Memorandum of Understanding (MoU) on developing environmentally friendly tyres. This partnership aims to utilize Eco Solution-polymerized Styrene-Butadiene Rubber (Eco-SSBR). This sustainable material replaces the traditional styrene with Renewable Styrene Monomer (RSM) in Styrene-Butadiene Rubber (SSBR). Eco-SSBR enhances the wear resistance and fuel efficiency of tyres. Kumho Petrochemical is considering investing in this material, with plans for commercialization by 2026.
Radial Tyres Accelerate in the Global Market
By Tyre Type, Radial Tyre accounted for more than 70% of the market share in 2022. Radial tyres have been experiencing significant growth in the global tyre market as they offer better performance in terms of traction, handling, and fuel efficiency compared to bias tyres. This has led to increased adoption, especially in passenger and commercial vehicles. The rolling resistance of radial tyre is lower, contributing to improved fuel efficiency, making them an attractive option for environmentally conscious consumers. Also, Stringent regulations related to emissions and fuel efficiency are pushing automakers and consumers to choose radial tyres for improved performance. As the global automotive industry shifts toward electric and autonomous vehicles, radial tyres are often the preferred choice due to their advanced technology and compatibility with these emerging vehicle types. Radial tyres are favored for commercial trucks and buses due to their durability and cost-efficiency, contributing to their growth in the market. Also, these tyres are becoming more accessible and available in various sizes and applications, further driving their growth in the global tyre market.
Passenger Vehicles Fueling Global Tyre Market Growth
By Vehicle Type, Passenger Vehicles dominated the global tyre market with nearly two third of the market share in 2022, expected to witness a steady CAGR during the forecasted period. With the rising passenger car manufacturing activities by global giants such as Toyota, VW, Nissan, Hyundai, Renault, BMW, Mercedes, etc., the demand for tyres has also improved.
In 2022, according to the OICA, the number of passenger cars manufactured has increased to 6,15,98,650 from around 5,70,86,075 in 2021. Also, there has been a growth in licensed vehicles on the road across countries like India, China, Brazil, Argentina, etc. Henceforth, the growth in the manufacturing of passenger car tyres, coupled with an increasing number of licenses awarded by the government has contributed to an increase in the demand for passenger car tyres from both OEMs and aftermarket. Factors such as the expanding global population and improving economic conditions have resulted in a notable rise in vehicle ownership, with a specific focus on passenger cars. This increase in the number of automobiles on the road has led to a natural upswing in the demand for tyres, particularly all-season tyres. Notably, emerging economies, including India, China, various Southeast Asian nations, and countries in Africa, are attracting considerable interest from the middle-class demographic, characterized by rising disposable incomes. Consequently, this heightened middle-class interest has translated into a surge in demand for passenger vehicles and, by extension, an increased requirement for tyres.
Tyre Industry Faces Environmental Dilemma: The Quest for Alternatives to 6PPD Amidst Environmental Concerns and Industry Collaboration
The tyre industry grapples with a major challenge with the use of 6PPD, a crucial compound that safeguards tyres from degradation and cracking. While essential for tyres safety and performance, the environmental impact of 6PPD, especially 6PPD-Quinone in tyre wear dust, raises concerns about its role in Coho salmon deaths and adverse effects on aquatic life. In 2023, tribes in Washington sought to ban 6PPD due to its toxicity to waterbodies. The US tyre Manufacturers Association is exploring alternatives in response. Major players like Michelin, Continental, and Pirelli are already seeking substitutes, suggesting collective industry action is necessary. The challenge lies in finding an alternative that prevents degradation without compromising other tyre attributes. As the industry navigates this dilemma, collaboration becomes crucial to ensure safety while addressing environmental concerns.
Asia-Pacific Leads the Global Tyre Market
The Asia-Pacific region has seized the top position in the global tyre market in 2022, emerging as a major driving force behind its growth and development. The region is expected to be the fastest-growing market for tyres in the coming years, driven by strong economic growth and rising vehicle ownership. SUVs and pickup trucks are becoming increasingly popular, and these vehicles typically require larger, more expensive tyres. Furthermore, as more people move to cities, they are becoming more reliant on personal vehicles for transportation. This is leading to an increase in the demand for tyres in urban areas. This region encompasses countries such as China, India, Japan, and South Korea, and plays a pivotal role in shaping the dynamics of the tyre industry. Asia-Pacific's leadership in the global tyre market can be attributed to several factors, including its significant population, expanding middle-class with higher disposable incomes, and the continuous growth of the automotive sector. With the rising number of vehicles on the road, the demand for tyres, especially in the passenger and commercial vehicle segments, has witnessed remarkable growth. Furthermore, the region's focus on economic development, urbanization, and improving road infrastructure has contributed to increased vehicle ownership, further fueling the demand for tyres. The presence of leading tyre manufacturers and the availability of a diverse range of tyre types and sizes have made Asia-Pacific a hub for tyre production, innovation, and distribution.
In 2023, Automotive Tyre Manufacturers' Association (ATMA) declared India's potential to become an USD 8 trillion economy by 2030. In line with historical trends, the tyre industry has the potential to outperform the GDP growth rate by approximately 2-3%. High levels of automation, a manufacturing renaissance, cost arbitrage, and a large skill pool accessible in these developing nations offer plenty of room for expansion. Therefore, economic development, urbanization, favorable government policies, infrastructure development, rising awareness of safety and quality, the region's status as a manufacturing hub, and innovation in tyre technologies contribute to its growth in developing nations.
Impact of COVID-19
The pandemic had a profound impact on the tyre market globally. The widespread lockdowns, travel restrictions, and economic downturn caused by the pandemic resulted in a significant decline in vehicle production and sales worldwide. As a result, the demand for tyres plummeted, leading to excess inventory and decreased tyre prices. Manufacturing facilities were forced to suspend or reduce operations, disrupting supply chains and causing delays in production and delivery. The closure of automotive dealerships and tyre retailers further exacerbated the decline in demand.
The recovery of the Tyre Market heavily depends on the revival of the automotive industry and the return to pre-pandemic levels of economic stability and consumer confidence. The resumption of vehicle production, easing of travel restrictions, and increased consumer confidence will play crucial roles in the industry's recovery. Adapting to the changing market conditions, exploring new avenues for growth, and implementing innovative strategies will be essential for tyre manufacturers and suppliers to navigate the post-pandemic landscape successfully.
Impact of Russia-Ukraine War
The Russia-Ukraine war has had a significant impact on the tyre market at a global level. The conflict has disrupted supply chains, leading to a shortage of raw materials and components used in tyre manufacturing. Ukraine is a major producer of natural rubber, which is a critical ingredient in tyre production. With the conflict, there has been a disruption in the supply of natural rubber, causing price increases and supply constraints. This has resulted in higher production costs for tyre manufacturers and ultimately increased consumer prices. Additionally, the political uncertainty and economic instability in the region have dampened consumer demand, affecting the overall Tyre Market. Companies have had to adapt to these challenges by seeking alternative sourcing options and exploring new markets to mitigate the impact of the Russia-Ukraine war on the tyre industry.
Key Players Landscape and Outlook
The tyre market is highly competitive, with a few major players dominating the market. These players are Bridgestone, Michelin, Continental, Goodyear. These companies have a strong brand presence, a vast distribution network, and a focus on innovation. They are constantly investing in research and development to develop new technologies and products that meet the needs of their customers. The tyre market is expected to grow, driven by the increasing demand for passenger cars, light commercial vehicles, and heavy-duty vehicles.
In Aug 2023, Bridgestone Corporation launched the new product series-ENLITEN during the Bridgestone World Solar Challenge (BWSC). ENLITEN series is developed with an aim to elevate conventional tyres by enhancing environmental performance along with exceeding the customer and market demands in product performance. Through the advanced performance attributes of ENLITEN technology, Bridgestone is focused on increasing social value and customer value.
In March 2023, Continental AG tyre division and Siemens signed a strategic supplier agreement. Siemens, a preferred supplier, has announced on the fringes of the Tyre Expo trade show in Hannover, Germany, that it will provide automation and drive technologies to Continental's tyre facilities globally. Through cutting-edge automation and control technologies, the partnership seeks to further optimize Continental's tyre manufacturing around the globe. The agreement calls for the establishment of standards that will enable Continental to further improve the efficiency of its production machines over the course of its lifetimes.
In Jan 2023, Michelin partnered with leading logistics service provider DHL to commence the first ever on-road trails for Michelin UPTIS airless tyre. As part of this pilot mission, nearly 50 DHL Express vans will begin running on the new tyres to make last-mile deliveries in Singapore by end-2023. The pilot program began with the first vehicles making the first delivery trips on January 10.
Table of Contents
1. Research Methodology
2. Project Scope & Definitions
3. Impact of COVID-19 on Global Tyre Market
4. Impact of Russia-Ukraine War
5. Executive Summary
6. Voice of Customer
- 6.1. Consumers Respondent's Demographics
- 6.2. Tyre Type
- 6.3. Preferred Tyre Brand
- 6.4. Tyre Replacement
- 6.5. Purchase Decision Factors
- 6.6. Medium of Purchase
- 6.7. Performance Attributes
- 6.8. Tyre Lifespan
- 6.9. Sustainability and Eco-friendly Tyres
- 6.10. Technical Advancements in the Near Future
7. Tyre Market Outlook, 2016-2030F
- 7.1. Market Size & Forecast
- 7.1.1. By Value
- 7.1.2. By Volume
- 7.2. By Tyre
- 7.2.1. Winter Tyre
- 7.2.2. Summer Tyre
- 7.2.3. All Season Tyre
- 7.3. By Vehicle Type
- 7.3.1. Passenger Vehicles
- 7.3.1.1. Two-wheeler
- 7.3.1.2. Three-Wheeler
- 7.3.1.3. Four-Wheeler
- 7.3.2. Commercial Vehicle
- 7.3.2.1. LCV
- 7.3.2.2. Medium & Heavy CV
- 7.3.3. Off the Road
- 7.3.3.1. Agriculture
- 7.3.3.2. Mining & Construction
- 7.3.3.3. Others
- 7.3.1. Passenger Vehicles
- 7.4. By Tyre Type
- 7.4.1. Radial
- 7.4.2. Bias
- 7.5. By Rim Size
- 7.5.1. Upto 20 inches
- 7.5.2. Above 20 inches
- 7.6. By Demand Type
- 7.6.1. New Product (OEMs)
- 7.6.2. Replacements
- 7.7. By Distribution Channel
- 7.7.1. Original Equipment Manufacturers (OEMs)
- 7.7.2. Multi Brand Distributor
- 7.7.3. Single Brand Distributor
- 7.7.4. Online
- 7.8. By Region
- 7.8.1. North America
- 7.8.2. Europe
- 7.8.3. South America
- 7.8.4. Asia-Pacific
- 7.8.5. Middle East and Africa
- 7.9. By Company Market Share (%), 2022
8. Tyre Market Outlook, By Region, 2016-2030F
- 8.1. North America*
- 8.1.1. By Tyre
- 8.1.1.1. Winter Tyre
- 8.1.1.2. Summer Tyre
- 8.1.1.3. All Season Tyre
- 8.1.2. By Vehicle Type
- 8.1.2.1. Passenger Vehicles
- 8.1.2.1.1. Two-wheeler
- 8.1.2.1.2. Three-Wheeler
- 8.1.2.1.3. Four-Wheeler
- 8.1.2.2. Commercial Vehicle
- 8.1.2.2.1. LCV
- 8.1.2.2.2. Medium & Heavy CV
- 8.1.2.3. Off the Road
- 8.1.2.3.1. Agriculture
- 8.1.2.3.2. Mining & Construction
- 8.1.2.3.3. Others
- 8.1.3. By Tyre Type
- 8.1.3.1. Radial
- 8.1.3.2. Bias
- 8.1.4. By Rim Size
- 8.1.4.1. Upto 20 inches
- 8.1.4.2. Above 20 inches
- 8.1.5. By Demand Type
- 8.1.5.1. New Product (OEMs)
- 8.1.5.2. Replacements
- 8.1.6. By Distribution Channel
- 8.1.6.1. Original Equipment Manufacturers (OEMs)
- 8.1.6.2. Multi Brand Distributor
- 8.1.6.3. Single Brand Distributor
- 8.1.6.4. Online
- 8.1.7. United States*
- 8.1.7.1. By Tyre
- 8.1.7.1.1. Winter Tyre
- 8.1.7.1.2. Summer Tyre
- 8.1.7.1.3. All Season Tyre
- 8.1.7.2. By Vehicle Type
- 8.1.7.2.1. Passenger Vehicles
- 8.1.7.2.1.1. Two-wheeler
- 8.1.7.2.1.2. Three-Wheeler
- 8.1.7.2.1.3. Four-Wheeler
- 8.1.7.2.2. Commercial Vehicle
- 8.1.7.2.2.1. LCV
- 8.1.7.2.2.2. Medium & Heavy CV
- 8.1.7.2.3. Off the Road
- 8.1.7.2.3.1. Agriculture
- 8.1.7.2.3.2. Mining & Construction
- 8.1.7.2.3.3. Others
- 8.1.7.3. By Tyre Type
- 8.1.7.3.1. Radial
- 8.1.7.3.2. Bias
- 8.1.7.4. By Rim Size
- 8.1.7.4.1. Upto 20 inches
- 8.1.7.4.2. Above 20 inches
- 8.1.7.5. By Demand Type
- 8.1.7.5.1. New Product (OEMs)
- 8.1.7.5.2. Replacements
- 8.1.7.6. By Distribution Channel
- 8.1.7.6.1. Original Equipment Manufacturers (OEMs)
- 8.1.7.6.2. Multi Brand Distributor
- 8.1.7.6.3. Single Brand Distributor
- 8.1.7.6.4. Online
- 8.1.8. Canada
- 8.1.9. Mexico
- 8.1.1. By Tyre
All segments will be provided for all regions and countries covered:
- 8.2. Europe
- 8.2.1. Germany
- 8.2.2. France
- 8.2.3. Italy
- 8.2.4. United Kingdom
- 8.2.5. Russia
- 8.2.6. Netherlands
- 8.2.7. Spain
- 8.2.8. Turkey
- 8.2.9. Poland
- 8.3. South America
- 8.3.1. Brazil
- 8.3.2. Argentina
- 8.4. Asia-Pacific
- 8.4.1. India
- 8.4.2. China
- 8.4.3. Japan
- 8.4.4. Australia
- 8.4.5. Vietnam
- 8.4.6. South Korea
- 8.4.7. Indonesia
- 8.4.8. Philippines
- 8.5. Middle East & Africa
- 8.5.1. Saudi Arabia
- 8.5.2. UAE
- 8.5.3. South Africa
9. Market Mapping, 2022
- 9.1. By Tyre
- 9.2. By Vehicle Type
- 9.3. By Tyre Type
- 9.4. By Rim Size
- 9.5. By Demand Type
- 9.6. By Distribution Channel
- 9.7. By Region
10. Macro Environment and Industry Structure
- 10.1. Supply Demand Analysis
- 10.2. Import Export Analysis - Volume and Value
- 10.3. Supply/Value Chain Analysis
- 10.4. PESTEL Analysis
- 10.4.1. Political Factors
- 10.4.2. Economic System
- 10.4.3. Social Implications
- 10.4.4. Technological Advancements
- 10.4.5. Environmental Impacts
- 10.4.6. Legal Compliances and Regulatory Policies (Statutory Bodies Included)
- 10.5. Porter's Five Forces Analysis
- 10.5.1. Supplier Power
- 10.5.2. Buyer Power
- 10.5.3. Substitution Threat
- 10.5.4. Threat from New Entrant
- 10.5.5. Competitive Rivalry
11. Market Dynamics
- 11.1. Growth Drivers
- 11.2. Growth Inhibitors (Challenges, Restraints)
12. Key Players Landscape
- 12.1. Competition Matrix of Top Five Market Leaders
- 12.2. Market Revenue Analysis of Top Five Market Leaders (in %, 2022)
- 12.3. Mergers and Acquisitions/Joint Ventures (If Applicable)
- 12.4. SWOT Analysis (For Five Market Players)
- 12.5. Patent Analysis (If Applicable)
13. Pricing Analysis
14. Case Studies
15. Key Players Outlook
- 15.1. Bridgestone Corporation
- 15.1.1. Company Details
- 15.1.2. Key Management Personnel
- 15.1.3. Products & Services
- 15.1.4. Financials (As reported)
- 15.1.5. Key Market Focus & Geographical Presence
- 15.1.6. Recent Developments
- 15.2. Michelin
- 15.3. Continental A.G.
- 15.4. Goodyear Tyre & Rubber Company
- 15.5. Pirelli & C. SpA.
- 15.6. Sumitomo Rubber Industries, Ltd.
- 15.7. Hankook Tyre & Technology Co., Ltd.
- 15.8. Yokohama Rubber Company, Limited
- 15.9. Hangzhou Zhongce Rubber Co., Ltd.
- 15.10. Toyo Tyre Corporation
Companies mentioned above DO NOT hold any order as per market share and can be changed as per information available during research work.
