|
|
市場調査レポート
商品コード
1388963
スチールワイヤーの世界市場:種類別・サイズ別・形状別・最終用途別・地域別の評価、機会と予測 (2016年~2030年)Steel Wire Market Assessment, By Type, By Size, By Form, By End-use, By Region, Opportunities, and Forecast, 2016-2030F |
||||||
|
|
|||||||
カスタマイズ可能
|
|||||||


| スチールワイヤーの世界市場:種類別・サイズ別・形状別・最終用途別・地域別の評価、機会と予測 (2016年~2030年) |
|
出版日: 2023年12月01日
発行: Market Xcel - Markets and Data
ページ情報: 英文 208 Pages
納期: 3~5営業日
|

- 全表示
- 概要
- 図表
- 目次
世界のスチールワイヤーの市場規模は、2022年に1,064億9,000万米ドルと評価され、2023年から2030年の予測期間中に2.9%のCAGRで成長し、2030年には1,338億5,000万米ドルに達すると予測されています。アジア太平洋は、中国やインドなどの巨大な建設部門と自動車部門からの旺盛な需要により、この市場を独占しています。炭素鋼は、その高いリサイクル性とともに、建設および自動車部門におけるその広大な活用領域により、スチールワイヤーの最も支配的なタイプです。
スチールワイヤー市場は、世界の様々な産業における需要と成長を促進する多くの要因によって繁栄しています。重要な原動力の一つは、建設業界の着実な拡大です。このような建設活動の急増は、ワイヤー製品に対する一貫した強い需要を促進し、スチールワイヤー市場の成長を支えています。さらに、自動車産業はスチールワイヤー需要を促進する上で極めて重要な役割を果たしています。技術進歩に伴う自動車生産の増加は、この需要に直接影響を与えます。スチールワイヤーは、タイヤコード、スプリング、自動車内の様々な部品に幅広く使用されており、自動車の安定性と安全性に貢献しています。最後に、工業製造部門は機械、設備、様々な工業製品の生産においてスチールワイヤーに大きく依存しており、これも市場を牽引しています。
当レポートでは、世界のスチールワイヤーの市場について分析し、製品の概略や市場の基本構造、全体的な市場規模の動向見通し、セグメント別・地域別の詳細動向、市場の背景事情や主な影響要因、主要企業のプロファイル・市場シェアなどを調査しております。
目次
第1章 調査手法
第2章 プロジェクトの範囲と定義
第3章 新型コロナウイルス感染症 (COVID-19) がスチールワイヤー市場に与える影響
第4章 ロシア・ウクライナ戦争の影響
第5章 エグゼクティブサマリー
第6章 顧客側の見解
- 市場認識と製品情報
- ブランドの認知度とロイヤルティ
- 購入意思決定時に考慮される要素
- 購入頻度
- 購入手段
第7章 スチールワイヤー市場の将来展望 (2016年~2030年)
- 市場規模と予測
- 金額ベース
- 数量ベース
- 種類別
- 炭素鋼
- ステンレス鋼
- 亜鉛めっき鋼
- 塗装鋼
- 合金鋼
- その他
- サイズ別
- 2.75~6mm
- 6.1~12mm
- その他
- 形状別
- ロープ
- ロープ以外
- 最終用途別
- 建設
- 輸送機械
- 自動車
- 航空
- 船舶
- その他
- 産業用
- 鉱業
- 製造業
- 通信
- その他
- 農業用
- その他
- 地域別
- 北米
- 欧州
- 南米
- アジア太平洋
- 中東・アフリカ
- 企業別市場シェア (%、2022年)
第8章 スチールワイヤー市場の将来展望:地域別 (2016年~2030年)
- 北米*
- 市場規模と予測
- 金額ベース
- 数量ベース
- 種類別
- サイズ別
- 形状別
- 最終用途別
- 米国*
- 市場規模と予測
- 種類別
- サイズ別
- 形状別
- 最終用途別
- 市場規模と予測
各セグメントの情報は、対象となる全ての地域・国について提供されます。
- カナダ
- メキシコ
- 欧州
- ドイツ
- フランス
- イタリア
- 英国
- ロシア
- オランダ
- スペイン
- トルコ
- ポーランド
- 南米
- ブラジル
- アルゼンチン
- アジア太平洋
- インド
- 中国
- 日本
- オーストラリア
- ベトナム
- 韓国
- インドネシア
- フィリピン
- 中東・アフリカ
- サウジアラビア
- アラブ首長国連邦
- 南アフリカ
第9章 供給サイド分析
- 生産能力:企業別
- 生産量:企業別
- 運用効率:企業別
- 主要工場の所在地 (第25位まで)
第10章 市場マッピング (2022年)
- 種類別
- サイズ別
- フォーム別
- 最終用途別
- 地域別
第11章 マクロ環境と産業構造
- 需給分析
- 輸出入分析 (数量・金額ベース)
- サプライ/バリューチェーン分析
- PESTEL分析
- ポーターのファイブフォース分析
第12章 市場力学
- 成長促進要因
- 成長抑制要因 (課題、制約)
第13章 主要企業の情勢
- 市場リーダー上位5社:競合マトリックス
- 市場リーダー上位5社:市場収益分析 (%、2022年)
- 企業合併・買収 (M&A)/合弁事業 (該当する場合)
- SWOT分析 (市場参入企業5社の場合)
- 特許分析 (該当する場合)
第14章 価格分析
第15章 ケーススタディ
第16章 主要企業の見通し
- ArcelorMittal
- 企業概要
- 経営幹部
- 製品・サービス
- 財務状況 (報告どおり)
- 重点市場と地理的プレゼンス
- 最近の動向
- Bekaert
- JFE Steel Corporation
- KOBE STEEL, LTD
- Van Merksteijn International
- LIBERTY Steel Group
- NIPPON STEEL CORPORATION
- Tata Steel
- Henan Hengxing Science &Technology Co., Ltd
- Tianjin Huayuan Metal Wire Products Co.Ltd
上記企業は市場シェア順ではなく、調査作業中に入手した情報に従って変更される可能性があります。
第17章 戦略提言
第18章 Market Xcelについて、免責事項
List of Tables
- Table 1. Pricing Analysis of Products from Key Players
- Table 2. Competition Matrix of Top 5 Market Leaders
- Table 3. Mergers & Acquisitions/ Joint Ventures (If Applicable)
- Table 4. About Us - Regions and Countries Where We Have Executed Client Projects
List of Figures
- Figure 1. Global Steel Wire Market, By Value, In USD Billion, 2016-2030F
- Figure 2. Global Steel Wire Market, By Volume, In Kilotons, 2016-2030F
- Figure 3. Global Steel Wire Market Share, By Type, In USD Billion, 2016-2030F
- Figure 4. Global Steel Wire Market Share, By Size, In USD Billion, 2016-2030F
- Figure 5. Global Steel Wire Market Share, By Form, In USD Billion, 2016-2030F
- Figure 6. Global Steel Wire Market Share, By End-use, In USD Billion, 2016-2030F
- Figure 7. Global Steel Wire Market Share, By Region, In USD Billion, 2016-2030F
- Figure 8. North America Steel Wire Market, By Value, In USD Billion, 2016-2030F
- Figure 9. North America Steel Wire Market, By Volume, In Kilotons, 2016-2030F
- Figure 10. North America Steel Wire Market Share, By Type, In USD Billion, 2016-2030F
- Figure 11. North America Steel Wire Market Share, By Size, In USD Billion, 2016-2030F
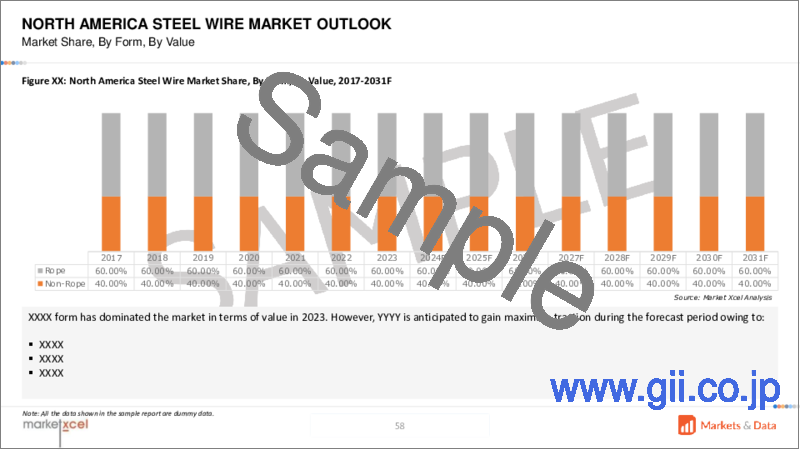
- Figure 12. North America Steel Wire Market Share, By Form, In USD Billion, 2016-2030F
- Figure 13. North America Steel Wire Market Share, By End-use, In USD Billion, 2016-2030F
- Figure 14. North America Steel Wire Market Share, By Country, In USD Billion, 2016-2030F
- Figure 15. United States Steel Wire Market, By Value, In USD Billion, 2016-2030F
- Figure 16. United States Steel Wire Market, By Volume, In Kilotons, 2016-2030F
- Figure 17. United States Steel Wire Market Share, By Type, In USD Billion, 2016-2030F
- Figure 18. United States Steel Wire Market Share, By Size, In USD Billion, 2016-2030F
- Figure 19. United States Steel Wire Market Share, By Form, In USD Billion, 2016-2030F
- Figure 20. United States Steel Wire Market Share, By End-use, In USD Billion, 2016-2030F
- Figure 21. Canada Steel Wire Market, By Value, In USD Billion, 2016-2030F
- Figure 22. Canada Steel Wire Market, By Volume, In Kilotons, 2016-2030F
- Figure 23. Canada Steel Wire Market Share, By Type, In USD Billion, 2016-2030F
- Figure 24. Canada Steel Wire Market Share, By Size, In USD Billion, 2016-2030F
- Figure 25. Canada Steel Wire Market Share, By Form, In USD Billion, 2016-2030F
- Figure 26. Canada Steel Wire Market Share, By End-use, In USD Billion, 2016-2030F
- Figure 27. Mexico Steel Wire Market, By Value, In USD Billion, 2016-2030F
- Figure 28. Mexico Steel Wire Market, By Volume, In Kilotons, 2016-2030F
- Figure 29. Mexico Steel Wire Market Share, By Type, In USD Billion, 2016-2030F
- Figure 30. Mexico Steel Wire Market Share, By Size, In USD Billion, 2016-2030F
- Figure 31. Mexico Steel Wire Market Share, By Form, In USD Billion, 2016-2030F
- Figure 32. Mexico Steel Wire Market Share, By End-use, In USD Billion, 2016-2030F
- Figure 33. Europe Steel Wire Market, By Value, In USD Billion, 2016-2030F
- Figure 34. Europe Steel Wire Market, By Volume, In Kilotons, 2016-2030F
- Figure 35. Europe Steel Wire Market Share, By Type, In USD Billion, 2016-2030F
- Figure 36. Europe Steel Wire Market Share, By Size, In USD Billion, 2016-2030F
- Figure 37. Europe Steel Wire Market Share, By Form, In USD Billion, 2016-2030F
- Figure 38. Europe Steel Wire Market Share, By End-use, In USD Billion, 2016-2030F
- Figure 39. Europe Steel Wire Market Share, By Country, In USD Billion, 2016-2030F
- Figure 40. Germany Steel Wire Market, By Value, In USD Billion, 2016-2030F
- Figure 41. Germany Steel Wire Market, By Volume, In Kilotons, 2016-2030F
- Figure 42. Germany Steel Wire Market Share, By Type, In USD Billion, 2016-2030F
- Figure 43. Germany Steel Wire Market Share, By Size, In USD Billion, 2016-2030F
- Figure 44. Germany Steel Wire Market Share, By Form, In USD Billion, 2016-2030F
- Figure 45. Germany Steel Wire Market Share, By End-use, In USD Billion, 2016-2030F
- Figure 46. France Steel Wire Market, By Value, In USD Billion, 2016-2030F
- Figure 47. France Steel Wire Market, By Volume, In Kilotons, 2016-2030F
- Figure 48. France Steel Wire Market Share, By Type, In USD Billion, 2016-2030F
- Figure 49. France Steel Wire Market Share, By Size, In USD Billion, 2016-2030F
- Figure 50. France Steel Wire Market Share, By Form, In USD Billion, 2016-2030F
- Figure 51. France Steel Wire Market Share, By End-use, In USD Billion, 2016-2030F
- Figure 52. Italy Steel Wire Market, By Value, In USD Billion, 2016-2030F
- Figure 53. Italy Steel Wire Market, By Volume, In Kilotons, 2016-2030F
- Figure 54. Italy Steel Wire Market Share, By Type, In USD Billion, 2016-2030F
- Figure 55. Italy Steel Wire Market Share, By Size, In USD Billion, 2016-2030F
- Figure 56. Italy Steel Wire Market Share, By Form, In USD Billion, 2016-2030F
- Figure 57. Italy Steel Wire Market Share, By End-use, In USD Billion, 2016-2030F
- Figure 58. United Kingdom Steel Wire Market, By Value, In USD Billion, 2016-2030F
- Figure 59. United Kingdom Steel Wire Market, By Volume, In Kilotons, 2016-2030F
- Figure 60. United Kingdom Steel Wire Market Share, By Type, In USD Billion, 2016-2030F
- Figure 61. United Kingdom Steel Wire Market Share, By Size, In USD Billion, 2016-2030F
- Figure 62. United Kingdom Steel Wire Market Share, By Form, In USD Billion, 2016-2030F
- Figure 63. United Kingdom Steel Wire Market Share, By End-use, In USD Billion, 2016-2030F
- Figure 64. Russia Steel Wire Market, By Value, In USD Billion, 2016-2030F
- Figure 65. Russia Steel Wire Market, By Volume, In Kilotons, 2016-2030F
- Figure 66. Russia Steel Wire Market Share, By Type, In USD Billion, 2016-2030F
- Figure 67. Russia Steel Wire Market Share, By Size, In USD Billion, 2016-2030F
- Figure 68. Russia Steel Wire Market Share, By Form, In USD Billion, 2016-2030F
- Figure 69. Russia Steel Wire Market Share, By End-use, In USD Billion, 2016-2030F
- Figure 70. Netherlands Steel Wire Market, By Value, In USD Billion, 2016-2030F
- Figure 71. Netherlands Steel Wire Market, By Volume, In Kilotons, 2016-2030F
- Figure 72. Netherlands Steel Wire Market Share, By Type, In USD Billion, 2016-2030F
- Figure 73. Netherlands Steel Wire Market Share, By Size, In USD Billion, 2016-2030F
- Figure 74. Netherlands Steel Wire Market Share, By Form, In USD Billion, 2016-2030F
- Figure 75. Netherlands Steel Wire Market Share, By End-use, In USD Billion, 2016-2030F
- Figure 76. Spain Steel Wire Market, By Value, In USD Billion, 2016-2030F
- Figure 77. Spain Steel Wire Market, By Volume, In Kilotons, 2016-2030F
- Figure 78. Spain Steel Wire Market Share, By Type, In USD Billion, 2016-2030F
- Figure 79. Spain Steel Wire Market Share, By Size, In USD Billion, 2016-2030F
- Figure 80. Spain Steel Wire Market Share, By Form, In USD Billion, 2016-2030F
- Figure 81. Spain Steel Wire Market Share, By End-use, In USD Billion, 2016-2030F
- Figure 82. Turkey Steel Wire Market, By Value, In USD Billion, 2016-2030F
- Figure 83. Turkey Steel Wire Market, By Volume, In Kilotons, 2016-2030F
- Figure 84. Turkey Steel Wire Market Share, By Type, In USD Billion, 2016-2030F
- Figure 85. Turkey Steel Wire Market Share, By Size, In USD Billion, 2016-2030F
- Figure 86. Turkey Steel Wire Market Share, By Form, In USD Billion, 2016-2030F
- Figure 87. Turkey Steel Wire Market Share, By End-use, In USD Billion, 2016-2030F
- Figure 88. Poland Steel Wire Market, By Value, In USD Billion, 2016-2030F
- Figure 89. Poland Steel Wire Market, By Volume, In Kilotons, 2016-2030F
- Figure 90. Poland Steel Wire Market Share, By Type, In USD Billion, 2016-2030F
- Figure 91. Poland Steel Wire Market Share, By Size, In USD Billion, 2016-2030F
- Figure 92. Poland Steel Wire Market Share, By Form, In USD Billion, 2016-2030F
- Figure 93. Poland Steel Wire Market Share, By End-use, In USD Billion, 2016-2030F
- Figure 94. South America Steel Wire Market, By Value, In USD Billion, 2016-2030F
- Figure 95. South America Steel Wire Market, By Volume, In Kilotons, 2016-2030F
- Figure 96. South America Steel Wire Market Share, By Type, In USD Billion, 2016-2030F
- Figure 97. South America Steel Wire Market Share, By Size, In USD Billion, 2016-2030F
- Figure 98. South America Steel Wire Market Share, By Form, In USD Billion, 2016-2030F
- Figure 99. South America Steel Wire Market Share, By End-use, In USD Billion, 2016-2030F
- Figure 100. South America Steel Wire Market Share, By Country, In USD Billion, 2016-2030F
- Figure 101. Brazil Steel Wire Market, By Value, In USD Billion, 2016-2030F
- Figure 102. Brazil Steel Wire Market, By Volume, In Kilotons, 2016-2030F
- Figure 103. Brazil Steel Wire Market Share, By Type, In USD Billion, 2016-2030F
- Figure 104. Brazil Steel Wire Market Share, By Size, In USD Billion, 2016-2030F
- Figure 105. Brazil Steel Wire Market Share, By Form, In USD Billion, 2016-2030F
- Figure 106. Brazil Steel Wire Market Share, By End-use, In USD Billion, 2016-2030F
- Figure 107. Argentina Steel Wire Market, By Value, In USD Billion, 2016-2030F
- Figure 108. Argentina Steel Wire Market, By Volume, In Kilotons, 2016-2030F
- Figure 109. Argentina Steel Wire Market Share, By Type, In USD Billion, 2016-2030F
- Figure 110. Argentina Steel Wire Market Share, By Size, In USD Billion, 2016-2030F
- Figure 111. Argentina Steel Wire Market Share, By Form, In USD Billion, 2016-2030F
- Figure 112. Argentina Steel Wire Market Share, By End-use, In USD Billion, 2016-2030F
- Figure 113. Asia-Pacific Steel Wire Market, By Value, In USD Billion, 2016-2030F
- Figure 114. Asia-Pacific Steel Wire Market, By Volume, In Kilotons, 2016-2030F
- Figure 115. Asia-Pacific Steel Wire Market Share, By Type, In USD Billion, 2016-2030F
- Figure 116. Asia-Pacific Steel Wire Market Share, By Size, In USD Billion, 2016-2030F
- Figure 117. Asia-Pacific Steel Wire Market Share, By Form, In USD Billion, 2016-2030F
- Figure 118. Asia-Pacific Steel Wire Market Share, By End-use, In USD Billion, 2016-2030F
- Figure 119. Asia-Pacific Steel Wire Market Share, By Country, In USD Billion, 2016-2030F
- Figure 120. India Steel Wire Market, By Value, In USD Billion, 2016-2030F
- Figure 121. India Steel Wire Market, By Volume, In Kilotons, 2016-2030F
- Figure 122. India Steel Wire Market Share, By Type, In USD Billion, 2016-2030F
- Figure 123. India Steel Wire Market Share, By Size, In USD Billion, 2016-2030F
- Figure 124. India Steel Wire Market Share, By Form, In USD Billion, 2016-2030F
- Figure 125. India Steel Wire Market Share, By End-use, In USD Billion, 2016-2030F
- Figure 126. China Steel Wire Market, By Value, In USD Billion, 2016-2030F
- Figure 127. China Steel Wire Market, By Volume, In Kilotons, 2016-2030F
- Figure 128. China Steel Wire Market Share, By Type, In USD Billion, 2016-2030F
- Figure 129. China Steel Wire Market Share, By Size, In USD Billion, 2016-2030F
- Figure 130. China Steel Wire Market Share, By Form, In USD Billion, 2016-2030F
- Figure 131. China Steel Wire Market Share, By End-use, In USD Billion, 2016-2030F
- Figure 132. Japan Steel Wire Market, By Value, In USD Billion, 2016-2030F
- Figure 133. Japan Steel Wire Market, By Volume, In Kilotons, 2016-2030F
- Figure 134. Japan Steel Wire Market Share, By Type, In USD Billion, 2016-2030F
- Figure 135. Japan Steel Wire Market Share, By Size, In USD Billion, 2016-2030F
- Figure 136. Japan Steel Wire Market Share, By Form, In USD Billion, 2016-2030F
- Figure 137. Japan Steel Wire Market Share, By End-use, In USD Billion, 2016-2030F
- Figure 138. Australia Steel Wire Market, By Value, In USD Billion, 2016-2030F
- Figure 139. Australia Steel Wire Market, By Volume, In Kilotons, 2016-2030F
- Figure 140. Australia Steel Wire Market Share, By Type, In USD Billion, 2016-2030F
- Figure 141. Australia Steel Wire Market Share, By Size, In USD Billion, 2016-2030F
- Figure 142. Australia Steel Wire Market Share, By Form, In USD Billion, 2016-2030F
- Figure 143. Australia Steel Wire Market Share, By End-use, In USD Billion, 2016-2030F
- Figure 144. Vietnam Steel Wire Market, By Value, In USD Billion, 2016-2030F
- Figure 145. Vietnam Steel Wire Market, By Volume, In Kilotons, 2016-2030F
- Figure 146. Vietnam Steel Wire Market Share, By Type, In USD Billion, 2016-2030F
- Figure 147. Vietnam Steel Wire Market Share, By Size, In USD Billion, 2016-2030F
- Figure 148. Vietnam Steel Wire Market Share, By Form, In USD Billion, 2016-2030F
- Figure 149. Vietnam Steel Wire Market Share, By End-use, In USD Billion, 2016-2030F
- Figure 150. South Korea Steel Wire Market, By Value, In USD Billion, 2016-2030F
- Figure 151. South Korea Steel Wire Market, By Volume, In Kilotons, 2016-2030F
- Figure 152. South Korea Steel Wire Market Share, By Type, In USD Billion, 2016-2030F
- Figure 153. South Korea Steel Wire Market Share, By Size, In USD Billion, 2016-2030F
- Figure 154. South Korea Steel Wire Market Share, By Form, In USD Billion, 2016-2030F
- Figure 155. South Korea Steel Wire Market Share, By End-use, In USD Billion, 2016-2030F
- Figure 156. Indonesia Steel Wire Market, By Value, In USD Billion, 2016-2030F
- Figure 157. Indonesia Steel Wire Market, By Volume, In Kilotons, 2016-2030F
- Figure 158. Indonesia Steel Wire Market Share, By Type, In USD Billion, 2016-2030F
- Figure 159. Indonesia Steel Wire Market Share, By Size, In USD Billion, 2016-2030F
- Figure 160. Indonesia Steel Wire Market Share, By Form, In USD Billion, 2016-2030F
- Figure 161. Indonesia Steel Wire Market Share, By End-use, In USD Billion, 2016-2030F
- Figure 162. Philippines Steel Wire Market, By Value, In USD Billion, 2016-2030F
- Figure 163. Philippines Steel Wire Market, By Volume, In Kilotons, 2016-2030F
- Figure 164. Philippines Steel Wire Market Share, By Type, In USD Billion, 2016-2030F
- Figure 165. Philippines Steel Wire Market Share, By Size, In USD Billion, 2016-2030F
- Figure 166. Philippines Steel Wire Market Share, By Form, In USD Billion, 2016-2030F
- Figure 167. Philippines Steel Wire Market Share, By End-use, In USD Billion, 2016-2030F
- Figure 168. Middle East & Africa Steel Wire Market, By Value, In USD Billion, 2016-2030F
- Figure 169. Middle East & Africa Steel Wire Market, By Volume, In Kilotons, 2016-2030F
- Figure 170. Middle East & Africa Steel Wire Market Share, By Type, In USD Billion, 2016-2030F
- Figure 171. Middle East & Africa Steel Wire Market Share, By Size, In USD Billion, 2016-2030F
- Figure 172. Middle East & Africa Steel Wire Market Share, By Form, In USD Billion, 2016-2030F
- Figure 173. Middle East & Africa Steel Wire Market Share, By End-use, In USD Billion, 2016-2030F
- Figure 174. Middle East & Africa Steel Wire Market Share, By Country, In USD Billion, 2016-2030F
- Figure 175. Saudi Arabia Steel Wire Market, By Value, In USD Billion, 2016-2030F
- Figure 176. Saudi Arabia Steel Wire Market, By Volume, In Kilotons, 2016-2030F
- Figure 177. Saudi Arabia Steel Wire Market Share, By Type, In USD Billion, 2016-2030F
- Figure 178. Saudi Arabia Steel Wire Market Share, By Size, In USD Billion, 2016-2030F
- Figure 179. Saudi Arabia Steel Wire Market Share, By Form, In USD Billion, 2016-2030F
- Figure 180. Saudi Arabia Steel Wire Market Share, By End-use, In USD Billion, 2016-2030F
- Figure 181. UAE Steel Wire Market, By Value, In USD Billion, 2016-2030F
- Figure 182. UAE Steel Wire Market, By Volume, In Kilotons, 2016-2030F
- Figure 183. UAE Steel Wire Market Share, By Type, In USD Billion, 2016-2030F
- Figure 184. UAE Steel Wire Market Share, By Size, In USD Billion, 2016-2030F
- Figure 185. UAE Steel Wire Market Share, By Form, In USD Billion, 2016-2030F
- Figure 186. UAE Steel Wire Market Share, By End-use, In USD Billion, 2016-2030F
- Figure 187. South Africa Steel Wire Market, By Value, In USD Billion, 2016-2030F
- Figure 188. South Africa Steel Wire Market, By Volume, In Kilotons, 2016-2030F
- Figure 189. South Africa Steel Wire Market Share, By Type, In USD Billion, 2016-2030F
- Figure 190. South Africa Steel Wire Market Share, By Size, In USD Billion, 2016-2030F
- Figure 191. South Africa Steel Wire Market Share, By Form, In USD Billion, 2016-2030F
- Figure 192. South Africa Steel Wire Market Share, By End-use, In USD Billion, 2016-2030F
- Figure 193. By Type Map-Market Size (USD Billion) & Growth Rate (%), 2022
- Figure 194. By Size Map-Market Size (USD Billion) & Growth Rate (%), 2022
- Figure 195. By Form Map-Market Size (USD Billion) & Growth Rate (%), 2022
- Figure 196. By End-use Map-Market Size (USD Billion) & Growth Rate (%), 2022
- Figure 197. By Region Map-Market Size (USD Billion) & Growth Rate (%), 2022
Global steel wire market size was valued at USD 106.49 billion in 2022, which is expected to grow to USD 133.85 billion in 2030, with a CAGR of 2.9% during the forecast period between 2023 and 2030. Asia-Pacific dominates this market due to the strong demand from huge construction and automotive sectors in countries such as China and India. Carbon Steel is the most dominant type of steel wire due to its vast application in the construction and automotive sectors, along with its high recyclability.
The steel wire market thrives on a multitude of drivers that fuel its demand and growth across various industries globally. One significant driver is the steady expansion of the construction industry. This surge in construction activities fuels a consistent and strong demand for wire products, anchoring the steel wire market's growth. Moreover, the automotive sector plays a pivotal role in propelling the demand for steel wire. The increase in vehicle production, accompanied by technological advancements, directly impacts this demand. Steel wire finds extensive use in tire cords, springs, and an array of components within vehicles, contributing to their stability and safety. Lastly, the industrial manufacturing sector heavily relies on steel wire in the production of machinery, equipment, and various industrial goods, which also drives the market.
Increasing Automotive Sales to Improve the Demand for Steel Wire
The expansion of the automotive sector significantly influences the demand for steel wire across various facets of vehicle manufacturing. Steel wire is a critical component in reinforcing vehicle tires. It provides strength and stability, contributing to the overall durability and safety of tires. Additionally, various safety components within vehicles, such as seatbelt springs and airbag systems, often rely on steel wire due to its strength and reliability. Moreover, steel wire finds application in multiple vehicle components, from exhaust systems to door latches and seating mechanisms.
For instance, in 2022, the Federation of Automobile Dealers Associations recorded retail sales of 2.21 crore vehicles. Globally, the automotive sector experienced a 15.28% surge in volumes compared to the 1,83,21,760 units sold in 2021. This increase in automotive production raises the demand for steel wire globally.
Rise in Construction Projects to Drive the Steel Wire Market
The robust growth of the construction industry, particularly in emerging economies, is pivotal in propelling the demand for steel wire. Its primary application lies in reinforcing concrete structures, which is fundamental in creating durable and resilient constructions. This surge in construction projects results in an increased and sustained demand for various wire products. Steel wire's role in enhancing the strength and structural integrity of buildings and infrastructure solidifies its position as a crucial component in meeting the demands of this burgeoning construction landscape.
For instance, several of the United States' most significant construction projects are poised to reach major developmental milestones in 2023. Ranging in cost from the hundreds of millions to the tens of billions. Among them are an NFL stadium, a substantial airport expansion, and an expansive manufacturing plant. Construction projects globally will increase the demand for steel wire during the forecast period.
Surge in Energy Projects Globally to Increase Steel Wire Requirements
Steel wire has an important role in powering the energy sector, particularly in facilitating power transmission across vast distances. Its use in cables for power transmission ensures the reliable and efficient distribution of electricity, an essential component in meeting the world's energy demands. Additionally, within the realm of oil & gas exploration, steel wire serves in various critical applications. It's integral in supporting the exploration process, aiding in the extraction and transportation of these valuable resources.
For instance, in 2022, renewables accounted for 40 percent of global installed power capacity and saw the largest year-on-year increase (at almost 295 GW). This surge in investments carries with it an expectation of returns which further contributes to increase in number of developing projects globally, which in turn drives the steel wire market.
Impact of COVID-19
The COVID-19 pandemic caused disruptions in global supply chains, impacting the production and distribution of steel and its raw materials. This led to delays and shortages in the steel supply chain due to factory closures and transportation restrictions. Lockdowns and economic slowdowns reduced demand across multiple sectors, such as construction, automotive, and aviation. Consequently, the market for steel, including steel wire, weakened due to this decreased demand for steel products. The steel wire market saw fluctuating prices during the pandemic due to supply and demand disruptions.
Impact of Russia Ukraine War
The Russia-Ukraine conflict significantly affected the steel wire market, particularly due to Russia's substantial supply of upstream raw nickel to various countries, notably European nations. The conflict prompted several European countries to impose import bans on Russian goods, tightening the supply of steel wire in these markets. This led to increased production costs for steel wire in these nations, subsequently reducing procurement activity. However, the conflict triggered a global shift in the distribution of oil and gas, leading to new oil & gas construction that increased the demand for steel wire.
Key Players Landscape and Outlook
Prominent steel wire manufacturers are expanding their production capabilities in response to the escalating demand, aiming to fulfill the growing market needs for sectors such as construction and automotive. This proactive step involves augmenting their manufacturing capacities to ensure they can meet the increasing requirements within the industry.
For instance, Van Merksteijn has revealed its intentions to construct a new wire rod mill in the Netherlands, set to commence construction this year. The projected commencement of production is aimed for 2024, involving an estimated investment of USD 344 million.
Table of Contents
1. Research Methodology
2. Project Scope & Definitions
3. Impact of COVID-19 on Steel Wire Market
4. Impact of Russian Ukraine War
5. Executive Summary
6. Voice of Customer
- 6.1. Market Awareness and Product Information
- 6.2. Brand Awareness and Loyalty
- 6.3. Factors Considered in Purchase Decision
- 6.3.1. Brand Name
- 6.3.2. Quality
- 6.3.3. Quantity
- 6.3.4. Price
- 6.3.5. Product Specification
- 6.3.6. Application Specification
- 6.3.7. Availability of Product
- 6.4. Frequency of Purchase
- 6.5. Medium of Purchase
7. Steel Wire Market Outlook, 2016-2030F
- 7.1. Market Size & Forecast
- 7.1.1. By Value
- 7.1.2. By Volume
- 7.2. By Type
- 7.2.1. Carbon Steel
- 7.2.2. Stainless Steel
- 7.2.3. Galvanized Steel
- 7.2.4. Coated Steel
- 7.2.5. Alloy Steel
- 7.2.6. Others
- 7.3. By Size
- 7.3.1. 2.75 to 6mm
- 7.3.2. 6.1 to 12mm
- 7.3.3. Others
- 7.4. By Form
- 7.4.1. Rope
- 7.4.2. Non-rope
- 7.5. By End-use
- 7.5.1. Construction
- 7.5.2. Transportation
- 7.5.2.1. Automotive
- 7.5.2.2. Aviation
- 7.5.2.3. Marine
- 7.5.2.4. Others
- 7.5.3. Industrial
- 7.5.3.1. Mining
- 7.5.3.2. Manufacturing
- 7.5.3.3. Telecommunication
- 7.5.3.4. Others
- 7.5.4. Agricultural
- 7.5.5. Others
- 7.6. By Region
- 7.6.1. North America
- 7.6.2. Europe
- 7.6.3. South America
- 7.6.4. Asia-Pacific
- 7.6.5. Middle East and Africa
- 7.7. By Company Market Share (%), 2022
8. Steel Wire Market Outlook, By Region, 2016-2030F
- 8.1. North America*
- 8.1.1. Market Size & Forecast
- 8.1.1.1. By Value
- 8.1.1.2. By Volume
- 8.1.2. By Type
- 8.1.2.1. Carbon Steel
- 8.1.2.2. Stainless Steel
- 8.1.2.3. Galvanized Steel
- 8.1.2.4. Coated Steel
- 8.1.2.5. Alloy Steel
- 8.1.2.6. Others
- 8.1.3. By Size
- 8.1.3.1. 2.75 to 6mm
- 8.1.3.2. 6.1 to 12mm
- 8.1.3.3. Others
- 8.1.4. By Form
- 8.1.4.1. Rope
- 8.1.4.2. Non-rope
- 8.1.5. By End-use
- 8.1.5.1. Construction
- 8.1.5.2. Transportation
- 8.1.5.2.1. Automotive
- 8.1.5.2.2. Aviation
- 8.1.5.2.3. Marine
- 8.1.5.2.4. Others
- 8.1.5.3. Industrial
- 8.1.5.3.1. Mining
- 8.1.5.3.2. Manufacturing
- 8.1.5.3.3. Telecommunication
- 8.1.5.3.4. Others
- 8.1.5.4. Agricultural
- 8.1.5.5. Others
- 8.1.6. United States*
- 8.1.6.1. Market Size & Forecast
- 8.1.6.1.1. By Value
- 8.1.6.1.2. By Volume
- 8.1.6.2. By Type
- 8.1.6.2.1. Carbon Steel
- 8.1.6.2.2. Stainless Steel
- 8.1.6.2.3. Galvanized Steel
- 8.1.6.2.4. Coated Steel
- 8.1.6.2.5. Alloy Steel
- 8.1.6.2.6. Others
- 8.1.6.3. By Size
- 8.1.6.3.1. 2.75 to 6mm
- 8.1.6.3.2. 6.1 to 12mm
- 8.1.6.3.3. Others
- 8.1.6.4. By Form
- 8.1.6.4.1. Rope
- 8.1.6.4.2. Non-rope
- 8.1.6.5. By End-use
- 8.1.6.5.1. Construction
- 8.1.6.5.2. Transportation
- 8.1.6.5.2.1. Automotive
- 8.1.6.5.2.2. Aviation
- 8.1.6.5.2.3. Marine
- 8.1.6.5.2.4. Others
- 8.1.6.5.3. Industrial
- 8.1.6.5.3.1. Mining
- 8.1.6.5.3.2. Manufacturing
- 8.1.6.5.3.3. Telecommunication
- 8.1.6.5.3.4. Others
- 8.1.6.5.4. Agricultural
- 8.1.6.5.5. Others
- 8.1.1. Market Size & Forecast
All segments will be provided for all regions and countries covered:
- 8.1.7. Canada
- 8.1.8. Mexico
- 8.2. Europe
- 8.2.1. Germany
- 8.2.2. France
- 8.2.3. Italy
- 8.2.4. United Kingdom
- 8.2.5. Russia
- 8.2.6. Netherlands
- 8.2.7. Spain
- 8.2.8. Turkey
- 8.2.9. Poland
- 8.3. South America
- 8.3.1. Brazil
- 8.3.2. Argentina
- 8.4. Asia-Pacific
- 8.4.1. India
- 8.4.2. China
- 8.4.3. Japan
- 8.4.4. Australia
- 8.4.5. Vietnam
- 8.4.6. South Korea
- 8.4.7. Indonesia
- 8.4.8. Philippines
- 8.5. Middle East & Africa
- 8.5.1. Saudi Arabia
- 8.5.2. UAE
- 8.5.3. South Africa
9. Supply Side Analysis
- 9.1. Capacity, By Company
- 9.2. Production, By Company
- 9.3. Operating Efficiency, By Company
- 9.4. Key Plant Locations (Up to 25)
10. Market Mapping, 2022
- 10.1. By Type
- 10.2. By Size
- 10.3. By Form
- 10.4. By End-use
- 10.5. By Region
11. Macro Environment and Industry Structure
- 11.1. Supply Demand Analysis
- 11.2. Import Export Analysis - Volume and Value
- 11.3. Supply/Value Chain Analysis
- 11.4. PESTEL Analysis
- 11.4.1. Political Factors
- 11.4.2. Economic System
- 11.4.3. Social Implications
- 11.4.4. Technological Advancements
- 11.4.5. Environmental Impacts
- 11.4.6. Legal Compliances and Regulatory Policies (Statutory Bodies Included)
- 11.5. Porter's Five Forces Analysis
- 11.5.1. Supplier Power
- 11.5.2. Buyer Power
- 11.5.3. Substitution Threat
- 11.5.4. Threat from New Entrant
- 11.5.5. Competitive Rivalry
12. Market Dynamics
- 12.1. Growth Drivers
- 12.2. Growth Inhibitors (Challenges, Restraints)
13. Key Players Landscape
- 13.1. Competition Matrix of Top Five Market Leaders
- 13.2. Market Revenue Analysis of Top Five Market Leaders (in %, 2022)
- 13.3. Mergers and Acquisitions/Joint Ventures (If Applicable)
- 13.4. SWOT Analysis (For Five Market Players)
- 13.5. Patent Analysis (If Applicable)
14. Pricing Analysis
15. Case Studies
16. Key Players Outlook
- 16.1. ArcelorMittal
- 16.1.1. Company Details
- 16.1.2. Key Management Personnel
- 16.1.3. Products & Services
- 16.1.4. Financials (As reported)
- 16.1.5. Key Market Focus & Geographical Presence
- 16.1.6. Recent Developments
- 16.2. Bekaert
- 16.3. JFE Steel Corporation
- 16.4. KOBE STEEL, LTD
- 16.5. Van Merksteijn International
- 16.6. LIBERTY Steel Group
- 16.7. NIPPON STEEL CORPORATION
- 16.8. Tata Steel
- 16.9. Henan Hengxing Science & Technology Co., Ltd
- 16.10. Tianjin Huayuan Metal Wire Products Co.Ltd
Companies mentioned above DO NOT hold any order as per market share and can be changed as per information available during research work.