|
|
市場調査レポート
商品コード
1373592
ソーラーパネルリサイクルの世界市場:タイプ別、材料別、プロセス別、地域別、機会、予測、2016年~2030年Solar Panel Recycle Market Assessment, By Type, By Material, By Process, By Region, Opportunities and Forecasts, 2016-2030F |
||||||
|
|
|||||||
カスタマイズ可能
|
|||||||


| ソーラーパネルリサイクルの世界市場:タイプ別、材料別、プロセス別、地域別、機会、予測、2016年~2030年 |
|
出版日: 2023年11月03日
発行: Markets & Data
ページ情報: 英文 142 Pages
納期: 3~5営業日
|

- 全表示
- 概要
- 図表
- 目次
世界のソーラーパネルリサイクルの市場規模は、2022年に1億5,250万米ドルとなりました。同市場は、2023年~2030年の予測期間に12.65%のCAGRで拡大し、2030年には3億9,548万米ドルに達すると予測されています。太陽エネルギーソリューションの世界的普及により、廃棄されるソーラーパネルが増加し、重要なリサイクル市場が形成されています。2030年までに、使用済みパネルから回収可能な原材料は世界で4億5,000万米ドルになると推定されています。ソーラーパネルをリサイクル施設に再配置することで、埋立地のスペースを節約し、原材料の価値を最大化することができます。ソーラーパネル廃棄物のリサイクル市場は、厳しい環境規制と持続可能な慣行に対する意識の高まりにより拡大しています。リサイクル技術の進歩は効率と費用対効果を高める一方、政府は環境への影響を軽減するために適切な廃棄とリサイクルを奨励しています。特に中国やインドなどの国々では、都市化と工業化が進み、市場は高いペースで拡大しています。加えて、循環型経済原則の採用。住宅や商業分野での太陽エネルギーの人気の高まりや、ソーラーパネルのリサイクルに対する有利な規制政策の増加が、市場拡大を後押ししています。
使用済みソーラーパネルの量が増加していることが、世界のソーラーパネルリサイクル市場の注目度を高める原動力となっています。世界的に太陽光発電の導入が急増する中、耐用年数を迎える太陽光発電システムの数が増加しており、その結果、廃棄されるソーラーパネルが大量に流入しています。この量の急増により、電子廃棄物を責任を持って管理するための、効果的かつ持続可能なリサイクルソリューションが必要とされています。国際再生可能エネルギー機関(IRENA)の予測によると、効果的なリサイクル対策がない場合、世界のソーラーパネル廃棄物は2050年までに7,800万トンに達すると予想されています。
ソーラーパネルのリサイクルを増やし、廃棄物を減らすことに焦点を当てた様々な政府規制や取り組みが、世界のソーラーパネルリサイクル市場を後押ししています。市場は、太陽エネルギーの導入、ひいてはソーラーパネルのリサイクルを奨励するために政府が提供する財政的インセンティブや補助金によって利益を得ています。例えば、米国政府のバイデン政権は2022年7月、エネルギー省(DOE)を通じて、太陽電池モジュールの国内製造とリサイクルを促進するために5,600万米ドルの割り当てを発表しました。さらにDOEは、同省が支援する技術の商業化を妨げる障害に対処するため、1,800万米ドルの追加配分を約束しました。
世界のソーラーパネルリサイクル市場は、各国の積極的な貢献により大きな成長を遂げています。太陽光発電容量の拡大で突出したリーダーである中国は、その大規模な設置を通じて市場の需要を刺激するだけでなく、使用済みソーラーパネルの急増を生み出し、リサイクルソリューションの必要性を高めています。この需要は、中国の第14次再生可能エネルギー5カ年計画で設定された野心的な目標によってさらに促進されています。
欧州連合(EU)では、太陽光発電の急速な普及と、REPowerEU計画やグリーン・ディール産業計画などのイニシアティブに示された厳しい環境規制が、世界のソーラーパネルリサイクルの状況を大きく形作っています。持続可能性と循環型経済の原則に対するEUの揺るぎないコミットメントが、リサイクルサービスと技術に対する需要の増加を後押ししています。これらをはじめとする各国の太陽エネルギー導入促進とリサイクル政策促進への取り組みが相乗効果を発揮し、世界のソーラーパネルリサイクル市場の成長を促しています。持続可能性の重要性に対する世界の認識が高まり続ける中、ソーラーパネルリサイクルの需要は上昇基調を維持する見通しです。
当レポートでは、世界のソーラーパネルリサイクル市場について調査し、市場の概要とともに、タイプ別、材料別、プロセス別、地域別動向、および市場に参入する企業のプロファイルなどを提供しています。
目次
第1章 調査手法
第2章 プロジェクトの範囲と定義
第3章 COVID-19が世界のソーラーパネルリサイクル市場に与える影響
第4章 ロシア・ウクライナ戦争の影響
第5章 エグゼクティブサマリー
第6章 世界のソーラーパネルリサイクル市場の見通し、2016年~2030年
第7章 世界のソーラーパネルリサイクル市場の地域別見通し、2016年~2030年
- 北米
- 欧州
- 南米
- アジア太平洋
- 中東・アフリカ
第8章 供給サイド分析
第9章 市場マッピング、2022年
第10章 マクロ環境と産業構造
- 需給分析
- 輸出入分析- 量と金額
- 供給/バリューチェーン分析
- PESTEL分析
- ポーターのファイブフォース分析
第11章 市場力学
第12章 主要参入企業の情勢
第13章 価格分析
第14章 ケーススタディ
第15章 主要企業の見通し
- First Solar Inc
- SunPower Corporation
- Hanwha Group
- Echo Environmental, LLC
- Reclaim PV Pty Ltd.
- PV Industries Pty Ltd.
- Veolia Environnement S.A.
- JinkoSolar Holding Co., Ltd.
- Poseidon Solar Services Pvt Ltd
- Reiling GmbH & Co. KG
- Yingli Green Energy Holding Company Limited
第16章 戦略的提言
第17章 お問合せと免責事項
List of Tables
- Table 1. Pricing Analysis of Products from Key Players
- Table 2. Competition Matrix of Top 5 Market Leaders
- Table 3. Mergers & Acquisitions/ Joint Ventures (If Applicable)
- Table 4. About Us - Regions and Countries Where We Have Executed Client Projects
List of Figures
- Figure 1. Global Solar Panel Recycle Market, By Value, in USD Million, 2016-2030F
- Figure 2. Global Solar Panel Recycle Market, By Volume, in Million Units, 2016-2030F
- Figure 3. Global Solar Panel Recycle Market Share, By Type, in USD Million, 2016-2030F
- Figure 4. Global Solar Panel Recycle Market Share, By Material, in USD Million, 2016-2030F
- Figure 5. Global Solar Panel Recycle Market Share, By Process, in USD Million, 2016-2030F
- Figure 6. Global Solar Panel Recycle Market Share, By Region, in USD Million, 2016-2030F
- Figure 7. North America Solar Panel Recycle Market, By Value, in USD Million, 2016-2030F
- Figure 8. North America Solar Panel Recycle Market, By Volume, in Million Units, 2016-2030F
- Figure 9. North America Solar Panel Recycle Market Share, By Type, in USD Million, 2016-2030F
- Figure 10. North America Solar Panel Recycle Market Share, By Material, in USD Million, 2016-2030F
- Figure 11. North America Solar Panel Recycle Market Share, By Process, in USD Million, 2016-2030F
- Figure 12. North America Solar Panel Recycle Market Share, By Country, in USD Million, 2016-2030F
- Figure 13. United States Solar Panel Recycle Market, By Value, in USD Million, 2016-2030F
- Figure 14. United States Solar Panel Recycle Market, By Volume, in Million Units, 2016-2030F
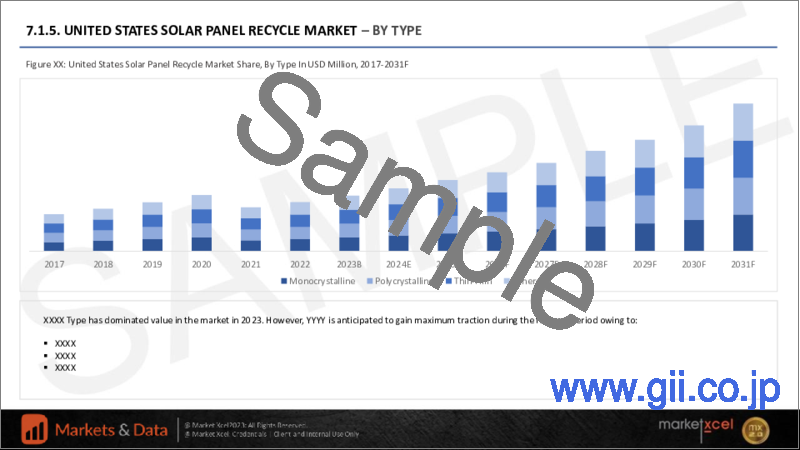
- Figure 15. United States Solar Panel Recycle Market Share, By Type, in USD Million, 2016-2030F
- Figure 16. United States Solar Panel Recycle Market Share, By Material, in USD Million, 2016-2030F
- Figure 17. United States Solar Panel Recycle Market Share, By Process, in USD Million, 2016-2030F
- Figure 18. Canada Solar Panel Recycle Market, By Value, in USD Million, 2016-2030F
- Figure 19. Canada Solar Panel Recycle Market, By Volume, in Million Units, 2016-2030F
- Figure 20. Canada Solar Panel Recycle Market Share, By Type, in USD Million, 2016-2030F
- Figure 21. Canada Solar Panel Recycle Market Share, By Material, in USD Million, 2016-2030F
- Figure 22. Canada Solar Panel Recycle Market Share, By Process, in USD Million, 2016-2030F
- Figure 23. Mexico Solar Panel Recycle Market, By Value, in USD Million, 2016-2030F
- Figure 24. Mexico Solar Panel Recycle Market, By Volume, in Million Units, 2016-2030F
- Figure 25. Mexico Solar Panel Recycle Market Share, By Type, in USD Million, 2016-2030F
- Figure 26. Mexico Solar Panel Recycle Market Share, By Material, in USD Million, 2016-2030F
- Figure 27. Mexico Solar Panel Recycle Market Share, By Process, in USD Million, 2016-2030F
- Figure 28. Europe Solar Panel Recycle Market, By Value, in USD Million, 2016-2030F
- Figure 29. Europe Solar Panel Recycle Market, By Volume, in Million Units, 2016-2030F
- Figure 30. Europe Solar Panel Recycle Market Share, By Type, in USD Million, 2016-2030F
- Figure 31. Europe Solar Panel Recycle Market Share, By Material, in USD Million, 2016-2030F
- Figure 32. Europe Solar Panel Recycle Market Share, By Process, in USD Million, 2016-2030F
- Figure 33. Europe Solar Panel Recycle Market Share, By Country, in USD Million, 2016-2030F
- Figure 34. Germany Solar Panel Recycle Market, By Value, in USD Million, 2016-2030F
- Figure 35. Germany Solar Panel Recycle Market, By Volume, in Million Units, 2016-2030F
- Figure 36. Germany Solar Panel Recycle Market Share, By Type, in USD Million, 2016-2030F
- Figure 37. Germany Solar Panel Recycle Market Share, By Material, in USD Million, 2016-2030F
- Figure 38. Germany Solar Panel Recycle Market Share, By Process, in USD Million, 2016-2030F
- Figure 39. France Solar Panel Recycle Market, By Value, in USD Million, 2016-2030F
- Figure 40. France Solar Panel Recycle Market, By Volume, in Million Units, 2016-2030F
- Figure 41. France Solar Panel Recycle Market Share, By Type, in USD Million, 2016-2030F
- Figure 42. France Solar Panel Recycle Market Share, By Material, in USD Million, 2016-2030F
- Figure 43. France Solar Panel Recycle Market Share, By Process, in USD Million, 2016-2030F
- Figure 44. Italy Solar Panel Recycle Market, By Value, in USD Million, 2016-2030F
- Figure 45. Italy Solar Panel Recycle Market, By Volume, in Million Units, 2016-2030F
- Figure 46. Italy Solar Panel Recycle Market Share, By Type, in USD Million, 2016-2030F
- Figure 47. Italy Solar Panel Recycle Market Share, By Material, in USD Million, 2016-2030F
- Figure 48. Italy Solar Panel Recycle Market Share, By Process, in USD Million, 2016-2030F
- Figure 49. United Kingdom Solar Panel Recycle Market, By Value, in USD Million, 2016-2030F
- Figure 50. United Kingdom Solar Panel Recycle Market, By Volume, in Million Units, 2016-2030F
- Figure 51. United Kingdom Solar Panel Recycle Market Share, By Type, in USD Million, 2016-2030F
- Figure 52. United Kingdom Solar Panel Recycle Market Share, By Material, in USD Million, 2016-2030F
- Figure 53. United Kingdom Solar Panel Recycle Market Share, By Process, in USD Million, 2016-2030F
- Figure 54. Russia Solar Panel Recycle Market, By Value, in USD Million, 2016-2030F
- Figure 55. Russia Solar Panel Recycle Market, By Volume, in Million Units, 2016-2030F
- Figure 56. Russia Solar Panel Recycle Market Share, By Type, in USD Million, 2016-2030F
- Figure 57. Russia Solar Panel Recycle Market Share, By Material, in USD Million, 2016-2030F
- Figure 58. Russia Solar Panel Recycle Market Share, By Process, in USD Million, 2016-2030F
- Figure 59. Netherlands Solar Panel Recycle Market, By Value, in USD Million, 2016-2030F
- Figure 60. Netherlands Solar Panel Recycle Market, By Volume, in Million Units, 2016-2030F
- Figure 61. Netherlands Solar Panel Recycle Market Share, By Type, in USD Million, 2016-2030F
- Figure 62. Netherlands Solar Panel Recycle Market Share, By Material, in USD Million, 2016-2030F
- Figure 63. Netherlands Solar Panel Recycle Market Share, By Process, in USD Million, 2016-2030F
- Figure 64. Spain Solar Panel Recycle Market, By Value, in USD Million, 2016-2030F
- Figure 65. Spain Solar Panel Recycle Market, By Volume, in Million Units, 2016-2030F
- Figure 66. Spain Solar Panel Recycle Market Share, By Type, in USD Million, 2016-2030F
- Figure 67. Spain Solar Panel Recycle Market Share, By Material, in USD Million, 2016-2030F
- Figure 68. Spain Solar Panel Recycle Market Share, By Process, in USD Million, 2016-2030F
- Figure 69. Turkey Solar Panel Recycle Market, By Value, in USD Million, 2016-2030F
- Figure 70. Turkey Solar Panel Recycle Market, By Volume, in Million Units, 2016-2030F
- Figure 71. Turkey Solar Panel Recycle Market Share, By Type, in USD Million, 2016-2030F
- Figure 72. Turkey Solar Panel Recycle Market Share, By Material, in USD Million, 2016-2030F
- Figure 73. Turkey Solar Panel Recycle Market Share, By Process, in USD Million, 2016-2030F
- Figure 74. Poland Solar Panel Recycle Market, By Value, in USD Million, 2016-2030F
- Figure 75. Poland Solar Panel Recycle Market, By Volume, in Million Units, 2016-2030F
- Figure 76. Poland Solar Panel Recycle Market Share, By Type, in USD Million, 2016-2030F
- Figure 77. Poland Solar Panel Recycle Market Share, By Material, in USD Million, 2016-2030F
- Figure 78. Poland Solar Panel Recycle Market Share, By Process, in USD Million, 2016-2030F
- Figure 79. South America Solar Panel Recycle Market, By Value, in USD Million, 2016-2030F
- Figure 80. South America Solar Panel Recycle Market, By Volume, in Million Units, 2016-2030F
- Figure 81. South America Solar Panel Recycle Market Share, By Type, in USD Million, 2016-2030F
- Figure 82. South America Solar Panel Recycle Market Share, By Material, in USD Million, 2016-2030F
- Figure 83. South America Solar Panel Recycle Market Share, By Process, in USD Million, 2016-2030F
- Figure 84. South America Solar Panel Recycle Market Share, By Country, in USD Million, 2016-2030F
- Figure 85. Brazil Solar Panel Recycle Market, By Value, in USD Million, 2016-2030F
- Figure 86. Brazil Solar Panel Recycle Market, By Volume, in Million Units, 2016-2030F
- Figure 87. Brazil Solar Panel Recycle Market Share, By Type, in USD Million, 2016-2030F
- Figure 88. Brazil Solar Panel Recycle Market Share, By Material, in USD Million, 2016-2030F
- Figure 89. Brazil Solar Panel Recycle Market Share, By Process, in USD Million, 2016-2030F
- Figure 90. Argentina Solar Panel Recycle Market, By Value, in USD Million, 2016-2030F
- Figure 91. Argentina Solar Panel Recycle Market, By Volume, in Million Units, 2016-2030F
- Figure 92. Argentina Solar Panel Recycle Market Share, By Type, in USD Million, 2016-2030F
- Figure 93. Argentina Solar Panel Recycle Market Share, By Material, in USD Million, 2016-2030F
- Figure 94. Argentina Solar Panel Recycle Market Share, By Process, in USD Million, 2016-2030F
- Figure 95. Asia-Pacific Solar Panel Recycle Market, By Value, in USD Million, 2016-2030F
- Figure 96. Asia-Pacific Solar Panel Recycle Market, By Volume, in Million Units, 2016-2030F
- Figure 97. Asia-Pacific Solar Panel Recycle Market Share, By Type, in USD Million, 2016-2030F
- Figure 98. Asia-Pacific Solar Panel Recycle Market Share, By Material, in USD Million, 2016-2030F
- Figure 99. Asia-Pacific Solar Panel Recycle Market Share, By Process, in USD Million, 2016-2030F
- Figure 100. Asia-Pacific Solar Panel Recycle Market Share, By Country, in USD Million, 2016-2030F
- Figure 101. India Solar Panel Recycle Market, By Value, in USD Million, 2016-2030F
- Figure 102. India Solar Panel Recycle Market, By Volume, in Million Units, 2016-2030F
- Figure 103. India Solar Panel Recycle Market Share, By Type, in USD Million, 2016-2030F
- Figure 104. India Solar Panel Recycle Market Share, By Material, in USD Million, 2016-2030F
- Figure 105. India Solar Panel Recycle Market Share, By Process, in USD Million, 2016-2030F
- Figure 106. China Solar Panel Recycle Market, By Value, in USD Million, 2016-2030F
- Figure 107. China Solar Panel Recycle Market, By Volume, in Million Units, 2016-2030F
- Figure 108. China Solar Panel Recycle Market Share, By Type, in USD Million, 2016-2030F
- Figure 109. China Solar Panel Recycle Market Share, By Material, in USD Million, 2016-2030F
- Figure 110. China Solar Panel Recycle Market Share, By Process, in USD Million, 2016-2030F
- Figure 111. Japan Solar Panel Recycle Market, By Value, in USD Million, 2016-2030F
- Figure 112. Japan Solar Panel Recycle Market, By Volume, in Million Units, 2016-2030F
- Figure 113. Japan Solar Panel Recycle Market Share, By Type, in USD Million, 2016-2030F
- Figure 114. Japan Solar Panel Recycle Market Share, By Material, in USD Million, 2016-2030F
- Figure 115. Japan Solar Panel Recycle Market Share, By Process, in USD Million, 2016-2030F
- Figure 116. Australia Solar Panel Recycle Market, By Value, in USD Million, 2016-2030F
- Figure 117. Australia Solar Panel Recycle Market, By Volume, in Million Units, 2016-2030F
- Figure 118. Australia Solar Panel Recycle Market Share, By Type, in USD Million, 2016-2030F
- Figure 119. Australia Solar Panel Recycle Market Share, By Material, in USD Million, 2016-2030F
- Figure 120. Australia Solar Panel Recycle Market Share, By Process, in USD Million, 2016-2030F
- Figure 121. Vietnam Solar Panel Recycle Market, By Value, in USD Million, 2016-2030F
- Figure 122. Vietnam Solar Panel Recycle Market, By Volume, in Million Units, 2016-2030F
- Figure 123. Vietnam Solar Panel Recycle Market Share, By Type, in USD Million, 2016-2030F
- Figure 124. Vietnam Solar Panel Recycle Market Share, By Material, in USD Million, 2016-2030F
- Figure 125. Vietnam Solar Panel Recycle Market Share, By Process, in USD Million, 2016-2030F
- Figure 126. South Korea Solar Panel Recycle Market, By Value, in USD Million, 2016-2030F
- Figure 127. South Korea Solar Panel Recycle Market, By Volume, in Million Units, 2016-2030F
- Figure 128. South Korea Solar Panel Recycle Market Share, By Type, in USD Million, 2016-2030F
- Figure 129. South Korea Solar Panel Recycle Market Share, By Material, in USD Million, 2016-2030F
- Figure 130. South Korea Solar Panel Recycle Market Share, By Process, in USD Million, 2016-2030F
- Figure 131. Indonesia Solar Panel Recycle Market, By Value, in USD Million, 2016-2030F
- Figure 132. Indonesia Solar Panel Recycle Market, By Volume, in Million Units, 2016-2030F
- Figure 133. Indonesia Solar Panel Recycle Market Share, By Type, in USD Million, 2016-2030F
- Figure 134. Indonesia Solar Panel Recycle Market Share, By Material, in USD Million, 2016-2030F
- Figure 135. Indonesia Solar Panel Recycle Market Share, By Process, in USD Million, 2016-2030F
- Figure 136. Philippines Solar Panel Recycle Market, By Value, in USD Million, 2016-2030F
- Figure 137. Philippines Solar Panel Recycle Market, By Volume, in Million Units, 2016-2030F
- Figure 138. Philippines Solar Panel Recycle Market Share, By Type, in USD Million, 2016-2030F
- Figure 139. Philippines Solar Panel Recycle Market Share, By Material, in USD Million, 2016-2030F
- Figure 140. Philippines Solar Panel Recycle Market Share, By Process, in USD Million, 2016-2030F
- Figure 141. Middle East & Africa Solar Panel Recycle Market, By Value, in USD Million, 2016-2030F
- Figure 142. Middle East & Africa Solar Panel Recycle Market, By Volume, in Million Units, 2016-2030F
- Figure 143. Middle East & Africa Solar Panel Recycle Market Share, By Type, in USD Million, 2016-2030F
- Figure 144. Middle East & Africa Solar Panel Recycle Market Share, By Material, in USD Million, 2016-2030F
- Figure 145. Middle East & Africa Solar Panel Recycle Market Share, By Process, in USD Million, 2016-2030F
- Figure 146. Middle East & Africa Solar Panel Recycle Market Share, By Country, in USD Million, 2016-2030F
- Figure 147. Saudi Arabia Solar Panel Recycle Market, By Value, in USD Million, 2016-2030F
- Figure 148. Saudi Arabia Solar Panel Recycle Market, By Volume, in Million Units, 2016-2030F
- Figure 149. Saudi Arabia Solar Panel Recycle Market Share, By Type, in USD Million, 2016-2030F
- Figure 150. Saudi Arabia Solar Panel Recycle Market Share, By Material, in USD Million, 2016-2030F
- Figure 151. Saudi Arabia Solar Panel Recycle Market Share, By Process, in USD Million, 2016-2030F
- Figure 152. UAE Solar Panel Recycle Market, By Value, in USD Million, 2016-2030F
- Figure 153. UAE Solar Panel Recycle Market, By Volume, in Million Units, 2016-2030F
- Figure 154. UAE Solar Panel Recycle Market Share, By Type, in USD Million, 2016-2030F
- Figure 155. UAE Solar Panel Recycle Market Share, By Material, in USD Million, 2016-2030F
- Figure 156. UAE Solar Panel Recycle Market Share, By Process, in USD Million, 2016-2030F
- Figure 157. South Africa Solar Panel Recycle Market, By Value, in USD Million, 2016-2030F
- Figure 158. South Africa Solar Panel Recycle Market, By Volume, in Million Units, 2016-2030F
- Figure 159. South Africa Solar Panel Recycle Market Share, By Type, in USD Million, 2016-2030F
- Figure 160. South Africa Solar Panel Recycle Market Share, By Material, in USD Million, 2016-2030F
- Figure 161. South Africa Solar Panel Recycle Market Share, By Process, in USD Million, 2016-2030F
- Figure 162. By Type Map-Market Size (USD Million) & Growth Rate (%), 2022
- Figure 163. By Material Map-Market Size (USD Million) & Growth Rate (%), 2022
- Figure 164. By Process Map-Market Size (USD Million) & Growth Rate (%), 2022
- Figure 165. By Region Map-Market Size (USD Million) & Growth Rate (%), 2022
Global Solar Panel Recycle Market size was valued at USD 152.5 million in 2022, which is expected to reach USD 395.48 million in 2030 with a CAGR of 12.65% for the forecast period between 2023 and 2030. The global adoption of solar energy solutions has led to a rise in decommissioned solar panels, creating a significant recycling market. By 2030, the global recoverable raw materials from end-of-life panels are estimated to be worth USD 450 million. Reallocating solar panels to recycling facilities conserves landfill space and maximizes raw material value. The recycling market for solar panel waste is expanding due to stringent environmental regulations and growing awareness of sustainable practices. Advancements in recycling technologies enhance efficiency and cost-effectiveness, while governments incentivize proper disposal and recycling to mitigate environmental impact. Rise in urbanization and industrialization, especially in countries like China and India, the market is expanding at a high pace. In addition, the adoption of circular economy principles. The growing popularity of solar energy in residential and commercial sectors and increasing favorable regulatory policies for solar panel recycling are propelling market expansion.
In June 2022, the Board of Executive Directors of the World Bank sanctioned an additional funding of USD 165 million to bolster India's residential sector in the integration of rooftop solar systems, aiming to enhance the affordability of solar energy. The implementation of these solar photovoltaic (PV) installations is anticipated to furnish a sustainable source of clean energy while concurrently mitigating greenhouse gas emissions by substituting fossil fuel-based generation. Projections for the project indicated a substantial reduction in greenhouse gas (GHG) emissions, with an estimated decrease of 13.9 million tons.
Increasing Volume of End-of-Life Solar Panels Contributes to Market Growth
The growing volume of end-of-life solar panels is a driving force behind the growing prominence of the global solar panel recycle market. As solar energy adoption surges globally, an increasing number of photovoltaic systems are reaching the end of their operational life, resulting in a substantial influx of decommissioned solar panels. This surge in volume necessitates effective and sustainable recycling solutions to manage electronic waste responsibly. According to projections by the International Renewable Energy Agency (IRENA), global solar panel waste is anticipated to accumulate to 78 million tons by 2050 in the absence of effective recycling measures.
The demand for recycling services is stimulated by both environmental concerns and regulatory requirements, compelling stakeholders to seek innovative technologies and processes for efficient solar panel disposal. This trend addresses the environmental impact of improper waste management and fosters the development of a robust and sustainable solar industry.
Government Policies are Supporting the Market
A variety of government regulations and efforts focused on increasing Solar Panel Recycle and decreasing waste are propelling the worldwide solar panel recycling market. The market benefits by financial incentives or subsidies provided by the government to encourage the adoption of solar energy and, consequently, the recycling of solar panels. For example, in July 2022, the United States Government, the Biden Administration, via the Department of Energy (DOE), announced an allocation of USD 56 million to boost domestic manufacturing and recycling of solar modules. Additionally, the DOE committed an extra allocation of USD 18 million to address obstacles hindering the commercialization of technologies supported by the department.
Furthermore, governments of various nations implement and enforce regulations regarding the disposal and recycling of solar panels. This ensures that manufacturers and users adhere to environmentally friendly practices. For instance, in November 2022, the Ministry of Environment, Forest and Climate Change of India introduced the E-Waste (Management) Rules. The new rules include regulations for the management of solar PV modules, stating that manufacturers must register on the portal, store waste according to guidelines until 2034-2035, submit annual returns, follow processing rules for other waste, maintain a distinct inventory on the portal, and adhere to standard operating procedures outlined by the Central Pollution Control Board. Recyclers are mandated to recover materials as per the board's guidelines.
Contributions from Leading Nations Drive Solar Panel Recycle Market Expansion
The global solar panel recycling market experiences significant growth influenced by the proactive contributions of various countries. China, a prominent leader in solar PV capacity expansion, not only stimulates market demand through its extensive installations but also generates a surge in end-of-life solar panels, thereby intensifying the need for recycling solutions. This demand is further propelled by China's ambitious targets set in the 14th Five-Year Plan for Renewable Energy.
Within the European Union, the rapid deployment of solar PV and the stringent environmental regulations outlined in initiatives such as the REPowerEU Plan and The Green Deal Industrial Plan significantly shape the global solar panel recycling landscape. The EU's unwavering commitment to sustainability and circular economy principles drives the increased demand for recycling services and technologies. Collectively, these and other countries' efforts to promote solar energy adoption and encourage recycling policies synergize to foster growth in the global solar panel recycling market. As global awareness of the importance of sustainability continues to rise, the demand for solar panel recycling is poised to sustain an upward trajectory.
Impact of COVID-19
The COVID-19 pandemic has impacted the global solar panel recycling industry. As the pandemic caused economic slowdowns and lowered economic activity worldwide, demand for new solar panels may have declined with disruptions in global supply networks. As a result, the supply of panels accessible for recycling may have been limited. However, governments worldwide have enacted new restrictions and policies, which have impacted the recycling industry's operations. Moreover, the pandemic has also brought to light the significance of sustainability and environmental concerns, which may increase awareness and interest in recycling solar panels.
Impact of Russia-Ukraine War
Russia plays a significant role in the global solar panel industry, manufacturing numerous panels for international markets. However, the ongoing war has disrupted solar panel production and supply chains, leading to decreased availability in the global market. Ukraine houses several solar panel recycling facilities, but the conflict threatens to impede their operations, potentially reducing the industry's recycling capacity. In addition to production and recycling disruptions, the political instability and interruptions in the supply chain have also resulted in increased costs for solar panels. This confluence of factors is having a notable impact on the solar panel sector, both in terms of supply and pricing.
Key Players Landscape and Outlook
Companies in the solar panel recycle market implement strategies like collaborations, global expansion, regulatory compliance, public awareness campaigns, circular economy initiatives, customer engagement, cost efficiency, government advocacy, and diversification of services. Moreover, operating companies invest in research and development to create advanced recycling technologies. Innovations that improve efficiency, reduce costs, and enhance the overall recycling process give companies a competitive edge.
In 2023, JinkoSolar developed a recycling process that allows for recycling 92% of a solar panel's materials. This includes cells, front glass, back sheet, aluminum frame, copper wire, encapsulation material, and junction box. In contrast to traditional recycling methods that blend materials, making separation challenging, the company's innovative solution employs thermal and mechanical processes to separate the glass and silicon wafer. It also leverages the distinct melting points of encapsulation materials like thermoset EVA/POE during the module's heating for disassembly.
In November 2022, First Solar Inc. unveiled plans to invest USD 1.1 billion in constructing a photovoltaic (PV) solar module manufacturing facility in Lawrence County, USA, with the aim of generating more than 700 employment opportunities in North Alabama. During the same month, Taiwan's Industrial Technology Research Institute (ITRI), United Renewable Energy (URE), Taiwan's largest solar panel and solar cell manufacturer, and San Fang Chemical Industry Co. Ltd., a Taiwan-based technological film producer dedicated to sustainability, collaborated on developing easily disassembled solar panel modules, allowing for complete recycling of photovoltaic (PV) modules upon decommissioning.
In July 2022, the U.S. Department of Energy (DoE) disclosed its intention to allocate USD56 million, including USD10 million for infrastructure, to drive innovation in solar manufacturing and recycling across the United States. The funding's objectives are to make clean energy more accessible and reliable by 2035 and achieve net-zero emissions by mid-century.
In September 2022, SOLAR CYCLE, a technology-driven company specializing in recycling solar panels, partnered with Silicon Ranch Corporation, one of the largest independent electricity producers. Their collaboration focuses on processing end-of-life stage solar systems from Silicon Ranch installations through SOLAR CYCLE's advanced, high-recovery recycling platform. SOLAR CYCLE's innovative module recycling process recovers nearly 95% of the value of solar panels, which can then be reintroduced into the supply network to create new panels.
Table of Contents
1. Research Methodology
2. Project Scope & Definitions
3. Impact of COVID-19 on the Global Solar Panel Recycle Market
4. Impact of Russia-Ukraine War
5. Executive Summary
6. Global Solar Panel Recycle Market Outlook, 2016-2030F
- 6.1. Market Size & Forecast
- 6.1.1. By Value
- 6.1.2. By Volume
- 6.2. By Type
- 6.2.1. Monocrystalline
- 6.2.2. Polycrystalline
- 6.2.3. Thin-Film
- 6.2.4. Others
- 6.3. By Material
- 6.3.1. Silicon
- 6.3.2. Gallium Arsenide
- 6.3.3. Aluminium Gallium Arsenide
- 6.3.4. Cadmium
- 6.3.5. Others
- 6.4. By Process
- 6.4.1. Chemical
- 6.4.2. Thermal
- 6.4.3. Mechanical
- 6.4.4. Others
- 6.5. By Region
- 6.5.1. North America
- 6.5.2. Europe
- 6.5.3. South America
- 6.5.4. Asia-Pacific
- 6.5.5. Middle East and Africa
- 6.6. By Company Market Share (%), 2022
7. Global Solar Panel Recycle Market Outlook, By Region, 2016-2030F
- 7.1. North America*
- 7.1.1. Market Size & Forecast
- 7.1.1.1. By Value
- 7.1.1.2. By Volume
- 7.1.2. By Type
- 7.1.2.1. Monocrystalline
- 7.1.2.2. Polycrystalline
- 7.1.2.3. Thin-Film
- 7.1.2.4. Others
- 7.1.3. By Material
- 7.1.3.1. Silicon
- 7.1.3.2. Gallium Arsenide
- 7.1.3.3. Aluminium Gallium Arsenide
- 7.1.3.4. Cadmium
- 7.1.3.5. Others
- 7.1.4. By Process
- 7.1.4.1. Chemical
- 7.1.4.2. Thermal
- 7.1.4.3. Mechanical
- 7.1.4.4. Others
- 7.1.5. United States*
- 7.1.5.1. Market Size & Forecast
- 7.1.5.1.1. By Value
- 7.1.5.1.2. By Volume
- 7.1.5.2. By Type
- 7.1.5.2.1. Monocrystalline
- 7.1.5.2.2. Polycrystalline
- 7.1.5.2.3. Thin-Film
- 7.1.5.2.4. Others
- 7.1.5.3. By Material
- 7.1.5.3.1. Silicon
- 7.1.5.3.2. Gallium Arsenide
- 7.1.5.3.3. Aluminium Gallium Arsenide
- 7.1.5.3.4. Cadmium
- 7.1.5.3.5. Others
- 7.1.5.4. By Process
- 7.1.5.4.1. Chemical
- 7.1.5.4.2. Thermal
- 7.1.5.4.3. Mechanical
- 7.1.5.4.4. Others
- 7.1.6. Canada
- 7.1.7. Mexico
- 7.1.1. Market Size & Forecast
All segments will be provided for all regions and countries covered
- 7.2. Europe
- 7.2.1. Germany
- 7.2.2. France
- 7.2.3. Italy
- 7.2.4. United Kingdom
- 7.2.5. Russia
- 7.2.6. Netherlands
- 7.2.7. Spain
- 7.2.8. Turkey
- 7.2.9. Poland
- 7.3. South America
- 7.3.1. Brazil
- 7.3.2. Argentina
- 7.4. Asia-Pacific
- 7.4.1. India
- 7.4.2. China
- 7.4.3. Japan
- 7.4.4. Australia
- 7.4.5. Vietnam
- 7.4.6. South Korea
- 7.4.7. Indonesia
- 7.4.8. Philippines
- 7.5. Middle East & Africa
- 7.5.1. Saudi Arabia
- 7.5.2. UAE
- 7.5.3. South Africa
8. Supply Side Analysis
- 8.1. Capacity, By Company
- 8.2. Production, By Company
- 8.3. Operating Efficiency, By Company
- 8.4. Key Plant Locations (Up to 25)
9. Market Mapping, 2022
- 9.1. By Type
- 9.2. By Material
- 9.3. By Process
- 9.4. By Region
10. Macro Environment and Industry Structure
- 10.1. Supply Demand Analysis
- 10.2. Import Export Analysis - Volume and Value
- 10.3. Supply/Value Chain Analysis
- 10.4. PESTEL Analysis
- 10.4.1. Political Factors
- 10.4.2. Economic System
- 10.4.3. Social Implications
- 10.4.4. Technological Advancements
- 10.4.5. Environmental Impacts
- 10.4.6. Legal Compliances and Regulatory Policies (Statutory Bodies Included)
- 10.5. Porter's Five Forces Analysis
- 10.5.1. Supplier Power
- 10.5.2. Buyer Power
- 10.5.3. Substitution Threat
- 10.5.4. Threat from New Entrant
- 10.5.5. Competitive Rivalry
11. Market Dynamics
- 11.1. Growth Drivers
- 11.2. Growth Inhibitors (Challenges, Restraints)
12. Key Players Landscape
- 12.1. Competition Matrix of Top Five Market Leaders
- 12.2. Market Revenue Analysis of Top Five Market Leaders (in %, 2022)
- 12.3. Mergers and Acquisitions/Joint Ventures (If Applicable)
- 12.4. SWOT Analysis (For Five Market Players)
- 12.5. Patent Analysis (If Applicable)
13. Pricing Analysis
14. Case Studies
15. Key Players Outlook
- 15.1. First Solar Inc.
- 15.1.1. Company Details
- 15.1.2. Key Management Personnel
- 15.1.3. Products & Services
- 15.1.4. Financials (As reported)
- 15.1.5. Key Market Focus & Geographical Presence
- 15.1.6. Recent Developments
- 15.2. SunPower Corporation
- 15.3. Hanwha Group
- 15.4. Echo Environmental, LLC
- 15.5. Reclaim PV Pty Ltd.
- 15.6. PV Industries Pty Ltd.
- 15.7. Veolia Environnement S.A.
- 15.8. JinkoSolar Holding Co., Ltd.
- 15.9. Poseidon Solar Services Pvt Ltd
- 15.10. Reiling GmbH & Co. KG
- 15.11. Yingli Green Energy Holding Company Limited
Companies mentioned above DO NOT hold any order as per market share and can be changed as per information available during research work
