|
|
市場調査レポート
商品コード
1373590
再生PETの世界市場の評価:原料別、グレード別、用途別、エンドユーザー別、地域別、機会、予測(2016年~2030年)Recycled PET Market Assessment, By Source, By Grade, By Application, By End-user, By Region, Opportunities and Forecast, 2016-2030F |
||||||
|
|
|||||||
カスタマイズ可能
|
|||||||

| 再生PETの世界市場の評価:原料別、グレード別、用途別、エンドユーザー別、地域別、機会、予測(2016年~2030年) |
|
出版日: 2023年11月03日
発行: Markets & Data
ページ情報: 英文 142 Pages
納期: 3~5営業日
|

全表示
- 概要
- 図表
- 目次
世界の再生PETの市場規模は、2022年の1,656万トンから2030年に2,782万トンに達し、2023年~2030年の予測期間にCAGRで6.7%の成長が予測されています。
モノフィラメント押出成形向け再生PET
モノフィラメント用途は世界的に注目されており、再生材料を使用する絶好の機会となっています。非の打ちどころのない機械的特性と優れた加工性により、PETはモノフィラメント押出成形向けの原材料として徐々に使用されるようになっています。
主要企業の情勢と見通し
再生PET市場は、優れたファブリックの品質、食品グレード包装など、必要不可欠な製品の需要の増加に伴い順調に成長しています。Eindhoven University of Technology(オランダ)傘下のIoniqa Technologies B.V.は、PET廃棄物から有効な価値を生み出す独自の循環型技術を駆使してPETリサイクル市場をリードしています。2022年9月、Ioniqa Technologies B.V.(Ioniqa)は、Ioniqaの先進のPETの独自のリサイクル技術をプラスチック産業で商業化する目的で、Koch Technology Solutions(KTS)と提携しました。このパートナーシップを進行させるため、KTSはIoniqaに約302億1,200万米ドルを投資することを約束しました。この重要な投資は、年間3,000万トンのPET市場における再生材への需要の高まりに大いに対応するもので、廃棄物を飲料ボトルのような高い食品グレードの用途に適した材料に変換することを助けます。
当レポートでは、世界の再生PET市場について調査分析し、市場規模と予測、市場力学、主要企業の情勢と見通しなどを提供しています。
目次
第1章 調査手法
第2章 プロジェクトの範囲と定義
第3章 再生PET市場に対するCOVID-19の影響
第4章 エグゼクティブサマリー
第5章 顧客の声
- 市場の認知度と製品情報
- ブランドの認知度とロイヤルティ
- 購入決定において考慮される要素
- ブランド名
- 品質
- 数量
- 価格
- 製品仕様
- 用途仕様
- 貯蔵寿命
- 製品の入手可能性
- 購入頻度
- 購入媒体
第6章 再生PET市場の見通し(2016年~2030年)
- 市場規模と予測
- 金額
- 数量
- 原料別
- 再生された廃棄物
- 再生ペットボトル
- 再生PETシート・フィルム
- その他
- グレード別
- 食品グレード
- 工業グレード
- 用途別
- 電気
- シート製造
- モノフィラメント
- 断熱材
- ジオテキスタイル
- ストラッピング
- 採血管(BCT)
- その他
- エンドユーザー別
- ファブリック産業
- 自動車
- 包装産業
- スポーツ産業
- カーペット産業
- その他
- 地域別
- 北米
- 欧州
- 南米
- アジア太平洋
- 中東・アフリカ
- 市場シェア:企業別(2022年)
第7章 再生PET市場の見通し:地域別(2016年~2030年)
- 北米
- 市場規模と予測
- 原料別
- グレード別
- 用途別
- エンドユーザー別
- 米国
- カナダ
- メキシコ
- 欧州
- ドイツ
- フランス
- イタリア
- 英国
- ロシア
- オランダ
- スペイン
- トルコ
- ポーランド
- 南米
- ブラジル
- アルゼンチン
- アジア太平洋
- インド
- 中国
- 日本
- オーストラリア
- ベトナム
- 韓国
- インドネシア
- フィリピン
- 中東・アフリカ
- サウジアラビア
- アラブ首長国連邦
- 南アフリカ
第8章 サプライサイド分析
- 生産能力:企業別
- 生産:企業別
- 運転効率:企業別
- 主な工場の所在地(最大25)
第9章 市場マッピング(2022年)
- 原料別
- グレード別
- 用途別
- エンドユーザー別
- 地域別
第10章 マクロ環境と産業構造
- 需給分析
- 輸出入の分析 - 数量と金額
- サプライ/バリューチェーン分析
- PESTEL分析
- ポーターのファイブフォース分析
第11章 市場力学
- 成長促進要因
- 成長抑制要因(課題、抑制要因)
第12章 主要企業情勢
- マーケットリーダー上位5社の競合マトリクス
- マーケットリーダー上位5社の市場収益分析(2022年)
- 合併と買収/合弁事業(該当する場合)
- SWOT分析(市場参入企業5社向け)
- 特許分析(該当する場合)
第13章 価格分析
第14章 ケーススタディ
第15章 主要企業の見通し
- Phoenix Technologies
- Dufor Polyester Specialties
- Monosuisse AG
- Kordsa Teknik Tekstil A.S.
- Takataka Solutions
- Worn Again Technologies
- Ioniqa Technologies B.V.
- Srichakra PolyPlast
- PT Tridi Oasis Group
- Extrupet (Pty) Ltd
第16章 戦略的推奨事項
第17章 当社について、免責事項
List of Tables
- Table 1. Pricing Analysis of Products from Key Players
- Table 2. Competition Matrix of Top 5 Market Leaders
- Table 3. Mergers & Acquisitions/ Joint Ventures (If Applicable)
- Table 4. About Us - Regions and Countries Where We Have Executed Client Projects
List of Figures
- Figure 1. Global Recycled PET Market, By Value, In USD Million, 2016-2030F
- Figure 2. Global Recycled PET Market, By Volume, In Tons, 2016-2030F
- Figure 3. Global Recycled PET Market Share, By Source, In USD Million, 2016-2030F
- Figure 4. Global Recycled PET Market Share, By Grade, In USD Million, 2016-2030F
- Figure 5. Global Recycled PET Market Share, By Application, In USD Million, 2016-2030F
- Figure 6. Global Recycled PET Market Share, By End-user, In USD Million, 2016-2030F
- Figure 7. Global Recycled PET Market Share, By Region, In USD Million, 2016-2030F
- Figure 8. North America Recycled PET Market, By Value, In USD Million, 2016-2030F
- Figure 9. North America Recycled PET Market, By Volume, In Tons, 2016-2030F
- Figure 10. North America Recycled PET Market Share, By Source, In USD Million, 2016-2030F
- Figure 11. North America Recycled PET Market Share, By Grade, In USD Million, 2016-2030F
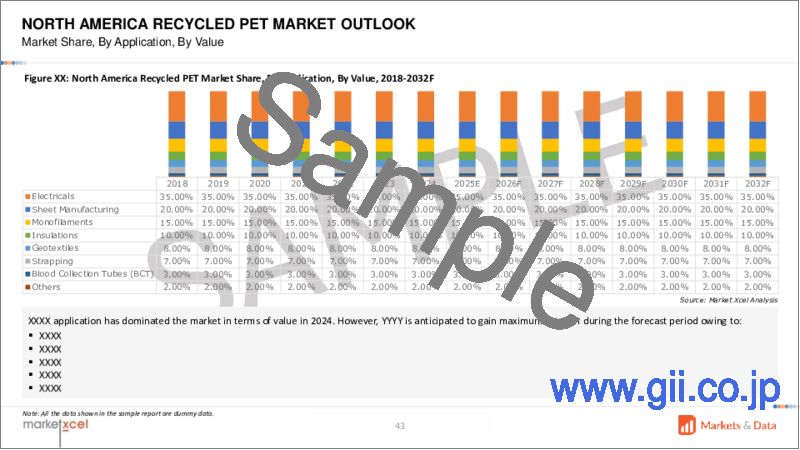
- Figure 12. North America Recycled PET Market Share, By Application, In USD Million, 2016-2030F
- Figure 13. North America Recycled PET Market Share, By End-user, In USD Million, 2016-2030F
- Figure 14. North America Recycled PET Market Share, By Country, In USD Million, 2016-2030F
- Figure 15. United States Recycled PET Market, By Value, In USD Million, 2016-2030F
- Figure 16. United States Recycled PET Market, By Volume, In Tons, 2016-2030F
- Figure 17. United States Recycled PET Market Share, By Source, In USD Million, 2016-2030F
- Figure 18. United States Recycled PET Market Share, By Grade, In USD Million, 2016-2030F
- Figure 19. United States Recycled PET Market Share, By Application, In USD Million, 2016-2030F
- Figure 20. United States Recycled PET Market Share, By End-user, In USD Million, 2016-2030F
- Figure 21. Canada Recycled PET Market, By Value, In USD Million, 2016-2030F
- Figure 22. Canada Recycled PET Market, By Volume, In Tons, 2016-2030F
- Figure 23. Canada Recycled PET Market Share, By Source, In USD Million, 2016-2030F
- Figure 24. Canada Recycled PET Market Share, By Grade, In USD Million, 2016-2030F
- Figure 25. Canada Recycled PET Market Share, By Application, In USD Million, 2016-2030F
- Figure 26. Canada Recycled PET Market Share, By End-user, In USD Million, 2016-2030F
- Figure 27. Mexico Recycled PET Market, By Value, In USD Million, 2016-2030F
- Figure 28. Mexico Recycled PET Market, By Volume, In Tons, 2016-2030F
- Figure 29. Mexico Recycled PET Market Share, By Source, In USD Million, 2016-2030F
- Figure 30. Mexico Recycled PET Market Share, By Grade, In USD Million, 2016-2030F
- Figure 31. Mexico Recycled PET Market Share, By Application, In USD Million, 2016-2030F
- Figure 32. Mexico Recycled PET Market Share, By End-user, In USD Million, 2016-2030F
- Figure 33. Europe Recycled PET Market, By Value, In USD Million, 2016-2030F
- Figure 34. Europe Recycled PET Market, By Volume, In Tons, 2016-2030F
- Figure 35. Europe Recycled PET Market Share, By Source, In USD Million, 2016-2030F
- Figure 36. Europe Recycled PET Market Share, By Grade, In USD Million, 2016-2030F
- Figure 37. Europe Recycled PET Market Share, By Application, In USD Million, 2016-2030F
- Figure 38. Europe Recycled PET Market Share, By End-user, In USD Million, 2016-2030F
- Figure 39. Europe Recycled PET Market Share, By Country, In USD Million, 2016-2030F
- Figure 40. Germany Recycled PET Market, By Value, In USD Million, 2016-2030F
- Figure 41. Germany Recycled PET Market, By Volume, In Tons, 2016-2030F
- Figure 42. Germany Recycled PET Market Share, By Source, In USD Million, 2016-2030F
- Figure 43. Germany Recycled PET Market Share, By Grade, In USD Million, 2016-2030F
- Figure 44. Germany Recycled PET Market Share, By Application, In USD Million, 2016-2030F
- Figure 45. Germany Recycled PET Market Share, By End-user, In USD Million, 2016-2030F
- Figure 46. France Recycled PET Market, By Value, In USD Million, 2016-2030F
- Figure 47. France Recycled PET Market, By Volume, In Tons, 2016-2030F
- Figure 48. France Recycled PET Market Share, By Source, In USD Million, 2016-2030F
- Figure 49. France Recycled PET Market Share, By Grade, In USD Million, 2016-2030F
- Figure 50. France Recycled PET Market Share, By Application, In USD Million, 2016-2030F
- Figure 51. France Recycled PET Market Share, By End-user, In USD Million, 2016-2030F
- Figure 52. Italy Recycled PET Market, By Value, In USD Million, 2016-2030F
- Figure 53. Italy Recycled PET Market, By Volume, In Tons, 2016-2030F
- Figure 54. Italy Recycled PET Market Share, By Source, In USD Million, 2016-2030F
- Figure 55. Italy Recycled PET Market Share, By Grade, In USD Million, 2016-2030F
- Figure 56. Italy Recycled PET Market Share, By Application, In USD Million, 2016-2030F
- Figure 57. Italy Recycled PET Market Share, By End-user, In USD Million, 2016-2030F
- Figure 58. United Kingdom Recycled PET Market, By Value, In USD Million, 2016-2030F
- Figure 59. United Kingdom Recycled PET Market, By Volume, In Tons, 2016-2030F
- Figure 60. United Kingdom Recycled PET Market Share, By Source, In USD Million, 2016-2030F
- Figure 61. United Kingdom Recycled PET Market Share, By Grade, In USD Million, 2016-2030F
- Figure 62. United Kingdom Recycled PET Market Share, By Application, In USD Million, 2016-2030F
- Figure 63. United Kingdom Recycled PET Market Share, By End-user, In USD Million, 2016-2030F
- Figure 64. Russia Recycled PET Market, By Value, In USD Million, 2016-2030F
- Figure 65. Russia Recycled PET Market, By Volume, In Tons, 2016-2030F
- Figure 66. Russia Recycled PET Market Share, By Source, In USD Million, 2016-2030F
- Figure 67. Russia Recycled PET Market Share, By Grade, In USD Million, 2016-2030F
- Figure 68. Russia Recycled PET Market Share, By Application, In USD Million, 2016-2030F
- Figure 69. Russia Recycled PET Market Share, By End-user, In USD Million, 2016-2030F
- Figure 70. Netherlands Recycled PET Market, By Value, In USD Million, 2016-2030F
- Figure 71. Netherlands Recycled PET Market, By Volume, In Tons, 2016-2030F
- Figure 72. Netherlands Recycled PET Market Share, By Source, In USD Million, 2016-2030F
- Figure 73. Netherlands Recycled PET Market Share, By Grade, In USD Million, 2016-2030F
- Figure 74. Netherlands Recycled PET Market Share, By Application, In USD Million, 2016-2030F
- Figure 75. Netherlands Recycled PET Market Share, By End-user, In USD Million, 2016-2030F
- Figure 76. Spain Recycled PET Market, By Value, In USD Million, 2016-2030F
- Figure 77. Spain Recycled PET Market, By Volume, In Tons, 2016-2030F
- Figure 78. Spain Recycled PET Market Share, By Source, In USD Million, 2016-2030F
- Figure 79. Spain Recycled PET Market Share, By Grade, In USD Million, 2016-2030F
- Figure 80. Spain Recycled PET Market Share, By Application, In USD Million, 2016-2030F
- Figure 81. Spain Recycled PET Market Share, By End-user, In USD Million, 2016-2030F
- Figure 82. Turkey Recycled PET Market, By Value, In USD Million, 2016-2030F
- Figure 83. Turkey Recycled PET Market, By Volume, In Tons, 2016-2030F
- Figure 84. Turkey Recycled PET Market Share, By Source, In USD Million, 2016-2030F
- Figure 85. Turkey Recycled PET Market Share, By Grade, In USD Million, 2016-2030F
- Figure 86. Turkey Recycled PET Market Share, By Application, In USD Million, 2016-2030F
- Figure 87. Turkey Recycled PET Market Share, By End-user, In USD Million, 2016-2030F
- Figure 88. Poland Recycled PET Market, By Value, In USD Million, 2016-2030F
- Figure 89. Poland Recycled PET Market, By Volume, In Tons, 2016-2030F
- Figure 90. Poland Recycled PET Market Share, By Source, In USD Million, 2016-2030F
- Figure 91. Poland Recycled PET Market Share, By Grade, In USD Million, 2016-2030F
- Figure 92. Poland Recycled PET Market Share, By Application, In USD Million, 2016-2030F
- Figure 93. Poland Recycled PET Market Share, By End-user, In USD Million, 2016-2030F
- Figure 94. South America Recycled PET Market, By Value, In USD Million, 2016-2030F
- Figure 95. South America Recycled PET Market, By Volume, In Tons, 2016-2030F
- Figure 96. South America Recycled PET Market Share, By Source, In USD Million, 2016-2030F
- Figure 97. South America Recycled PET Market Share, By Grade, In USD Million, 2016-2030F
- Figure 98. South America Recycled PET Market Share, By Application, In USD Million, 2016-2030F
- Figure 99. South America Recycled PET Market Share, By End-user, In USD Million, 2016-2030F
- Figure 100. South America Recycled PET Market Share, By Country, In USD Million, 2016-2030F
- Figure 101. Brazil Recycled PET Market, By Value, In USD Million, 2016-2030F
- Figure 102. Brazil Recycled PET Market, By Volume, In Tons, 2016-2030F
- Figure 103. Brazil Recycled PET Market Share, By Source, In USD Million, 2016-2030F
- Figure 104. Brazil Recycled PET Market Share, By Grade, In USD Million, 2016-2030F
- Figure 105. Brazil Recycled PET Market Share, By Application, In USD Million, 2016-2030F
- Figure 106. Brazil Recycled PET Market Share, By End-user, In USD Million, 2016-2030F
- Figure 107. Argentina Recycled PET Market, By Value, In USD Million, 2016-2030F
- Figure 108. Argentina Recycled PET Market, By Volume, In Tons, 2016-2030F
- Figure 109. Argentina Recycled PET Market Share, By Source, In USD Million, 2016-2030F
- Figure 110. Argentina Recycled PET Market Share, By Grade, In USD Million, 2016-2030F
- Figure 111. Argentina Recycled PET Market Share, By Application, In USD Million, 2016-2030F
- Figure 112. Argentina Recycled PET Market Share, By End-user, In USD Million, 2016-2030F
- Figure 113. Asia-Pacific Recycled PET Market, By Value, In USD Million, 2016-2030F
- Figure 114. Asia-Pacific Recycled PET Market, By Volume, In Tons, 2016-2030F
- Figure 115. Asia-Pacific Recycled PET Market Share, By Source, In USD Million, 2016-2030F
- Figure 116. Asia-Pacific Recycled PET Market Share, By Grade, In USD Million, 2016-2030F
- Figure 117. Asia-Pacific Recycled PET Market Share, By Application, In USD Million, 2016-2030F
- Figure 118. Asia-Pacific Recycled PET Market Share, By End-user, In USD Million, 2016-2030F
- Figure 119. Asia-Pacific Recycled PET Market Share, By Country, In USD Million, 2016-2030F
- Figure 120. India Recycled PET Market, By Value, In USD Million, 2016-2030F
- Figure 121. India Recycled PET Market, By Volume, In Tons, 2016-2030F
- Figure 122. India Recycled PET Market Share, By Source, In USD Million, 2016-2030F
- Figure 123. India Recycled PET Market Share, By Grade, In USD Million, 2016-2030F
- Figure 124. India Recycled PET Market Share, By Application, In USD Million, 2016-2030F
- Figure 125. India Recycled PET Market Share, By End-user, In USD Million, 2016-2030F
- Figure 126. China Recycled PET Market, By Value, In USD Million, 2016-2030F
- Figure 127. China Recycled PET Market, By Volume, In Tons, 2016-2030F
- Figure 128. China Recycled PET Market Share, By Source, In USD Million, 2016-2030F
- Figure 129. China Recycled PET Market Share, By Grade, In USD Million, 2016-2030F
- Figure 130. China Recycled PET Market Share, By Application, In USD Million, 2016-2030F
- Figure 131. China Recycled PET Market Share, By End-user, In USD Million, 2016-2030F
- Figure 132. Japan Recycled PET Market, By Value, In USD Million, 2016-2030F
- Figure 133. Japan Recycled PET Market, By Volume, In Tons, 2016-2030F
- Figure 134. Japan Recycled PET Market Share, By Source, In USD Million, 2016-2030F
- Figure 135. Japan Recycled PET Market Share, By Grade, In USD Million, 2016-2030F
- Figure 136. Japan Recycled PET Market Share, By Application, In USD Million, 2016-2030F
- Figure 137. Japan Recycled PET Market Share, By End-user, In USD Million, 2016-2030F
- Figure 138. Australia Recycled PET Market, By Value, In USD Million, 2016-2030F
- Figure 139. Australia Recycled PET Market, By Volume, In Tons, 2016-2030F
- Figure 140. Australia Recycled PET Market Share, By Source, In USD Million, 2016-2030F
- Figure 141. Australia Recycled PET Market Share, By Grade, In USD Million, 2016-2030F
- Figure 142. Australia Recycled PET Market Share, By Application, In USD Million, 2016-2030F
- Figure 143. Australia Recycled PET Market Share, By End-user, In USD Million, 2016-2030F
- Figure 144. Vietnam Recycled PET Market, By Value, In USD Million, 2016-2030F
- Figure 145. Vietnam Recycled PET Market, By Volume, In Tons, 2016-2030F
- Figure 146. Vietnam Recycled PET Market Share, By Source, In USD Million, 2016-2030F
- Figure 147. Vietnam Recycled PET Market Share, By Grade, In USD Million, 2016-2030F
- Figure 148. Vietnam Recycled PET Market Share, By Application, In USD Million, 2016-2030F
- Figure 149. Vietnam Recycled PET Market Share, By End-user, In USD Million, 2016-2030F
- Figure 150. South Korea Recycled PET Market, By Value, In USD Million, 2016-2030F
- Figure 151. South Korea Recycled PET Market, By Volume, In Tons, 2016-2030F
- Figure 152. South Korea Recycled PET Market Share, By Source, In USD Million, 2016-2030F
- Figure 153. South Korea Recycled PET Market Share, By Grade, In USD Million, 2016-2030F
- Figure 154. South Korea Recycled PET Market Share, By Application, In USD Million, 2016-2030F
- Figure 155. South Korea Recycled PET Market Share, By End-user, In USD Million, 2016-2030F
- Figure 156. Indonesia Recycled PET Market, By Value, In USD Million, 2016-2030F
- Figure 157. Indonesia Recycled PET Market, By Volume, In Tons, 2016-2030F
- Figure 158. Indonesia Recycled PET Market Share, By Source, In USD Million, 2016-2030F
- Figure 159. Indonesia Recycled PET Market Share, By Grade, In USD Million, 2016-2030F
- Figure 160. Indonesia Recycled PET Market Share, By Application, In USD Million, 2016-2030F
- Figure 161. Indonesia Recycled PET Market Share, By End-user, In USD Million, 2016-2030F
- Figure 162. Philippines Recycled PET Market, By Value, In USD Million, 2016-2030F
- Figure 163. Philippines Recycled PET Market, By Volume, In Tons, 2016-2030F
- Figure 164. Philippines Recycled PET Market Share, By Source, In USD Million, 2016-2030F
- Figure 165. Philippines Recycled PET Market Share, By Grade, In USD Million, 2016-2030F
- Figure 166. Philippines Recycled PET Market Share, By Application, In USD Million, 2016-2030F
- Figure 167. Philippines Recycled PET Market Share, By End-user, In USD Million, 2016-2030F
- Figure 168. Middle East & Africa Recycled PET Market, By Value, In USD Million, 2016-2030F
- Figure 169. Middle East & Africa Recycled PET Market, By Volume, In Tons, 2016-2030F
- Figure 170. Middle East & Africa Recycled PET Market Share, By Source, In USD Million, 2016-2030F
- Figure 171. Middle East & Africa Recycled PET Market Share, By Grade, In USD Million, 2016-2030F
- Figure 172. Middle East & Africa Recycled PET Market Share, By Application, In USD Million, 2016-2030F
- Figure 173. Middle East & Africa Recycled PET Market Share, By End-user, In USD Million, 2016-2030F
- Figure 174. Middle East & Africa Recycled PET Market Share, By Country, In USD Million, 2016-2030F
- Figure 175. Saudi Arabia Recycled PET Market, By Value, In USD Million, 2016-2030F
- Figure 176. Saudi Arabia Recycled PET Market, By Volume, In Tons, 2016-2030F
- Figure 177. Saudi Arabia Recycled PET Market Share, By Source, In USD Million, 2016-2030F
- Figure 178. Saudi Arabia Recycled PET Market Share, By Grade, In USD Million, 2016-2030F
- Figure 179. Saudi Arabia Recycled PET Market Share, By Application, In USD Million, 2016-2030F
- Figure 180. Saudi Arabia Recycled PET Market Share, By End-user, In USD Million, 2016-2030F
- Figure 181. UAE Recycled PET Market, By Value, In USD Million, 2016-2030F
- Figure 182. UAE Recycled PET Market, By Volume, In Tons, 2016-2030F
- Figure 183. UAE Recycled PET Market Share, By Source, In USD Million, 2016-2030F
- Figure 184. UAE Recycled PET Market Share, By Grade, In USD Million, 2016-2030F
- Figure 185. UAE Recycled PET Market Share, By Application, In USD Million, 2016-2030F
- Figure 186. UAE Recycled PET Market Share, By End-user, In USD Million, 2016-2030F
- Figure 187. South Africa Recycled PET Market, By Value, In USD Million, 2016-2030F
- Figure 188. South Africa Recycled PET Market, By Volume, In Tons, 2016-2030F
- Figure 189. South Africa Recycled PET Market Share, By Source, In USD Million, 2016-2030F
- Figure 190. South Africa Recycled PET Market Share, By Grade, In USD Million, 2016-2030F
- Figure 191. South Africa Recycled PET Market Share, By Application, In USD Million, 2016-2030F
- Figure 192. South Africa Recycled PET Market Share, By End-user, In USD Million, 2016-2030F
- Figure 193. By Source Map-Market Size (USD Million) & Growth Rate (%), 2022
- Figure 194. By Grade Map-Market Size (USD Million) & Growth Rate (%), 2022
- Figure 195. By Application Map-Market Size (USD Million) & Growth Rate (%), 2022
- Figure 196. By End-user Map-Market Size (USD Million) & Growth Rate (%), 2022
By Region Map-Market Size (USD Million) & Growth Rate (%), 2022
Recycled PET Market size was estimated at 16.56 million tons in 2022 which is expected to reach USD 27.82 million tons in 2030 with a CAGR of 6.7% for the forecast period between 2023 and 2030. Recycled PET or rPET are usually obtained from scrapped PET bottles that is successfully incorporated in various applications and assist in achieving sustainability. Waste poly-ethylene terephthalate (PET) bottles are vulnerable to generating serious disposal concerns as they are completely non-biodegradable. In textile industry the production of recycled polyester fibers significantly consumes less resources than new fibers accompanied by less carbon emissions ultimately optimizing the circular economy. Dealing with the environmental concern recycling PET around 1kg prominently corresponds to reducing carbon dioxide emissions equivalent to 3kg. Food grade recycled PET pellets are widely used in manufacturing essential chemical bottles, soft drinks bottles and should fulfill the criteria of government regulation bodies like FDA, EMA, etc.
Food-Grade Recycled PET are Successively Augmenting the Recycled PET Market
Food grade recycled PET are considered effective as it has been produced majorly from plastic food packaging and subsequently decontaminated by an approved process. PET recycled materials possess higher strength and progressively used for ketchup, beverage, and vegetable oil bottles. Suitable materials for food grade packaging are considered when recycled products are passes through different levels of sorting systems that assist in decoupling foreign plastics, off-colors, unwanted contaminants, etc. Food safety agencies such as United States FDA and Europe EFSA are responsible to provide certification for commercializing recycled food grade packaging product.
PPT Global Chemical (GC) a Thailand-based entity has collaborated with Alpha Group with the aim of creating new food-grade packaging from 100% post-consumer recycled PET (PCR PET). On September 2023, World Packaging Organization (WPO) and The Active & Intelligent Packaging Organization (AIPIA) have successfully partnered to develop smart packaging while incorporating the advanced packaging of AIPIA. In July 2023 global leading company Mondi in food and packaging has confirmed an investment of around USD 17.99 million to enhance the production capacity of its new packaging range.
Incorporation of Recycled PET in the Textile Industry is Enhancing the Fabric Properties
The revolution in the textile industry deliver an imperative role towards the trade, economy, and employment of any country. Recycled PET bottles are successfully eradicating the environmental problem in the textile industry like enormous usage of chemicals, emission of harmful greenhouse gases, generation of huge wastes, etc. The recycled polyester fiber has lower melting point (7-12deg C) and lower crystallinity in comparison with virgin polyester fiber. The recycled polyester fabric that includes fabric items should be certified with Global Recycling Standard (GRS). Recycled polyester made fabric is more resistant to stains and consume less energy to wash & dry.
In May 2023, Home Textile Association published a report that stats in 2022 Turkiye's home textile industry's exports revenue were around USD 5 billion that significantly going to boost the country's export by around 25%. In 2022, China emerges a top ranked global textile exporter with a value of around USD 148 billion, followed by European Union with an export value of around USD 71 billion. The market for recycled PET market in the textile industry is remarkable, which attracts significant investments around the globe.
Recycled PET for Monofilament Extrusion
Monofilament applications are gaining worldwide attention that possess excellent opportunities for the use of recycled materials. Due to impeccable mechanical properties and good processability, poly-ethylene terephthalate is progressively used as a raw material for monofilament extrusion. Prominent applications using monofilament extrusion are fishing lines, industrial woven, tennis strings and 3D printing filaments. Excellent resistant characteristics of monofilament yarn incorporates its application in the production of filter fabrics for automotive usage. Fragmental elements of these yarns possess high stiffness and mechanical strength even when processed at lower temperatures. In addition to these at higher temperatures it resembles low water absorption and good dimensional stability. The Kordsa confirmed to invest in its polypropylene monofilament fiber reinforcement line in Turkey by sanctioning a huge USD 22 million.
Impact of COVID-19
The outbreak of COVID-19 has severely impacted numerous sectors and human livelihood where every person was vulnerable to infectious disease. The fight for COVID-19 was a challenging operation which evolved every sectors to contribute their practices and eradicate the impact. Recycled PET delivered an imperative role to tackle the COVID-19 infection while boosting plastic waste management. A global leading sustainable chemical company Indorama Ventures Public Company Limited (IVL), has substantially used recycled plastic bottles to develop advanced medical equipment that prominently used as a shield to fight with COVID-19. IVL incorporated tangible ways to use recycling technique and assisted in supporting medical professionals and a circular economy.
Key Players Landscape and Outlook
The Recycled PET market is successfully growing with the increasing demand of essential products like good fabric quality, food grade packaging, etc. Ioniqa Technologies B.V. which comes under the Eindhoven University of Technology (NL) is progressively leading the PET recycling market by using its proprietary circular technology that counts its specialization in generating effective value out of PET waste. In September 2022, Ioniqa Technologies B.V. (Ioniqa) collaborated with Koch Technology Solutions (KTS) with the objective of commercializing Ioniqa's advanced polyethylene terephthalate (PET) unique recycling technology in the plastic industry. To make this partnership progressive KTS has committed to invest around USD 30.2142 million in Ioniqa. This significant investment will substantially address the growing demand for recycled content in the 30 million metric tons per annum PET market, that assist in converting the waste into materials which is suitable for high food grade applications like in beverage bottles.
Table of Contents
1. Research Methodology
2. Project Scope & Definitions
3. Impact of COVID-19 on the Recycled PET Market
4. Executive Summary
5. Voice of Customer
- 5.1. Market Awareness and Product Information
- 5.2. Brand Awareness and Loyalty
- 5.3. Factors Considered in Purchase Decision
- 5.3.1. Brand Name
- 5.3.2. Quality
- 5.3.3. Quantity
- 5.3.4. Price
- 5.3.5. Product Specification
- 5.3.6. Application Specification
- 5.3.7. Shelf-life
- 5.3.8. Availability of Product
- 5.4. Frequency of Purchase
- 5.5. Medium of Purchase
6. Recycled PET Market Outlook, 2016-2030F
- 6.1. Market Size & Forecast
- 6.1.1. By Value
- 6.1.2. By Volume
- 6.2. By Source
- 6.2.1. Recycled Waste
- 6.2.2. Recycled PET Bottles
- 6.2.3. Recycled PET Sheets & Films
- 6.2.4. Others
- 6.3. By Grade
- 6.3.1. Food Grade
- 6.3.2. Industrial Grade
- 6.4. By Application
- 6.4.1. Electricals
- 6.4.2. Sheet Manufacturing
- 6.4.3. Monofilaments
- 6.4.4. Insulations
- 6.4.5. Geotextiles
- 6.4.6. Strapping
- 6.4.7. Blood Collection Tubes (BCT)
- 6.4.8. Others
- 6.5. By End-user
- 6.5.1. Fabric Industry
- 6.5.2. Automotive
- 6.5.3. Packaging Industry
- 6.5.4. Sport Industry
- 6.5.5. Carpet Industry
- 6.5.6. Others
- 6.6. By Region
- 6.6.1. North America
- 6.6.2. Europe
- 6.6.3. South America
- 6.6.4. Asia-Pacific
- 6.6.5. Middle East and Africa
- 6.7. By Company Market Share (%), 2022
7. Recycled PET Market Outlook, By Region, 2016-2030F
- 7.1. North America*
- 7.1.1. Market Size & Forecast
- 7.1.1.1. By Value
- 7.1.1.2. By Volume
- 7.1.2. By Source
- 7.1.2.1. Recycled Waste
- 7.1.2.2. Recycled PET Bottles
- 7.1.2.3. Recycled PET Sheets & Films
- 7.1.2.4. Others
- 7.1.3. By Grade
- 7.1.3.1. Food Grade
- 7.1.3.2. Industrial Grade
- 7.1.4. By Application
- 7.1.4.1. Electricals
- 7.1.4.2. Sheet Manufacturing
- 7.1.4.3. Monofilaments
- 7.1.4.4. Insulations
- 7.1.4.5. Geotextiles
- 7.1.4.6. Strapping
- 7.1.4.7. Blood Collection Tubes (BCT)
- 7.1.4.8. Others
- 7.1.5. By End-user
- 7.1.5.1. Fabric Industry
- 7.1.5.2. Automotive
- 7.1.5.3. Packaging Industry
- 7.1.5.4. Sport Industry
- 7.1.5.5. Carpet Industry
- 7.1.5.6. Others
- 7.1.6. United States*
- 7.1.6.1. Market Size & Forecast
- 7.1.6.1.1. By Value
- 7.1.6.1.2. By Volume
- 7.1.6.2. By Source
- 7.1.6.2.1. Recycled Waste
- 7.1.6.2.2. Recycled PET Bottles
- 7.1.6.2.3. Recycled PET Sheets & Films
- 7.1.6.2.4. Others
- 7.1.6.3. By Grade
- 7.1.6.3.1. Food Grade
- 7.1.6.3.2. Industrial Grade
- 7.1.6.4. By Application
- 7.1.6.4.1. Electricals
- 7.1.6.4.2. Sheet Manufacturing
- 7.1.6.4.3. Monofilaments
- 7.1.6.4.4. Insulations
- 7.1.6.4.5. Geotextiles
- 7.1.6.4.6. Strapping
- 7.1.6.4.7. Blood Collection Tubes (BCT)
- 7.1.6.4.8. Others
- 7.1.6.5. By End-user
- 7.1.6.5.1. Fabric Industry
- 7.1.6.5.2. Automotive
- 7.1.6.5.3. Packaging Industry
- 7.1.6.5.4. Sport Industry
- 7.1.6.5.5. Carpet Industry
- 7.1.6.5.6. Others
- 7.1.7. Canada
- 7.1.8. Mexico
- 7.1.1. Market Size & Forecast
All segments will be provided for all regions and countries covered
- 7.2. Europe
- 7.2.1. Germany
- 7.2.2. France
- 7.2.3. Italy
- 7.2.4. United Kingdom
- 7.2.5. Russia
- 7.2.6. Netherlands
- 7.2.7. Spain
- 7.2.8. Turkey
- 7.2.9. Poland
- 7.3. South America
- 7.3.1. Brazil
- 7.3.2. Argentina
- 7.4. Asia-Pacific
- 7.4.1. India
- 7.4.2. China
- 7.4.3. Japan
- 7.4.4. Australia
- 7.4.5. Vietnam
- 7.4.6. South Korea
- 7.4.7. Indonesia
- 7.4.8. Philippines
- 7.5. Middle East & Africa
- 7.5.1. Saudi Arabia
- 7.5.2. UAE
- 7.5.3. South Africa
8. Supply Side Analysis
- 8.1. Capacity, By Company
- 8.2. Production, By Company
- 8.3. Operating Efficiency, By Company
- 8.4. Key Plant Locations (Up to 25)
9. Market Mapping, 2022
- 9.1. By Source
- 9.2. By Grade
- 9.3. By Application
- 9.4. By End-user
- 9.5. By Region
10. Macro Environment and Industry Structure
- 10.1. Supply Demand Analysis
- 10.2. Import Export Analysis - Volume and Value
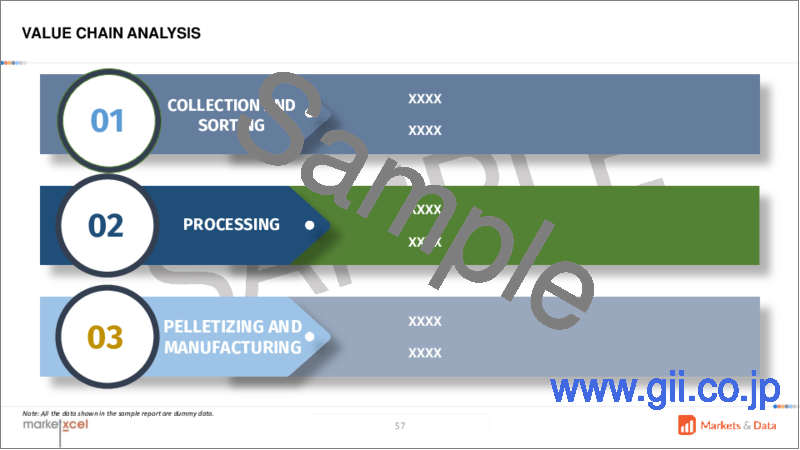
- 10.3. Supply/Value Chain Analysis
- 10.4. PESTEL Analysis
- 10.4.1. Political Factors
- 10.4.2. Economic System
- 10.4.3. Social Implications
- 10.4.4. Technological Advancements
- 10.4.5. Environmental Impacts
- 10.4.6. Legal Compliances and Regulatory Policies (Statutory Bodies Included)
- 10.5. Porter's Five Forces Analysis
- 10.5.1. Supplier Power
- 10.5.2. Buyer Power
- 10.5.3. Substitution Threat
- 10.5.4. Threat from New Entrant
- 10.5.5. Competitive Rivalry
11. Market Dynamics
- 11.1. Growth Drivers
- 11.2. Growth Inhibitors (Challenges, Restraints)
12. Key Players Landscape
- 12.1. Competition Matrix of Top Five Market Leaders
- 12.2. Market Revenue Analysis of Top Five Market Leaders (in %, 2022)
- 12.3. Mergers and Acquisitions/Joint Ventures (If Applicable)
- 12.4. SWOT Analysis (For Five Market Players)
- 12.5. Patent Analysis (If Applicable)
13. Pricing Analysis
14. Case Studies
15. Key Players Outlook
- 15.1. Phoenix Technologies
- 15.1.1. Company Details
- 15.1.2. Key Management Personnel
- 15.1.3. Products & Services
- 15.1.4. Financials (As reported)
- 15.1.5. Key Market Focus & Geographical Presence
- 15.1.6. Recent Developments
- 15.2. Dufor Polyester Specialties
- 15.3. Monosuisse AG
- 15.4. Kordsa Teknik Tekstil A.S.
- 15.5. Takataka Solutions
- 15.6. Worn Again Technologies
- 15.7. Ioniqa Technologies B.V.
- 15.8. Srichakra PolyPlast
- 15.9. PT Tridi Oasis Group
- 15.10. Extrupet (Pty) Ltd
Companies mentioned above DO NOT hold any order as per market share and can be changed as per information available during research work

