|
|
市場調査レポート
商品コード
1355004
グリーン建材の世界市場の評価:製品タイプ別、用途別、エンドユーザー別、地域別、機会、予測(2016年~2030年)Green Building Materials Market Assessment, By Product Type, By Application, By End-user, By Region, Opportunities and Forecast, 2016-2030F |
||||||
|
|
|||||||
カスタマイズ可能
|
|||||||


| グリーン建材の世界市場の評価:製品タイプ別、用途別、エンドユーザー別、地域別、機会、予測(2016年~2030年) |
|
出版日: 2023年10月02日
発行: Markets & Data
ページ情報: 英文 155 Pages
納期: 3~5営業日
|

- 全表示
- 概要
- 図表
- 目次
世界のグリーン建材の市場規模は、2022年の2,763億2,000万米ドルから2030年に6,554億米ドルに達し、2023年~2030年の予測期間中にCAGRで11.4%の成長が予測されています。エネルギー効率の高い建物の開発に対する政府の施策の高まりや、維持費や交換費用の削減を確実にするための商業建設プロジェクトにおけるグリーン建材の展開の増加が、市場成長を促進する大きな要因となっています。
各国の政府は、建築環境に関連する二酸化炭素排出量を最小限に抑え、気候変動の影響を軽減するために、グリーン建材の利用を促進するインセンティブや政府援助など、さまざまな戦略を実施しています。さらに、商業建設活動の急増は、より広い商業スペースに対する需要の増加、新しい医療・インフラの開発、その他の要因によるものです。このように、活況を呈している商業建築活動は、エネルギー効率を最大化するための持続可能性の高い材料への需要を促進しており、これがグリーン建材市場の成長を促進しています。
市場成長を加速するグリーンビルディングプロジェクト
優れた室内空気環境、節水、資源効率などを維持するために、土質材料、ガラス繊維などのLEED認証材料がグリーンビルディングプロジェクトにしばしば展開されています。ヒューマンヘルスを改善し、温室効果ガスの排出を最小限に抑えるための対策の増加が、世界レベルで新しいグリーンビルディングプロジェクトの発展を後押しする主な要因となっています。
例えば、Green Business Certification Inc.によると、2022年、中国は世界のグリーンビルディングランキングで圧倒的な地位を占めています。2021年、中国のグリーンビルディングプロジェクトは1,077ユニットでしたが、2022年に1,121ユニットとなり、4.1%増加しました。したがって、グリーンビルディングプロジェクトの増加は、構造物の優れた耐久性を確保するために、セルロース、ポリウレタン、ファイバーセメントなどのグリーン建材の需要を促進しています。その結果、世界レベルで市場成長が高まっています。
政府の取り組みがグリーンビルディングの発展を後押し
世界の各国の政府は、新たなグリーンビルディングプロジェクトの開発を促進するため、税制優遇、低金利融資、公共調達、迅速な承認、再生可能エネルギーの促進などの措置を講じています。
例えば2020年、英国政府は建設部門における炭素排出をゼロにし、包括的な行動計画、野心的なビジョン、明確な目標を提供するC02nstruct Zeroプログラムを実施しました。C02nstruct Zeroプログラムの主な焦点は、2050年の炭素排出ネットゼロ目標を達成するために、英国でグリーンビルディングプロジェクトの開発を促進することです。このように、グリーンビルディングプロジェクトに対する政府の取り組みが、優れた断熱性と気密性を可能にするグリーン建材の需要を促進し、市場成長を増大させています。
北米が世界を独占する
グリーン建材は、北米の建設企業に、空間構成の変更に対する最小限のコストや優れた設計柔軟性などの利点をもたらします。その結果、北米地域でグリーン建材の採用が増加しています。
COVID-19の影響
2020年のCOVID-19規制は、世界のさまざまな国がロックダウン措置を講じ、建設活動を停止させたため、グリーン建材の需要を抑制しました。その結果、2020年のグリーン建材市場は損失を記録しました。
ロシア・ウクライナ戦争の影響
ロシアとウクライナは、ポリウレタンやグラスファイバーなどのグリーン建材の供給における、欧州各国の主な貿易相手国です。ロシア・ウクライナ戦争は、ポーランドやハンガリーなどの国々におけるグリーン建材の供給を混乱させました。その結果、2022年のグリーンビルディング市場の成長はこれらの国々で制限されました。しかし、戦争による建物の破壊は改修と再建を必要とします。そのため、ウクライナとロシアでは今後数年間、グリーン建材の需要が高まる見込みです。
当レポートでは、世界のグリーン建材市場について調査分析し、市場規模と予測、市場力学、主要企業の情勢と見通しなどを提供しています。
目次
第1章 調査手法
第2章 プロジェクトの範囲と定義
第3章 グリーン建材市場に対するCOVID-19の影響
第4章 ロシア・ウクライナ戦争の影響
第5章 エグゼクティブサマリー
第6章 顧客の声
- 市場の認知度と製品情報
- ブランドの認知度とロイヤルティ
- 購入決定において考慮される要素
- 購入頻度
- 購入媒体
第7章 グリーン建材市場の見通し(2016年~2030年)
- 市場規模と予測
- 金額
- 数量
- 製品タイプ別
- 土質材料
- 構造断熱パネル(SIPs)
- ストローベイル
- 木材
- 断熱コンクリート型枠
- ファイバーグラス
- セルロース
- 天然繊維
- ポリスチレン・イソシアヌレート
- ポリウレタン
- スチール
- スレート/石材
- 複合材料
- ファイバーセメント
- 天然粘土
- その他
- 用途別
- 屋根材
- 床材
- 断熱
- 骨組み
- 外壁サイディング
- 内装仕上げ
- その他
- エンドユーザー別
- 住宅
- 商業
- 工業
- インフラ
- 地域別
- 北米
- 欧州
- 南米
- アジア太平洋
- 中東・アフリカ
- 市場シェア:企業別(2022年)
第8章 グリーン建材市場の見通し:地域別(2016年~2030年)
- 北米
- 市場規模と予測
- 製品タイプ別
- 用途別
- エンドユーザー別
- 米国
- カナダ
- メキシコ
- 欧州
- ドイツ
- フランス
- イタリア
- 英国
- ロシア
- オランダ
- スペイン
- トルコ
- ポーランド
- 南米
- ブラジル
- アルゼンチン
- アジア太平洋
- インド
- 中国
- 日本
- オーストラリア
- ベトナム
- 韓国
- インドネシア
- フィリピン
- 中東・アフリカ
- サウジアラビア
- アラブ首長国連邦
- 南アフリカ
第9章 サプライサイド分析
- 生産能力:企業別
- 生産:企業別
- 営業効率:企業別
- 主な工場の所在地(最大25)
第10章 市場マッピング(2022年)
- 製品タイプ別
- 用途別
- エンドユーザー別
- 地域別
第11章 マクロ環境と産業構造
- 需給分析
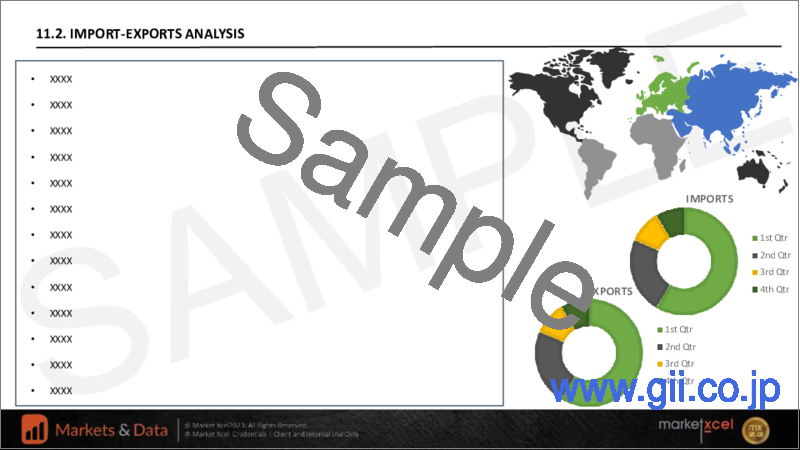
- 輸出入の分析 - 数量と金額
- サプライ/バリューチェーン分析
- PESTEL分析
- ポーターのファイブフォース分析
第12章 市場力学
- 成長促進要因
- 成長抑制要因(課題、抑制要因)
第13章 主要企業情勢
- マーケットリーダー上位5社の競合マトリクス
- マーケットリーダー上位5社市場の収益分析(2022年)
- 合併と買収/合弁事業(該当する場合)
- SWOT分析(市場参入企業5社向け)
- 特許分析(該当する場合)
第14章 価格分析
第15章 ケーススタディ
第16章 主要企業の見通し
- Sika AG
- ACC Limited
- HOLCIM
- CERTAINTEED.
- BASF SE
- Binderholz GmbH
- DuPont.
- Owens Corning.
- Wienerberger AG
- REDBUILT
第17章 戦略的推奨事項
第18章 当社について、免責事項
List of Tables
- Table 1. Pricing Analysis of Products from Key Players
- Table 2. Competition Matrix of Top 5 Market Leaders
- Table 3. Mergers & Acquisitions/ Joint Ventures (If Applicable)
- Table 4. About Us - Regions and Countries Where We Have Executed Client Projects
List of Figures
- Figure 1. Global Green Building Materials Market, By Value, in USD Billion, 2016-2030F
- Figure 2. Global Green Building Materials Market, By Volume, in Tons, 2016-2030F
- Figure 3. Global Green Building Materials Market Share, By Product Type, in USD Billion, 2016-2030F
- Figure 4. Global Green Building Materials Market Share, By Application, in USD Billion, 2016-2030F
- Figure 5. Global Green Building Materials Market Share, By End-user, in USD Billion, 2016-2030F
- Figure 6. Global Green Building Materials Market Share, By Region, in USD Billion, 2016-2030F
- Figure 7. North America Green Building Materials Market, By Value, in USD Billion, 2016-2030F
- Figure 8. North America Green Building Materials Market, By Volume, in Tons, 2016-2030F
- Figure 9. North America Green Building Materials Market Share, By Product Type, in USD Billion, 2016-2030F
- Figure 10. North America Green Building Materials Market Share, By Application, in USD Billion, 2016-2030F
- Figure 11. North America Green Building Materials Market Share, By End-user, in USD Billion, 2016-2030F
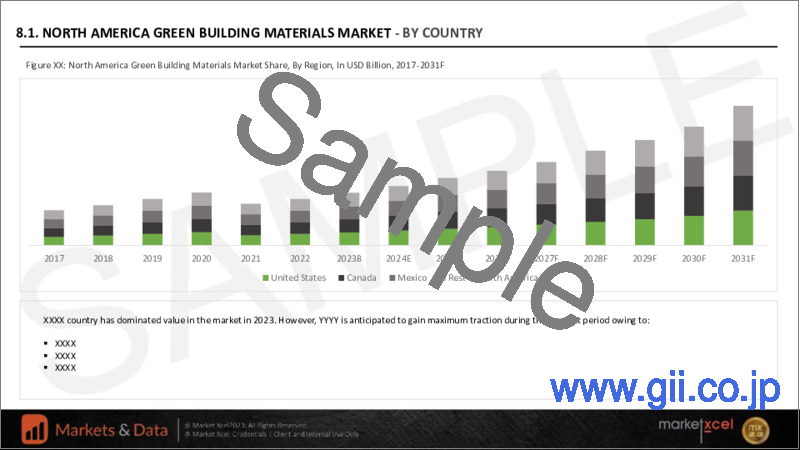
- Figure 12. North America Green Building Materials Market Share, By Country, in USD Billion, 2016-2030F
- Figure 13. United States Green Building Materials Market, By Value, in USD Billion, 2016-2030F
- Figure 14. United States Green Building Materials Market, By Volume, in Tons, 2016-2030F
- Figure 15. United States Green Building Materials Market Share, By Product Type, in USD Billion, 2016-2030F
- Figure 16. United States Green Building Materials Market Share, By Application, in USD Billion, 2016-2030F
- Figure 17. United States Green Building Materials Market Share, By End-user, in USD Billion, 2016-2030F
- Figure 18. Canada Green Building Materials Market, By Value, in USD Billion, 2016-2030F
- Figure 19. Canada Green Building Materials Market, By Volume, in Tons, 2016-2030F
- Figure 20. Canada Green Building Materials Market Share, By Product Type, in USD Billion, 2016-2030F
- Figure 21. Canada Green Building Materials Market Share, By Application, in USD Billion, 2016-2030F
- Figure 22. Canada Green Building Materials Market Share, By End-user, in USD Billion, 2016-2030F
- Figure 23. Mexico Green Building Materials Market, By Value, in USD Billion, 2016-2030F
- Figure 24. Mexico Green Building Materials Market, By Volume, in Tons, 2016-2030F
- Figure 25. Mexico Green Building Materials Market Share, By Product Type, in USD Billion, 2016-2030F
- Figure 26. Mexico Green Building Materials Market Share, By Application, in USD Billion, 2016-2030F
- Figure 27. Mexico Green Building Materials Market Share, By End-user, in USD Billion, 2016-2030F
- Figure 28. Europe Green Building Materials Market, By Value, in USD Billion, 2016-2030F
- Figure 29. Europe Green Building Materials Market, By Volume, in Tons, 2016-2030F
- Figure 30. Europe Green Building Materials Market Share, By Product Type, in USD Billion, 2016-2030F
- Figure 31. Europe Green Building Materials Market Share, By Application, in USD Billion, 2016-2030F
- Figure 32. Europe Green Building Materials Market Share, By End-user, in USD Billion, 2016-2030F
- Figure 33. Europe Green Building Materials Market Share, By Country, in USD Billion, 2016-2030F
- Figure 34. Germany Green Building Materials Market, By Value, in USD Billion, 2016-2030F
- Figure 35. Germany Green Building Materials Market, By Volume, in Tons, 2016-2030F
- Figure 36. Germany Green Building Materials Market Share, By Product Type, in USD Billion, 2016-2030F
- Figure 37. Germany Green Building Materials Market Share, By Application, in USD Billion, 2016-2030F
- Figure 38. Germany Green Building Materials Market Share, By End-user, in USD Billion, 2016-2030F
- Figure 39. France Green Building Materials Market, By Value, in USD Billion, 2016-2030F
- Figure 40. France Green Building Materials Market, By Volume, in Tons, 2016-2030F
- Figure 41. France Green Building Materials Market Share, By Product Type, in USD Billion, 2016-2030F
- Figure 42. France Green Building Materials Market Share, By Application, in USD Billion, 2016-2030F
- Figure 43. France Green Building Materials Market Share, By End-user, in USD Billion, 2016-2030F
- Figure 44. Italy Green Building Materials Market, By Value, in USD Billion, 2016-2030F
- Figure 45. Italy Green Building Materials Market, By Volume, in Tons, 2016-2030F
- Figure 46. Italy Green Building Materials Market Share, By Product Type, in USD Billion, 2016-2030F
- Figure 47. Italy Green Building Materials Market Share, By Application, in USD Billion, 2016-2030F
- Figure 48. Italy Green Building Materials Market Share, By End-user, in USD Billion, 2016-2030F
- Figure 49. United Kingdom Green Building Materials Market, By Value, in USD Billion, 2016-2030F
- Figure 50. United Kingdom Green Building Materials Market, By Volume, in Tons, 2016-2030F
- Figure 51. United Kingdom Green Building Materials Market Share, By Product Type, in USD Billion, 2016-2030F
- Figure 52. United Kingdom Green Building Materials Market Share, By Application, in USD Billion, 2016-2030F
- Figure 53. United Kingdom Green Building Materials Market Share, By End-user, in USD Billion, 2016-2030F
- Figure 54. Russia Green Building Materials Market, By Value, in USD Billion, 2016-2030F
- Figure 55. Russia Green Building Materials Market, By Volume, in Tons, 2016-2030F
- Figure 56. Russia Green Building Materials Market Share, By Product Type, in USD Billion, 2016-2030F
- Figure 57. Russia Green Building Materials Market Share, By Application, in USD Billion, 2016-2030F
- Figure 58. Russia Green Building Materials Market Share, By End-user, in USD Billion, 2016-2030F
- Figure 59. Netherlands Green Building Materials Market, By Value, in USD Billion, 2016-2030F
- Figure 60. Netherlands Green Building Materials Market, By Volume, in Tons, 2016-2030F
- Figure 61. Netherlands Green Building Materials Market Share, By Product Type, in USD Billion, 2016-2030F
- Figure 62. Netherlands Green Building Materials Market Share, By Application, in USD Billion, 2016-2030F
- Figure 63. Netherlands Green Building Materials Market Share, By End-user, in USD Billion, 2016-2030F
- Figure 64. Market, By Value, in USD Billion, 2016-2030F
- Figure 65. Spain Green Building Materials Market, By Volume, in Tons, 2016-2030F
- Figure 66. Spain Green Building Materials Market Share, By Product Type, in USD Billion, 2016-2030F
- Figure 67. Spain Green Building Materials Market Share, By Application, in USD Billion, 2016-2030F
- Figure 68. Spain Green Building Materials Market Share, By End-user, in USD Billion, 2016-2030F
- Figure 69. Turkey Green Building Materials Market, By Value, in USD Billion, 2016-2030F
- Figure 70. Turkey Green Building Materials Market, By Volume, in Tons, 2016-2030F
- Figure 71. Turkey Green Building Materials Market Share, By Product Type, in USD Billion, 2016-2030F
- Figure 72. Turkey Green Building Materials Market Share, By Application, in USD Billion, 2016-2030F
- Figure 73. Turkey Green Building Materials Market Share, By End-user, in USD Billion, 2016-2030F
- Figure 74. Poland Green Building Materials Market, By Value, in USD Billion, 2016-2030F
- Figure 75. Poland Green Building Materials Market, By Volume, in Tons, 2016-2030F
- Figure 76. Poland Green Building Materials Market Share, By Product Type, in USD Billion, 2016-2030F
- Figure 77. Poland Green Building Materials Market Share, By Application, in USD Billion, 2016-2030F
- Figure 78. Poland Green Building Materials Market Share, By End-user, in USD Billion, 2016-2030F
- Figure 79. South America Green Building Materials Market, By Value, in USD Billion, 2016-2030F
- Figure 80. South America Green Building Materials Market, By Volume, in Tons, 2016-2030F
- Figure 81. South America Green Building Materials Market Share, By Product Type, in USD Billion, 2016-2030F
- Figure 82. South America Green Building Materials Market Share, By Application, in USD Billion, 2016-2030F
- Figure 83. South America Green Building Materials Market Share, By End-user, in USD Billion, 2016-2030F
- Figure 84. South America Green Building Materials Market Share, By Country, in USD Billion, 2016-2030F
- Figure 85. Brazil Green Building Materials Market, By Value, in USD Billion, 2016-2030F
- Figure 86. Brazil Green Building Materials Market, By Volume, in Tons, 2016-2030F
- Figure 87. Brazil Green Building Materials Market Share, By Product Type, in USD Billion, 2016-2030F
- Figure 88. Brazil Green Building Materials Market Share, By Application, in USD Billion, 2016-2030F
- Figure 89. Brazil Green Building Materials Market Share, By End-user, in USD Billion, 2016-2030F
- Figure 90. Argentina Green Building Materials Market, By Value, in USD Billion, 2016-2030F
- Figure 91. Argentina Green Building Materials Market, By Volume, in Tons, 2016-2030F
- Figure 92. Argentina Green Building Materials Market Share, By Product Type, in USD Billion, 2016-2030F
- Figure 93. Argentina Green Building Materials Market Share, By Application, in USD Billion, 2016-2030F
- Figure 94. Argentina Green Building Materials Market Share, By End-user, in USD Billion, 2016-2030F
- Figure 95. Asia-Pacific Green Building Materials Market, By Value, in USD Billion, 2016-2030F
- Figure 96. Asia-Pacific Green Building Materials Market, By Volume, in Tons, 2016-2030F
- Figure 97. Asia-Pacific Green Building Materials Market Share, By Product Type, in USD Billion, 2016-2030F
- Figure 98. Asia-Pacific Green Building Materials Market Share, By Application, in USD Billion, 2016-2030F
- Figure 99. Asia-Pacific Green Building Materials Market Share, By End-user, in USD Billion, 2016-2030F
- Figure 100. Asia-Pacific Green Building Materials Market Share, By Country, in USD Billion, 2016-2030F
- Figure 101. India Green Building Materials Market, By Value, in USD Billion, 2016-2030F
- Figure 102. India Green Building Materials Market, By Volume, in Tons, 2016-2030F
- Figure 103. India Green Building Materials Market Share, By Product Type, in USD Billion, 2016-2030F
- Figure 104. India Green Building Materials Market Share, By Application, in USD Billion, 2016-2030F
- Figure 105. India Green Building Materials Market Share, By End-user, in USD Billion, 2016-2030F
- Figure 106. China Green Building Materials Market, By Value, in USD Billion, 2016-2030F
- Figure 107. China Green Building Materials Market, By Volume, in Tons, 2016-2030F
- Figure 108. China Green Building Materials Market Share, By Product Type, in USD Billion, 2016-2030F
- Figure 109. China Green Building Materials Market Share, By Application, in USD Billion, 2016-2030F
- Figure 110. China Green Building Materials Market Share, By End-user, in USD Billion, 2016-2030F
- Figure 111. Japan Green Building Materials Market, By Value, in USD Billion, 2016-2030F
- Figure 112. Japan Green Building Materials Market, By Volume, in Tons, 2016-2030F
- Figure 113. Japan Green Building Materials Market Share, By Product Type, in USD Billion, 2016-2030F
- Figure 114. Japan Green Building Materials Market Share, By Application, in USD Billion, 2016-2030F
- Figure 115. Japan Green Building Materials Market Share, By End-user, in USD Billion, 2016-2030F
- Figure 116. Australia Green Building Materials Market, By Value, in USD Billion, 2016-2030F
- Figure 117. Australia Green Building Materials Market, By Volume, in Tons, 2016-2030F
- Figure 118. Australia Green Building Materials Market Share, By Product Type, in USD Billion, 2016-2030F
- Figure 119. Australia Green Building Materials Market Share, By Application, in USD Billion, 2016-2030F
- Figure 120. Australia Green Building Materials Market Share, By End-user, in USD Billion, 2016-2030F
- Figure 121. Vietnam Green Building Materials Market, By Value, in USD Billion, 2016-2030F
- Figure 122. Vietnam Green Building Materials Market, By Volume, in Tons, 2016-2030F
- Figure 123. Vietnam Green Building Materials Market Share, By Product Type, in USD Billion, 2016-2030F
- Figure 124. Vietnam Green Building Materials Market Share, By Application, in USD Billion, 2016-2030F
- Figure 125. Vietnam Green Building Materials Market Share, By End-user, in USD Billion, 2016-2030F
- Figure 126. South Korea Green Building Materials Market, By Value, in USD Billion, 2016-2030F
- Figure 127. South Korea Green Building Materials Market, By Volume, in Tons, 2016-2030F
- Figure 128. South Korea Green Building Materials Market Share, By Product Type, in USD Billion, 2016-2030F
- Figure 129. South Korea Green Building Materials Market Share, By Application, in USD Billion, 2016-2030F
- Figure 130. South Korea Green Building Materials Market Share, By End-user, in USD Billion, 2016-2030F
- Figure 131. Indonesia Green Building Materials Market, By Value, in USD Billion, 2016-2030F
- Figure 132. Indonesia Green Building Materials Market, By Volume, in Tons, 2016-2030F
- Figure 133. Indonesia Green Building Materials Market Share, By Product Type, in USD Billion, 2016-2030F
- Figure 134. Indonesia Green Building Materials Market Share, By Application, in USD Billion, 2016-2030F
- Figure 135. Indonesia Green Building Materials Market Share, By End-user, in USD Billion, 2016-2030F
- Figure 136. Philippines Green Building Materials Market, By Value, in USD Billion, 2016-2030F
- Figure 137. Philippines Green Building Materials Market, By Volume, in Tons, 2016-2030F
- Figure 138. Philippines Green Building Materials Market Share, By Product Type, in USD Billion, 2016-2030F
- Figure 139. Philippines Green Building Materials Market Share, By Application, in USD Billion, 2016-2030F
- Figure 140. Philippines Green Building Materials Market Share, By End-user, in USD Billion, 2016-2030F
- Figure 141. Middle East & Africa Green Building Materials Market, By Value, in USD Billion, 2016-2030F
- Figure 142. Middle East & Africa Green Building Materials Market, By Volume, in Tons, 2016-2030F
- Figure 143. Middle East & Africa Green Building Materials Market Share, By Product Type, in USD Billion, 2016-2030F
- Figure 144. Middle East & Africa Green Building Materials Market Share, By Application, in USD Billion, 2016-2030F
- Figure 145. Middle East & Africa Green Building Materials Market Share, By End-user, in USD Billion, 2016-2030F
- Figure 146. Middle East & Africa Green Building Materials Market Share, By Country, in USD Billion, 2016-2030F
- Figure 147. Saudi Arabia Green Building Materials Market, By Value, in USD Billion, 2016-2030F
- Figure 148. Saudi Arabia Green Building Materials Market, By Volume, in Tons, 2016-2030F
- Figure 149. Saudi Arabia Green Building Materials Market Share, By Product Type, in USD Billion, 2016-2030F
- Figure 150. Saudi Arabia Green Building Materials Market Share, By Application, in USD Billion, 2016-2030F
- Figure 151. Saudi Arabia Green Building Materials Market Share, By End-user, in USD Billion, 2016-2030F
- Figure 152. UAE Green Building Materials Market, By Value, in USD Billion, 2016-2030F
- Figure 153. UAE Green Building Materials Market, By Volume, in Tons, 2016-2030F
- Figure 154. UAE Green Building Materials Market Share, By Product Type, in USD Billion, 2016-2030F
- Figure 155. UAE Green Building Materials Market Share, By Application, in USD Billion, 2016-2030F
- Figure 156. UAE Green Building Materials Market Share, By End-user, in USD Billion, 2016-2030F
- Figure 157. South Africa Green Building Materials Market, By Value, in USD Billion, 2016-2030F
- Figure 158. South Africa Green Building Materials Market, By Volume, in Tons, 2016-2030F
- Figure 159. South Africa Green Building Materials Market Share, By Product Type, in USD Billion, 2016-2030F
- Figure 160. South Africa Green Building Materials Market Share, By Application, in USD Billion, 2016-2030F
- Figure 161. South Africa Green Building Materials Market Share, By End-user, in USD Billion, 2016-2030F
- Figure 162. By Product Type Map-Market Size (USD Billion) & Growth Rate (%), 2022
- Figure 163. By Application Map-Market Size (USD Billion) & Growth Rate (%), 2022
- Figure 164. By End-user Map-Market Size (USD Billion) & Growth Rate (%), 2022
- Figure 165. By Region Map-Market Size (USD Billion) & Growth Rate (%), 2022
Global green building materials market size was valued at USD 276.32 billion in 2022, which is expected to grow to USD 655.4 billion in 2030, with a CAGR of 11.4% during the forecast period between 2023 and 2030. Rising government measures for energy-efficient building development and the increasing deployment of green building materials in commercial construction projects to ensure reduced maintenance or replacement costs are prominent drivers accelerating the market growth.
Governments in various countries are implementing different strategies such as incentives, government aid, and so on to boost the utilization of green building materials to minimize the carbon footprints related to the built environment and diminish the effects of climate change. Moreover, the surge in commercial construction activities is attributed to factors including increasing demand for larger commercial spaces, the development of new healthcare infrastructure, and others. Thus, the booming commercial construction activities are propelling the demand for highly sustainable materials to maximize energy efficiency, which, in turn, is fostering the green building materials market growth.
Green Building Projects to Accelerate the Market Growth
The Leadership in Energy and Environmental Design (LEED) certified materials such as earthen materials, fiberglass, and others are often deployed in green building projects to maintain superior indoor air quality, water conservation, resource efficiency, etc. Increasing measures to improve human health and minimize greenhouse gas emissions are the major factors bolstering the development of new green building projects at the global level.
For instance, according to Green Business Certification Inc., in 2022, China held the dominant position in the global green building ranking. In 2021, China's green building projects were 1,077 units; in 2022, it was 1,121 units, an increase of 4.1%. Therefore, the rise in green building projects is driving the demand for green building materials such as cellulose, polyurethane, and fiber cement to ensure the superior durability of structures. It, in turn, is increasing market growth at the global level.
Government Initiatives are Boosting the Green Building Development
Governments across the global level are taking measures such as tax benefits, low-interest rate loans, public procurement, fast-track approvals, promotion of renewable energy, etc., to bolster the development of new green building projects.
For instance, in 2020, the United Kingdom government implemented the C02nstruct Zero program to eliminate carbon emissions in the country's construction sector and provide a comprehensive action plan, an ambitious vision, and clear targets. The primary focus of the C02nstruct Zero program is to increase the development of green building projects in the United Kingdom to achieve the 2050 net zero carbon emission targets. Thus, the government initiatives for green building projects are fostering the demand for green building materials to enable superior insulation and air-sealing qualities, thereby augmenting the market growth.
North America to Dominate Globally
Green building materials offer benefits, including minimum costs for changing space configurations and superior design flexibility to North American construction companies. As a result, the adoption of green building materials is increasing in the North American region.
For instance, according to Green Business Certification Inc., in 2022, Canada held the 3rd position in the global green building ranking. In 2021, green building projects in Canada were 205 units; in 2022, it was 248 units, an increase of 4.1%. Hence, the growth in green building projects in North America is accelerating the demand for materials such as earthen materials, fiberglass, cellulose, and others to ensure easy maintenance, which is driving the market growth in the region.
Impact of COVID-19
The COVID-19 restrictions in 2020 restrained the demand for green building materials since various global countries-imposed lockdown measures and halted construction activities. As a result, the green building materials market registered losses in 2020.
For instance, in March 2020, the Indian government imposed COVID-19 protocols, due to which construction activities were halted. Thus, the development of green building projects diminished in 2020, creating a bottleneck for market growth. However, the economic stimulus packages for green construction projects implemented by various countries at the end of 2020 accelerated the demand for green construction materials, propelling the market growth.
Impact of Russia-Ukraine War
Russia and Ukraine are major trade partners for various European countries for the supply of green building materials such as polyurethane, fiberglass, and others. The Russia-Ukraine war disrupted the supply of green building materials in countries such as Poland and Hungary. As a result, the growth of the green building market was limited in the countries in 2022. However, the destruction of buildings due to war will require renovations and reconstruction. Thus, the demand for green building materials will increase in the coming years in Ukraine and Russia.
For instance, according to Ukraine government data, rebuilding buildings and infrastructure damaged during the war could emit 49 million tonnes of carbon emissions. Thus, the increase in construction activities post the completion of the Russia-Ukraine war will spur the demand for green building materials to cut the carbon footprint, thereby creating a lucrative opportunity for market growth.
Key Players Landscape and Outlook
The major market players in the green building materials industry are: Sika AG, ACC Limited, HOLCIM, and CERTAINTEED., and others. The above-mentioned prominent players involved in the manufacturing and supplying materials such as earthen materials, fiberglass, and cellulose are investing in strategies such as new product innovation, acquisitions, facility expansion, and others to increase their market revenue and volume share in the global green building materials market.
In October 2022, HOLCIM, a Switzerland-based manufacturer of green building materials, acquired Wiltshire Heavy Building Materials, a United Kingdom based manufacturer of green building materials such as recycled concrete and aggregates. The acquisition's major focus was to increase HOLCIM's market presence in the United Kingdom's green building materials market.
Table of Contents
1. Research Methodology
2. Project Scope & Definitions
3. Impact of COVID-19 on Green Building Materials Market
4. Impact of Russia-Ukraine War
5. Executive Summary
6. Voice of Customer
- 6.1. Market Awareness and Product Information
- 6.2. Brand Awareness and Loyalty
- 6.3. Factors Considered in Purchase Decision
- 6.3.1. Brand Name
- 6.3.2. Quality
- 6.3.3. Quantity
- 6.3.4. Price
- 6.3.5. Product Specification
- 6.3.6. Application Specification
- 6.3.7. Shelf-Life
- 6.3.8. Availability of Product
- 6.4. Frequency of Purchase
- 6.5. Medium of Purchase
7. Green Building Materials Market Outlook, 2016-2030F
- 7.1. Market Size & Forecast
- 7.1.1. By Value
- 7.1.2. By Volume
- 7.2. By Product Type
- 7.2.1. Earthen Materials
- 7.2.2. Structural Insulated Panels (SIPS)
- 7.2.3. Straw Bale
- 7.2.4. Wood
- 7.2.5. Insulated Concrete Forms
- 7.2.6. Fiber Glass
- 7.2.7. Cellulose
- 7.2.8. Natural Fiber
- 7.2.9. Polystyrene & Isocyanurate
- 7.2.10. Polyurethane
- 7.2.11. Steel
- 7.2.12. Slate/stone
- 7.2.13. Composites
- 7.2.14. Fiber Cement
- 7.2.15. Natural Clay
- 7.2.16. Others
- 7.3. By Application
- 7.3.1. Roofing
- 7.3.2. Flooring
- 7.3.3. Insulation
- 7.3.4. Framing
- 7.3.5. Exterior Siding
- 7.3.6. Interior Finishing
- 7.3.7. Others
- 7.4. By End-user
- 7.4.1. Residential
- 7.4.1.1. Row Houses
- 7.4.1.2. Independent Houses
- 7.4.1.3. Apartments
- 7.4.2. Commercial
- 7.4.2.1. Office Buildings
- 7.4.2.2. Healthcare Facilities
- 7.4.2.3. Retail Stores
- 7.4.2.4. Banks
- 7.4.2.5. Hotels and Restaurants
- 7.4.2.6. Concert Halls and Museums
- 7.4.2.7. Sports Arena
- 7.4.2.8. Educational Institutes
- 7.4.2.9. Others
- 7.4.3. Industrial
- 7.4.4. Infrastructure
- 7.4.4.1. Airports
- 7.4.4.2. Parking Spaces
- 7.4.4.3. Railways
- 7.4.4.4. Others
- 7.4.1. Residential
- 7.5. By Region
- 7.5.1. North America
- 7.5.2. Europe
- 7.5.3. South America
- 7.5.4. Asia-Pacific
- 7.5.5. Middle East and Africa
- 7.6. By Company Market Share (%), 2022
8. Green Building Materials Market Outlook, By Region, 2016-2030F
- 8.1. North America*
- 8.1.1. Market Size & Forecast
- 8.1.1.1. By Value
- 8.1.1.2. By Volume
- 8.1.2. By Product Type
- 8.1.2.1. Earthen Materials
- 8.1.2.2. Structural Insulated Panels (SIPS)
- 8.1.2.3. Straw Bale
- 8.1.2.4. Wood
- 8.1.2.5. Insulated Concrete Forms
- 8.1.2.6. Fiber Glass
- 8.1.2.7. Cellulose
- 8.1.2.8. Natural Fiber
- 8.1.2.9. Polystyrene & Isocyanurate
- 8.1.2.10. Polyurethane
- 8.1.2.11. Steel
- 8.1.2.12. Slate/stone
- 8.1.2.13. Composites
- 8.1.2.14. Fiber Cement
- 8.1.2.15. Natural Clay
- 8.1.2.16. Others
- 8.1.3. By Application
- 8.1.3.1. Roofing
- 8.1.3.2. Flooring
- 8.1.3.3. Insulation
- 8.1.3.4. Interior Finishing
- 8.1.3.5. Others
- 8.1.4. By End-user
- 8.1.4.1. Residential
- 8.1.4.1.1. Row Houses
- 8.1.4.1.2. Independent Houses
- 8.1.4.1.3. Apartments
- 8.1.4.2. Commercial
- 8.1.4.2.1. Office Buildings
- 8.1.4.2.2. Healthcare Facilities
- 8.1.4.2.3. Retail Stores
- 8.1.4.2.4. Banks
- 8.1.4.2.5. Hotels and Restaurants
- 8.1.4.2.6. Concert Halls and Museums
- 8.1.4.2.7. Sports Arena
- 8.1.4.2.8. Educational Institutes
- 8.1.4.2.9. Others
- 8.1.4.3. Industrial
- 8.1.4.4. Infrastructure
- 8.1.4.4.1. Airports
- 8.1.4.4.2. Parking Spaces
- 8.1.4.4.3. Railways
- 8.1.4.4.4. Others
- 8.1.5. United States*
- 8.1.5.1. Market Size & Forecast
- 8.1.5.1.1. By Value
- 8.1.5.1.2. By Volume
- 8.1.5.2. By Product Type
- 8.1.5.2.1. Earthen Materials
- 8.1.5.2.2. Structural Insulated Panels (SIPS)
- 8.1.5.2.3. Straw Bale
- 8.1.5.2.4. Wood
- 8.1.5.2.5. Insulated Concrete Forms
- 8.1.5.2.6. Fiber Glass
- 8.1.5.2.7. Cellulose
- 8.1.5.2.8. Natural Fiber
- 8.1.5.2.9. Polystyrene & Isocyanurate
- 8.1.5.2.10. Polyurethane
- 8.1.5.2.11. Steel
- 8.1.5.2.12. Slate/stone
- 8.1.5.2.13. Composites
- 8.1.5.2.14. Fiber Cement
- 8.1.5.2.15. Natural Clay
- 8.1.5.2.16. Others
- 8.1.5.3. By Application
- 8.1.5.3.1. Roofing
- 8.1.5.3.2. Flooring
- 8.1.5.3.3. Insulation
- 8.1.5.3.4. Interior Finishing
- 8.1.5.3.5. Others
- 8.1.5.4. By End-user
- 8.1.5.4.1. Residential
- 8.1.5.4.1.1. Row Houses
- 8.1.5.4.1.2. Independent Houses
- 8.1.5.4.1.3. Apartments
- 8.1.5.4.2. Commercial
- 8.1.5.4.2.1. Office Buildings
- 8.1.5.4.2.2. Healthcare Facilities
- 8.1.5.4.2.3. Retail Stores
- 8.1.5.4.2.4. Banks
- 8.1.5.4.2.5. Hotels and Restaurants
- 8.1.5.4.2.6. Concert Halls and Museums
- 8.1.5.4.2.7. Sports Arena
- 8.1.5.4.2.8. Educational Institutes
- 8.1.5.4.2.9. Others
- 8.1.5.4.3. Industrial
- 8.1.5.4.4. Infrastructure
- 8.1.5.4.4.1. Airports
- 8.1.5.4.4.2. Parking Spaces
- 8.1.5.4.4.3. Railways
- 8.1.5.4.4.4. Others
- 8.1.6. Canada
- 8.1.7. Mexico
- 8.1.1. Market Size & Forecast
All segments will be provided for all regions and countries covered
- 8.2. Europe
- 8.2.1. Germany
- 8.2.2. France
- 8.2.3. Italy
- 8.2.4. United Kingdom
- 8.2.5. Russia
- 8.2.6. Netherlands
- 8.2.7. Spain
- 8.2.8. Turkey
- 8.2.9. Poland
- 8.3. South America
- 8.3.1. Brazil
- 8.3.2. Argentina
- 8.4. Asia-Pacific
- 8.4.1. India
- 8.4.2. China
- 8.4.3. Japan
- 8.4.4. Australia
- 8.4.5. Vietnam
- 8.4.6. South Korea
- 8.4.7. Indonesia
- 8.4.8. Philippines
- 8.5. Middle East & Africa
- 8.5.1. Saudi Arabia
- 8.5.2. UAE
- 8.5.3. South Africa
9. Supply Side Analysis
- 9.1. Capacity, By Company
- 9.2. Production, By Company
- 9.3. Operating Efficiency, By Company
- 9.4. Key Plant Locations (Up to 25)
10. Market Mapping, 2022
- 10.1. By Product Type
- 10.2. By Application
- 10.3. By End-user
- 10.4. By Region
11. Macro Environment and Industry Structure
- 11.1. Supply Demand Analysis
- 11.2. Import Export Analysis - Volume and Value
- 11.3. Supply/Value Chain Analysis
- 11.4. PESTEL Analysis
- 11.4.1. Political Factors
- 11.4.2. Economic System
- 11.4.3. Social Implications
- 11.4.4. Technological Advancements
- 11.4.5. Environmental Impacts
- 11.4.6. Legal Compliances and Regulatory Policies (Statutory Bodies Included)
- 11.5. Porter's Five Forces Analysis
- 11.5.1. Supplier Power
- 11.5.2. Buyer Power
- 11.5.3. Substitution Threat
- 11.5.4. Threat from New Entrant
- 11.5.5. Competitive Rivalry
12. Market Dynamics
- 12.1. Growth Drivers
- 12.2. Growth Inhibitors (Challenges, Restraints)
13. Key Players Landscape
- 13.1. Competition Matrix of Top Five Market Leaders
- 13.2. Market Revenue Analysis of Top Five Market Leaders (in %, 2022)
- 13.3. Mergers and Acquisitions/Joint Ventures (If Applicable)
- 13.4. SWOT Analysis (For Five Market Players)
- 13.5. Patent Analysis (If Applicable)
14. Pricing Analysis
15. Case Studies
16. Key Players Outlook
- 16.1. Sika AG
- 16.1.1. Company Details
- 16.1.2. Key Management Personnel
- 16.1.3. Products & Services
- 16.1.4. Financials (As reported)
- 16.1.5. Key Market Focus & Geographical Presence
- 16.1.6. Recent Developments
- 16.2. ACC Limited
- 16.3. HOLCIM
- 16.4. CERTAINTEED.
- 16.5. BASF SE
- 16.6. Binderholz GmbH
- 16.7. DuPont.
- 16.8. Owens Corning.
- 16.9. Wienerberger AG
- 16.10. REDBUILT
Companies mentioned above DO NOT hold any order as per market share and can be changed as per information available during research work.
17. Strategic Recommendations
18. About Us & Disclaimer
