|
|
市場調査レポート
商品コード
1352103
低炭素水素の世界市場の評価:エネルギー源別、製品タイプ別、製造プロセス別、最終用途産業別、地域別、機会、予測(2016年~2030年)Low-carbon Hydrogen Market Assessment, By Power Source, By Type, By Production Process, By End-use Industry, By Region, Opportunities and Forecast, 2016-2030F |
||||||
|
|
|||||||
カスタマイズ可能
|
|||||||


| 低炭素水素の世界市場の評価:エネルギー源別、製品タイプ別、製造プロセス別、最終用途産業別、地域別、機会、予測(2016年~2030年) |
|
出版日: 2023年09月28日
発行: Market Xcel - Markets and Data
ページ情報: 英文 140 Pages
納期: 3~5営業日
|

- 全表示
- 概要
- 図表
- 目次
世界の低炭素水素の市場規模は、2022年の605.7キロトンから2030年に3,751.2キロトンに達し、2023年~2030年の予測期間にCAGRで25.6%の成長が予測されています。世界レベルで活況を呈している輸送・石油精製部門は、従来の化石燃料の効率的な代替品を確保するために低炭素水素の需要を加速させており、これが市場の成長促進要因となっています。
各国の政府は、カーボンフットプリントを削減するために厳しい規制措置を講じています。厳しい炭素排出基準により、肥料、鉄鋼、輸送などの炭素排出の多い産業は低炭素水素の採用を促しています。これらの産業は、世界のCO2排出の約25%以上を生み出しています。その結果、低炭素水素の需要は世界中で高まっています。このため、メーカーは低炭素水素生成プラントを新たに開発することになり、予測期間中に市場成長の有利な機会が生まれることになります。
輸送産業の強化
低炭素水素燃料は、従来の化石燃料よりも少ない燃料補給で長距離の走行を可能にします。そのため、低炭素水素は、バス、航空機、船舶、大型トラクタートレーラーなどの公共交通機関の燃料として利用されています。環境に優しい水素を動力源とする新型船舶の開発への投資の増加や、大型トラックの生産台数の増加は、世界レベルで市場成長を促進する顕著な側面です。
例えば、2022年7月、インドの船舶メーカーであるMazagon Dock Shipbuilders Limited(MDL)は、グリーン水素を動力源とする燃料電池電気船舶(FCEV)のプロトタイプを発表しました。したがって、世界レベルでの輸送産業の強化が、内燃機関の燃料として展開される低炭素水素の需要を促進し、市場成長を後押ししています。
石油精製における低炭素水素の採用の増加
低炭素水素は原油の脱硫を助け、大気中への二酸化炭素排出をなくします。再生可能エネルギー源から製造される低炭素水素の採用は、反応器、重油水素化処理装置などの石油精製用途で増加しています。石油精製産業の成長は、生産を最大化するためのグリーン水素の採用の増加や、新しい石油精製所の立ち上げなどの要因によるものです。
例えば、2022年7月、China Petroleum & Chemical Corporation(Sinopec)は、中国北西部のGreen Hydrogen Pilot Projectでグリーン水素の製造を開始しました。この製造プラントは、太陽エネルギーに基づく年間2万トンの生産能力を持ちます。Green Hydrogen Pilot Projectで製造されたグリーン水素は、Sinopecの塔河製油所で利用されます。このように、石油精製での利用に向けて最近開発された低炭素水素プラントは、低炭素目標を達成することが予測され、ひいては市場の成長に利益をもたらしています。
COVID-19の影響
COVID-19パンデミックは、2020年に世界レベルで影響を及ぼし、非必需品のサプライチェーンを混乱させました。そのため、輸送、肥料などの産業における業務に影響を与えました。例えば、OICAによると、2019年の世界レベルでのバスとコーチの生産台数は34万6,220台でしたが、2020年に21万9,453台となり、36.61%減少しました。輸送産業は低炭素水素の大きなエンドユーザーであるため、その生産停止は市場の収益成長に影響を与えました。
しかし、2020年末までに、世界各国の政府が産業界に対する金融刺激策や規制緩和などの施策を実施し、市場成長が増加しました。最終的に、COVID-19パンデミックの影響は根絶され、今後数年間の世界の低炭素市場の力強い成長につながっています。
ロシア・ウクライナ戦争の影響
ロシアは2021年に第3位の原油輸出国となりました。オランダ、ドイツ、ポーランドなどの欧州諸国がロシア原油の主要輸入国です。ロシアのウクライナ侵攻は化石燃料市場に変動をもたらし、クリーンエネルギー技術の活用を促し、石油・ガス製品の短期的な供給制約をもたらしました。
ロシア・ウクライナ戦争は、各国がエネルギー源を多様化し、新たな低炭素水素プロジェクトの開発を促進することにつながっています。例えば、欧州委員会は2022年5月、ロシアの化石燃料輸入から脱却するため、EUの水素戦略を促進するREPowerEU計画を実施しました。この戦略は、新たな低炭素水素施設の開発を促進するものです。したがって、ロシアの化石燃料輸入に対抗する親政府的措置は、欧州における低炭素水素プラントを含む新たな水素製造施設の開発を後押しし、今後数年間の市場成長を増大させています。
当レポートでは、世界の低炭素水素市場について調査分析し、市場規模と予測、市場力学、主要企業の情勢と見通しなどを提供しています。
目次
第1章 調査手法
第2章 プロジェクトの範囲と定義
第3章 世界の低炭素水素市場に対するCOVID-19の影響
第4章 ロシア・ウクライナ戦争の影響
第5章 エグゼクティブサマリー
第6章 顧客の声
- 市場の認知度と製品情報
- ブランドの認知度とロイヤルティ
- 購入決定において考慮される要素
- 購入頻度
- 購入媒体
第7章 低炭素水素市場の見通し(2016年~2030年)
- 市場規模と予測
- 金額
- 数量
- エネルギー源別
- 再生可能エネルギー
- 非再生可能エネルギー
- タイプ別
- グリーン水素
- ブルー水素
- 水の水素
- 製造工程別
- 電解
- ガス化
- 最終用途産業別
- 輸送
- 発電
- 石油精製所
- 鋼鉄
- 肥料
- その他
- 地域別
- 北米
- 欧州
- 南米
- アジア太平洋
- 中東・アフリカ
- 市場シェア:企業別(2022年)
第8章 低炭素水素市場の見通し:地域別(2016年~2030年)
- 北米
- 市場規模と予測
- エネルギー源別
- タイプ別
- 製造工程別
- 最終用途産業別
- 米国
- カナダ
- メキシコ
- 欧州
- ドイツ
- フランス
- イタリア
- 英国
- ロシア
- オランダ
- スペイン
- トルコ
- ポーランド
- 南米
- ブラジル
- アルゼンチン
- アジア太平洋
- インド
- 中国
- 日本
- オーストラリア
- ベトナム
- 韓国
- インドネシア
- フィリピン
- 中東・アフリカ
- サウジアラビア
- アラブ首長国連邦
- 南アフリカ
第9章 サプライサイド分析
- 生産能力:企業別
- 生産:企業別
- 営業効率:企業別
- 主な工場の所在地(最大25)
第10章 市場マッピング(2022年)
- エネルギー源別
- タイプ別
- 製造工程別
- 最終用途産業別
- 地域別
第11章 マクロ環境と産業構造
- 需給分析
- 輸出入の分析 - 数量と金額
- サプライ/バリューチェーン分析
- PESTEL分析
- ポーターのファイブフォース分析
第12章 市場力学
- 成長促進要因
- 成長抑制要因(課題、抑制要因)
第13章 主要企業情勢
- マーケットリーダー上位5社の競合マトリクス
- マーケットリーダー上位5社市場の収益分析(2022年)
- 合併と買収/合弁事業(該当する場合)
- SWOT分析(市場参入企業5社向け)
- 特許分析(該当する場合)
第14章 価格分析
第15章 ケーススタディ
第16章 主要企業の見通し
- Technip Energies N.V.
- Exxon Mobil Corporation.
- Plug Power Inc.
- China Petrochemical Corporation
- Linde plc
- Shell Plc
- Ballard Power Systems.
- Bloom Energy
- GeoPura, Ltd.
- Uniper SE
第17章 戦略的推奨事項
第18章 当社について、免責事項
List of Tables
- Table 1. Pricing Analysis of Products from Key Players
- Table 2. Competition Matrix of Top 5 Market Leaders
- Table 3. Mergers & Acquisitions/ Joint Ventures (If Applicable)
- Table 4. About Us - Regions and Countries Where We Have Executed Client Projects
List of Figures
- Figure 1. Global Low-Carbon Hydrogen Market, By Value, In USD Million, 2016-2030F
- Figure 2. Global Low-Carbon Hydrogen Market, By Volume, In Tons, 2016-2030F
- Figure 3. Global Low-Carbon Hydrogen Market Share, By Power Source, In USD Million, 2016-2030F
- Figure 4. Global Low-Carbon Hydrogen Market Share, By Type, In USD Million, 2016-2030F
- Figure 5. Global Low-Carbon Hydrogen Market Share, By Production Process, In USD Million, 2016-2030F
- Figure 6. Global Low-Carbon Hydrogen Market Share, By End-User, In USD Million, 2016-2030F
- Figure 7. Global Low-Carbon Hydrogen Market Share, By Region, In USD Million, 2016-2030F
- Figure 8. North America Low-Carbon Hydrogen Market, By Value, In USD Million, 2016-2030F
- Figure 9. North America Low-Carbon Hydrogen Market, By Volume, In Tons, 2016-2030F
- Figure 10. North America Low-Carbon Hydrogen Market Share, By Power Source, In USD Million, 2016-2030F
- Figure 11. North America Low-Carbon Hydrogen Market Share, By Type, In USD Million, 2016-2030F
- Figure 12. North America Low-Carbon Hydrogen Market Share, By Production Process, In USD Million, 2016-2030F
- Figure 13. North America Low-Carbon Hydrogen Market Share, By End-User, In USD Million, 2016-2030F
- Figure 14. North America Low-Carbon Hydrogen Market Share, By Country, In USD Million, 2016-2030F
- Figure 15. United States Low-Carbon Hydrogen Market, By Value, In USD Million, 2016-2030F
- Figure 16. United States Low-Carbon Hydrogen Market, By Volume, In Tons, 2016-2030F
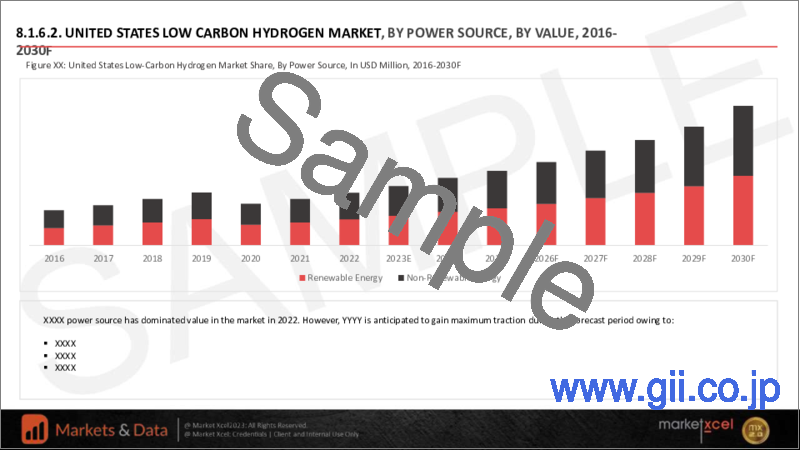
- Figure 17. United States Low-Carbon Hydrogen Market Share, By Power Source, In USD Million, 2016-2030F
- Figure 18. United States Low-Carbon Hydrogen Market Share, By Type, In USD Million, 2016-2030F
- Figure 19. United States Low-Carbon Hydrogen Market Share, By Production Process, In USD Million, 2016-2030F
- Figure 20. United States Low-Carbon Hydrogen Market Share, By End-User, In USD Million, 2016-2030F
- Figure 21. Canada Low-Carbon Hydrogen Market, By Value, In USD Million, 2016-2030F
- Figure 22. Canada Low-Carbon Hydrogen Market, By Volume, In Tons, 2016-2030F
- Figure 23. Canada Low-Carbon Hydrogen Market Share, By Power Source, In USD Million, 2016-2030F
- Figure 24. Canada Low-Carbon Hydrogen Market Share, By Type, In USD Million, 2016-2030F
- Figure 25. Canada Low-Carbon Hydrogen Market Share, By Production Process, In USD Million, 2016-2030F
- Figure 26. Canada Low-Carbon Hydrogen Market Share, By End-User, In USD Million, 2016-2030F
- Figure 27. Mexico Low-Carbon Hydrogen Market, By Value, In USD Million, 2016-2030F
- Figure 28. Mexico Low-Carbon Hydrogen Market, By Volume, In Tons, 2016-2030F
- Figure 29. Mexico Low-Carbon Hydrogen Market Share, By Power Source, In USD Million, 2016-2030F
- Figure 30. Mexico Low-Carbon Hydrogen Market Share, By Type, In USD Million, 2016-2030F
- Figure 31. Mexico Low-Carbon Hydrogen Market Share, By Production Process, In USD Million, 2016-2030F
- Figure 32. Mexico Low-Carbon Hydrogen Market Share, By End-User, In USD Million, 2016-2030F
- Figure 33. Europe Low-Carbon Hydrogen Market, By Value, In USD Million, 2016-2030F
- Figure 34. Europe Low-Carbon Hydrogen Market, By Volume, In Tons, 2016-2030F
- Figure 35. Europe Low-Carbon Hydrogen Market Share, By Power Source, In USD Million, 2016-2030F
- Figure 36. Europe Low-Carbon Hydrogen Market Share, By Type, In USD Million, 2016-2030F
- Figure 37. Europe Low-Carbon Hydrogen Market Share, By Production Process, In USD Million, 2016-2030F
- Figure 38. Europe Low-Carbon Hydrogen Market Share, By End-User, In USD Million, 2016-2030F
- Figure 39. Europe Low-Carbon Hydrogen Market Share, By Country, In USD Million, 2016-2030F
- Figure 40. Germany Low-Carbon Hydrogen Market, By Value, In USD Million, 2016-2030F
- Figure 41. Germany Low-Carbon Hydrogen Market, By Volume, In Tons, 2016-2030F
- Figure 42. Germany Low-Carbon Hydrogen Market Share, By Power Source, In USD Million, 2016-2030F
- Figure 43. Germany Low-Carbon Hydrogen Market Share, By Type, In USD Million, 2016-2030F
- Figure 44. Germany Low-Carbon Hydrogen Market Share, By Production Process, In USD Million, 2016-2030F
- Figure 45. Germany Low-Carbon Hydrogen Market Share, By End-User, In USD Million, 2016-2030F
- Figure 46. France Low-Carbon Hydrogen Market, By Value, In USD Million, 2016-2030F
- Figure 47. France Low-Carbon Hydrogen Market, By Volume, In Tons, 2016-2030F
- Figure 48. France Low-Carbon Hydrogen Market Share, By Power Source, In USD Million, 2016-2030F
- Figure 49. France Low-Carbon Hydrogen Market Share, By Type, In USD Million, 2016-2030F
- Figure 50. France Low-Carbon Hydrogen Market Share, By Production Process, In USD Million, 2016-2030F
- Figure 51. France Low-Carbon Hydrogen Market Share, By End-User, In USD Million, 2016-2030F
- Figure 52. Italy Low-Carbon Hydrogen Market, By Value, In USD Million, 2016-2030F
- Figure 53. Italy Low-Carbon Hydrogen Market, By Volume, In Tons, 2016-2030F
- Figure 54. Italy Low-Carbon Hydrogen Market Share, By Power Source, In USD Million, 2016-2030F
- Figure 55. Italy Low-Carbon Hydrogen Market Share, By Type, In USD Million, 2016-2030F
- Figure 56. Italy Low-Carbon Hydrogen Market Share, By Production Process, In USD Million, 2016-2030F
- Figure 57. Italy Low-Carbon Hydrogen Market Share, By End-User, In USD Million, 2016-2030F
- Figure 58. United Kingdom Low-Carbon Hydrogen Market, By Value, In USD Million, 2016-2030F
- Figure 59. United Kingdom Low-Carbon Hydrogen Market, By Volume, In Tons, 2016-2030F
- Figure 60. United Kingdom Low-Carbon Hydrogen Market Share, By Power Source, In USD Million, 2016-2030F
- Figure 61. United Kingdom Low-Carbon Hydrogen Market Share, By Type, In USD Million, 2016-2030F
- Figure 62. United Kingdom Low-Carbon Hydrogen Market Share, By Production Process, In USD Million, 2016-2030F
- Figure 63. United Kingdom Low-Carbon Hydrogen Market Share, By End-User, In USD Million, 2016-2030F
- Figure 64. Russia Low-Carbon Hydrogen Market, By Value, In USD Million, 2016-2030F
- Figure 65. Russia Low-Carbon Hydrogen Market, By Volume, In Tons, 2016-2030F
- Figure 66. Russia Low-Carbon Hydrogen Market Share, By Power Source, In USD Million, 2016-2030F
- Figure 67. Russia Low-Carbon Hydrogen Market Share, By Type, In USD Million, 2016-2030F
- Figure 68. Russia Low-Carbon Hydrogen Market Share, By Production Process, In USD Million, 2016-2030F
- Figure 69. Russia Low-Carbon Hydrogen Market Share, By End-User, In USD Million, 2016-2030F
- Figure 70. Netherlands Low-Carbon Hydrogen Market, By Value, In USD Million, 2016-2030F
- Figure 71. Netherlands Low-Carbon Hydrogen Market, By Volume, In Tons, 2016-2030F
- Figure 72. Netherlands Low-Carbon Hydrogen Market Share, By Power Source, In USD Million, 2016-2030F
- Figure 73. Netherlands Low-Carbon Hydrogen Market Share, By Type, In USD Million, 2016-2030F
- Figure 74. Netherlands Low-Carbon Hydrogen Market Share, By Production Process, In USD Million, 2016-2030F
- Figure 75. Netherlands Low-Carbon Hydrogen Market Share, By End-User, In USD Million, 2016-2030F
- Figure 76. Spain Low-Carbon Hydrogen Market, By Value, In USD Million, 2016-2030F
- Figure 77. Spain Low-Carbon Hydrogen Market, By Volume, In Tons, 2016-2030F
- Figure 78. Spain Low-Carbon Hydrogen Market Share, By Power Source, In USD Million, 2016-2030F
- Figure 79. Spain Low-Carbon Hydrogen Market Share, By Type, In USD Million, 2016-2030F
- Figure 80. Spain Low-Carbon Hydrogen Market Share, By Production Process, In USD Million, 2016-2030F
- Figure 81. Spain Low-Carbon Hydrogen Market Share, By End-User, In USD Million, 2016-2030F
- Figure 82. Turkey Low-Carbon Hydrogen Market, By Value, In USD Million, 2016-2030F
- Figure 83. Turkey Low-Carbon Hydrogen Market, By Volume, In Tons, 2016-2030F
- Figure 84. Turkey Low-Carbon Hydrogen Market Share, By Power Source, In USD Million, 2016-2030F
- Figure 85. Turkey Low-Carbon Hydrogen Market Share, By Type, In USD Million, 2016-2030F
- Figure 86. Turkey Low-Carbon Hydrogen Market Share, By Production Process, In USD Million, 2016-2030F
- Figure 87. Turkey Low-Carbon Hydrogen Market Share, By End-User, In USD Million, 2016-2030F
- Figure 88. Poland Low-Carbon Hydrogen Market, By Value, In USD Million, 2016-2030F
- Figure 89. Poland Low-Carbon Hydrogen Market, By Volume, In Tons, 2016-2030F
- Figure 90. Poland Low-Carbon Hydrogen Market Share, By Power Source, In USD Million, 2016-2030F
- Figure 91. Poland Low-Carbon Hydrogen Market Share, By Type, In USD Million, 2016-2030F
- Figure 92. Poland Low-Carbon Hydrogen Market Share, By Production Process, In USD Million, 2016-2030F
- Figure 93. Poland Low-Carbon Hydrogen Market Share, By End-User, In USD Million, 2016-2030F
- Figure 94. South America Low-Carbon Hydrogen Market, By Value, In USD Million, 2016-2030F
- Figure 95. South America Low-Carbon Hydrogen Market, By Volume, In Tons, 2016-2030F
- Figure 96. South America Low-Carbon Hydrogen Market Share, By Power Source, In USD Million, 2016-2030F
- Figure 97. South America Low-Carbon Hydrogen Market Share, By Type, In USD Million, 2016-2030F
- Figure 98. South America Low-Carbon Hydrogen Market Share, By Production Process, In USD Million, 2016-2030F
- Figure 99. South America Low-Carbon Hydrogen Market Share, By End-User, In USD Million, 2016-2030F
- Figure 100. South America Low-Carbon Hydrogen Market Share, By Country, In USD Million, 2016-2030F
- Figure 101. Brazil Low-Carbon Hydrogen Market, By Value, In USD Million, 2016-2030F
- Figure 102. Brazil Low-Carbon Hydrogen Market, By Volume, In Tons, 2016-2030F
- Figure 103. Brazil Low-Carbon Hydrogen Market Share, By Power Source, In USD Million, 2016-2030F
- Figure 104. Brazil Low-Carbon Hydrogen Market Share, By Type, In USD Million, 2016-2030F
- Figure 105. Brazil Low-Carbon Hydrogen Market Share, By Production Process, In USD Million, 2016-2030F
- Figure 106. Brazil Low-Carbon Hydrogen Market Share, By End-User, In USD Million, 2016-2030F
- Figure 107. Argentina Low-Carbon Hydrogen Market, By Value, In USD Million, 2016-2030F
- Figure 108. Argentina Low-Carbon Hydrogen Market, By Volume, In Tons, 2016-2030F
- Figure 109. Argentina Low-Carbon Hydrogen Market Share, By Power Source, In USD Million, 2016-2030F
- Figure 110. Argentina Low-Carbon Hydrogen Market Share, By Type, In USD Million, 2016-2030F
- Figure 111. Argentina Low-Carbon Hydrogen Market Share, By Production Process, In USD Million, 2016-2030F
- Figure 112. Argentina Low-Carbon Hydrogen Market Share, By End-User, In USD Million, 2016-2030F
- Figure 113. Asia-Pacific Low-Carbon Hydrogen Market, By Value, In USD Million, 2016-2030F
- Figure 114. Asia-Pacific Low-Carbon Hydrogen Market, By Volume, In Tons, 2016-2030F
- Figure 115. Asia-Pacific Low-Carbon Hydrogen Market Share, By Power Source, In USD Million, 2016-2030F
- Figure 116. Asia-Pacific Low-Carbon Hydrogen Market Share, By Type, In USD Million, 2016-2030F
- Figure 117. Asia-Pacific Low-Carbon Hydrogen Market Share, By Production Process, In USD Million, 2016-2030F
- Figure 118. Asia- Pacific Cream Market Share, By End-User, In USD Million, 2016-2030F
- Figure 119. Asia-Pacific Low-Carbon Hydrogen Market Share, By Country, In USD Million, 2016-2030F
- Figure 120. India Low-Carbon Hydrogen Market, By Value, In USD Million, 2016-2030F
- Figure 121. India Low-Carbon Hydrogen Market, By Volume, In Tons, 2016-2030F
- Figure 122. India Low-Carbon Hydrogen Market Share, By Power Source, In USD Million, 2016-2030F
- Figure 123. India Low-Carbon Hydrogen Market Share, By Type, In USD Million, 2016-2030F
- Figure 124. India Low-Carbon Hydrogen Market Share, By Production Process, In USD Million, 2016-2030F
- Figure 125. India Low-Carbon Hydrogen Market Share, By End-User, In USD Million, 2016-2030F
- Figure 126. China Low-Carbon Hydrogen Market, By Value, In USD Million, 2016-2030F
- Figure 127. China Low-Carbon Hydrogen Market, By Volume, In Tons, 2016-2030F
- Figure 128. China Low-Carbon Hydrogen Market Share, By Power Source, In USD Million, 2016-2030F
- Figure 129. China Low-Carbon Hydrogen Market Share, By Type, In USD Million, 2016-2030F
- Figure 130. China Low-Carbon Hydrogen Market Share, By Production Process, In USD Million, 2016-2030F
- Figure 131. China Low-Carbon Hydrogen Market Share, By End-User, In USD Million, 2016-2030F
- Figure 132. Japan Low-Carbon Hydrogen Market, By Value, In USD Million, 2016-2030F
- Figure 133. Japan Low-Carbon Hydrogen Market, By Volume, In Tons, 2016-2030F
- Figure 134. Japan Low-Carbon Hydrogen Market Share, By Power Source, In USD Million, 2016-2030F
- Figure 135. Japan Low-Carbon Hydrogen Market Share, By Type, In USD Million, 2016-2030F
- Figure 136. Japan Low-Carbon Hydrogen Market Share, By Production Process, In USD Million, 2016-2030F
- Figure 137. Japan Low-Carbon Hydrogen Market Share, By End-User, In USD Million, 2016-2030F
- Figure 138. Australia Low-Carbon Hydrogen Market, By Value, In USD Million, 2016-2030F
- Figure 139. Australia Low-Carbon Hydrogen Market, By Volume, In Tons, 2016-2030F
- Figure 140. Australia Low-Carbon Hydrogen Market Share, By Power Source, In USD Million, 2016-2030F
- Figure 141. Australia Low-Carbon Hydrogen Market Share, By Type, In USD Million, 2016-2030F
- Figure 142. Australia Low-Carbon Hydrogen Market Share, By Production Process, In USD Million, 2016-2030F
- Figure 143. Australia Low-Carbon Hydrogen Market Share, By End-User, In USD Million, 2016-2030F
- Figure 144. Vietnam Low-Carbon Hydrogen Market, By Value, In USD Million, 2016-2030F
- Figure 145. Vietnam Low-Carbon Hydrogen Market, By Volume, In Tons, 2016-2030F
- Figure 146. Vietnam Low-Carbon Hydrogen Market Share, By Power Source, In USD Million, 2016-2030F
- Figure 147. Vietnam Low-Carbon Hydrogen Market Share, By Type, In USD Million, 2016-2030F
- Figure 148. Vietnam Low-Carbon Hydrogen Market Share, By Production Process, In USD Million, 2016-2030F
- Figure 149. Vietnam Low-Carbon Hydrogen Market Share, By End-User, In USD Million, 2016-2030F
- Figure 150. South Korea Low-Carbon Hydrogen Market, By Value, In USD Million, 2016-2030F
- Figure 151. South Korea Low-Carbon Hydrogen Market, By Volume, In Tons, 2016-2030F
- Figure 152. South Korea Low-Carbon Hydrogen Market Share, By Power Source, In USD Million, 2016-2030F
- Figure 153. South Korea Low-Carbon Hydrogen Market Share, By Type, In USD Million, 2016-2030F
- Figure 154. South Korea Low-Carbon Hydrogen Market Share, By Production Process, In USD Million, 2016-2030F
- Figure 155. South Korea Low-Carbon Hydrogen Market Share, By End-User, In USD Million, 2016-2030F
- Figure 156. Indonesia Low-Carbon Hydrogen Market, By Value, In USD Million, 2016-2030F
- Figure 157. Indonesia Low-Carbon Hydrogen Market, By Volume, In Tons, 2016-2030F
- Figure 158. Indonesia Low-Carbon Hydrogen Market Share, By Power Source, In USD Million, 2016-2030F
- Figure 159. Indonesia Low-Carbon Hydrogen Market Share, By Type, In USD Million, 2016-2030F
- Figure 160. Indonesia Low-Carbon Hydrogen Market Share, By Production Process, In USD Million, 2016-2030F
- Figure 161. Indonesia Low-Carbon Hydrogen Market Share, By End-User, In USD Million, 2016-2030F
- Figure 162. Philippines Low-Carbon Hydrogen Market, By Value, In USD Million, 2016-2030F
- Figure 163. Philippines Low-Carbon Hydrogen Market, By Volume, In Tons, 2016-2030F
- Figure 164. Philippines Low-Carbon Hydrogen Market Share, By Power Source, In USD Million, 2016-2030F
- Figure 165. Philippines Low-Carbon Hydrogen Market Share, By Type, In USD Million, 2016-2030F
- Figure 166. Philippines Low-Carbon Hydrogen Market Share, By Production Process, In USD Million, 2016-2030F
- Figure 167. Philippines Low-Carbon Hydrogen Market Share, By End-User, In USD Million, 2016-2030F
- Figure 168. Middle East & Africa Low-Carbon Hydrogen Market, By Value, In USD Million, 2016-2030F
- Figure 169. Middle East & Africa Low-Carbon Hydrogen Market, By Volume, In Tons, 2016-2030F
- Figure 170. Middle East & Africa Low-Carbon Hydrogen Market Share, By Power Source, In USD Million, 2016-2030F
- Figure 171. Middle East & Africa Low-Carbon Hydrogen Market Share, By Type, In USD Million, 2016-2030F
- Figure 172. Middle East & Africa Low-Carbon Hydrogen Market Share, By Production Process, In USD Million, 2016-2030F
- Figure 173. Middle East & Africa Low-Carbon Hydrogen Market Share, By End-User, In USD Million, 2016-2030F
- Figure 174. Middle East & Africa Low-Carbon Hydrogen Market Share, By Country, In USD Million, 2016-2030F
- Figure 175. Saudi Arabia Low-Carbon Hydrogen Market, By Value, In USD Million, 2016-2030F
- Figure 176. Saudi Arabia Low-Carbon Hydrogen Market, By Volume, In Tons, 2016-2030F
- Figure 177. Saudi Arabia Low-Carbon Hydrogen Market Share, By Power Source, In USD Million, 2016-2030F
- Figure 178. Saudi Arabia Low-Carbon Hydrogen Market Share, By Type, In USD Million, 2016-2030F
- Figure 179. Saudi Arabia Low-Carbon Hydrogen Market Share, By Production Process, In USD Million, 2016-2030F
- Figure 180. Saudi Arabia Low-Carbon Hydrogen Market Share, By End-User, In USD Million, 2016-2030F
- Figure 181. UAE Low-Carbon Hydrogen Market, By Value, In USD Million, 2016-2030F
- Figure 182. UAE Low-Carbon Hydrogen Market, By Volume, In Tons, 2016-2030F
- Figure 183. UAE Low-Carbon Hydrogen Market Share, By Power Source, In USD Million, 2016-2030F
- Figure 184. UAE Low-Carbon Hydrogen Market Share, By Type, In USD Million, 2016-2030F
- Figure 185. UAE Low-Carbon Hydrogen Market Share, By Production Process, In USD Million, 2016-2030F
- Figure 186. UAE Low-Carbon Hydrogen Market Share, By End-User, In USD Million, 2016-2030F
- Figure 187. South Africa Low-Carbon Hydrogen Market, By Value, In USD Million, 2016-2030F
- Figure 188. South Africa Low-Carbon Hydrogen Market, By Volume, In Tons, 2016-2030F
- Figure 189. South Africa Low-Carbon Hydrogen Market Share, By Power Source, In USD Million, 2016-2030F
- Figure 190. South Africa Low-Carbon Hydrogen Market Share, By Type, In USD Million, 2016-2030F
- Figure 191. South Africa Low-Carbon Hydrogen Market Share, By Production Process, In USD Million, 2016-2030F
- Figure 192. South Africa Low-Carbon Hydrogen Market Share, By End-User, In USD Million, 2016-2030F
- Figure 193. By Power Source Map-Market Size (USD Million) & Growth Rate (%), 2022
- Figure 194. By Type Map-Market Size (USD Million) & Growth Rate (%), 2022
- Figure 195. By Production Process Map-Market Size (USD Million) & Growth Rate (%), 2022
- Figure 196. By End-User Map-Market Size (USD Million) & Growth Rate (%), 2022
- Figure 197. By Region Map-Market Size (USD Million) & Growth Rate (%), 2022
Global low-carbon hydrogen market size was recorded at 605.7 kilo tons in 2022, which is expected to reach 3751.2 kilo tons in 2030, with a CAGR of 25.6% for the forecast period between 2023 and 2030. The booming transportation and oil refineries sectors at the global level are accelerating the demand for low-carbon hydrogen to ensure efficient substitution of traditional fossil fuels, which is driving the market growth.
Governments in various countries are undertaking stringent regulatory measures to reduce their carbon footprint. The strict carbon emission standards are prompting high carbon footprint-generating industries, such as fertilizers, steel, transportation, and others, to adopt low-carbon hydrogen. These industries generate approximately 25% or more of global CO2 emissions. As a result, the demand for low-carbon hydrogen is increasing worldwide. This, in turn, leads the manufacturers to develop new low-carbon hydrogen-generating plants, thereby creating a lucrative opportunity for market growth during the projected period.
Bolstering Transportation Industry
The low-carbon hydrogen fuel enables vehicles to travel longer distances with less refueling than traditional fossil fuels. Hence, low-carbon hydrogen is utilized in fueling public transit, such as buses, aircraft, marine vessels, heavy-duty tractor-trailers, and others. The increasing investments in the development of new green hydrogen-powered marine vessels and the rising production of heavy-duty trucks are prominent aspects boosting the market growth at the global level.
For instance, in July 2022, Mazagon Dock Shipbuilders Limited (MDL), a marine vessel manufacturer in India introduced Fuel Cell Electric Vessel (FCEV) prototype powered by green hydrogen. Hence, the bolstering transportation industry at the global level is fostering the demand for low-carbon hydrogen as it is deployed as a fuel in the internal combustible engine, propelling the market growth.
The Rising Adoption of Low-carbon Hydrogen in Oil Refineries
Low-carbon hydrogen provides aid in desulfurizing crude oil and eliminates carbon footprint generation into the atmosphere. The employment of low-carbon hydrogen manufactured from renewable energy sources is increasing in oil refinery applications such as reactors, heavy oil hydrotreating units, and others. The growth of the oil refinery industry is attributed to factors such as the increasing adoption of green hydrogen to maximize production output and the launch of new oil refineries.
For instance, in July 2022, China Petroleum & Chemical Corporation (Sinopec), started the production of green hydrogen in the Green Hydrogen Pilot Project in Northwest China. The manufacturing plant has a production capacity of 20,000 tonnes per year based on solar energy. The green hydrogen manufactured in the Green Hydrogen Pilot Project will be utilized in Sinopec's Tahe refinery. Thus, the recently developed low-carbon hydrogen plants for application in the oil refinery are expected to achieve low-carbon targets, which, in turn, is benefiting the market growth.
Impact of COVID-19
The COVID-19 pandemic impacted the global level in the year 2020, disrupting the supply chain of non-essential products. Thus, impacting the operations in industries such as transportation, fertilizers, and others. For instance, according to the Organisation Internationale des Constructeurs d'Automobiles (OICA), in 2019, the production of buses and coaches at the global level was 346,220 units. In 2020, it was 219,453 units, a decline of 36.61%. Since the transportation industry is a prominent end-user of low-carbon hydrogen, the halt in its production impacted the revenue growth of the low-carbon hydrogen market.
However, by the end of 2020, governments worldwide implemented measures such as monetary stimulus packages for industries and ease of COVID-19 restrictions, increasing market growth. Eventually, the impact of the COVID-19 pandemic was eradicated, which led to a robust global low-carbon market growth in the upcoming years.
Impact of Russia-Ukraine War
Russia was ranked as the 3rd leading crude oil exporter in 2021. The European countries, including the Netherlands, Germany, Poland, and others are the major importers for Russian crude oil. The Russian invasion of Ukraine posed volatility in fossil fuel markets, which prompted the utilization of clean energy technologies and a short-term supply constraint for oil and gas products.
The conflict between Russia and Ukraine has resulted in countries diversifying their energy sources, promoting the development of new low-carbon hydrogen projects. For instance, in May 2022, the European Commission implemented the REPowerEU plan to foster the EU hydrogen strategy to move away from Russia's fossil fuel imports. The strategy promotes the development of new low-carbon hydrogen facilities. Therefore, the pro-government measures to counter Russian fossil fuel imports are boosting the development of new hydrogen production facilities, including low-carbon hydrogen plants in the European region, augmenting market growth in the upcoming years.
Key Players Landscape and Outlook
The key players offering low-carbon hydrogen leverage their technological potential to develop low-carbon hydrogen plants. The focus of the market players such as Technip Energies N.V., Exxon Mobil Corporation., Plug Power Inc., China Petrochemical Corporation, and others are on the adoption of various strategies like infrastructure development for new plants, reducing the overall production cost and increasing efficiency.
For instance, in January 2023, Exxon Mobil Corporation provided a front-end engineering and design (FEED) contract to develop a new low-carbon hydrogen project in the United States. The construction of the Exxon Mobil Corporation low-carbon hydrogen project is expected to commence in 2024. Furthermore, the project will commence production of low-carbon hydrogen in the year 2026-2027. Thus, the low-carbon hydrogen manufacturing facility will be linked with the olefins production plant in the United States to ensure superior sustainability for end products.
Table of Contents
1. Research Methodology
2. Project Scope & Definitions
3. Impact of COVID-19 on Global Low-carbon Hydrogen Market
4. Impact of Russia-Ukraine War
5. Executive Summary
6. Voice of Customer
- 6.1. Market Awareness and Product Information
- 6.2. Brand Awareness and Loyalty
- 6.3. Factors Considered in Purchase Decision
- 6.3.1. Brand Name
- 6.3.2. Quality
- 6.3.3. Quantity
- 6.3.4. Price
- 6.3.5. Product Specification
- 6.3.6. Application Specification
- 6.3.7. VOC/Toxicity Content
- 6.3.8. Availability of Product
- 6.4. Frequency of Purchase
- 6.5. Medium of Purchase
7. Low-carbon Hydrogen Market Outlook, 2016-2030F
- 7.1. Market Size & Forecast
- 7.1.1. By Value
- 7.1.2. By Volume
- 7.2. By Power Source
- 7.2.1. Renewable Energy
- 7.2.1.1. Solar
- 7.2.1.2. Wind
- 7.2.1.3. Biomass
- 7.2.1.4. Others
- 7.2.2. Non-renewable Energy
- 7.2.2.1. Fossil Fuel
- 7.2.2.2. Nuclear
- 7.2.1. Renewable Energy
- 7.3. By Type
- 7.3.1. Green Hydrogen
- 7.3.2. Blue Hydrogen
- 7.3.3. Aqua Hydrogen
- 7.4. By Production Process
- 7.4.1. Electrolysis
- 7.4.2. Gasification
- 7.5. By End-use Industry
- 7.5.1. Transportation
- 7.5.1.1. Automotive
- 7.5.1.2. Aerospace
- 7.5.1.3. Marine
- 7.5.1.4. Locomotive
- 7.5.2. Power Generation
- 7.5.3. Oil Refineries
- 7.5.4. Steel
- 7.5.5. Fertilizers
- 7.5.6. Others
- 7.5.1. Transportation
- 7.6. By Region
- 7.6.1. North America
- 7.6.2. Europe
- 7.6.3. South America
- 7.6.4. Asia-Pacific
- 7.6.5. Middle East and Africa
- 7.7. By Company Market Share (%), 2022
8. Low-carbon Hydrogen Market Outlook, By Region, 2016-2030F
- 8.1. North America*
- 8.1.1. Market Size & Forecast
- 8.1.1.1. By Value
- 8.1.1.2. By Volume
- 8.1.2. By Power Source
- 8.1.2.1. Renewable Energy
- 8.1.2.1.1. Solar Wind Biomass Others
- 8.1.2.1.2. Wind
- 8.1.2.1.3. Biomass
- 8.1.2.1.4. Others
- 8.1.2.2. Non-renewable Energy
- 8.1.2.2.1. Fossil Fuel
- 8.1.2.2.2. Nuclear
- 8.1.3. By Type
- 8.1.3.1. Green Hydrogen
- 8.1.3.2. Blue Hydrogen
- 8.1.3.3. Aqua Hydrogen
- 8.1.4. By Production Process
- 8.1.4.1. Electrolysis
- 8.1.4.2. Gasification
- 8.1.5. By End-use Industry
- 8.1.5.1. Transportation
- 8.1.5.1.1. Automotive
- 8.1.5.1.2. Aerospace
- 8.1.5.1.3. Marine
- 8.1.5.1.4. Locomotive
- 8.1.5.1.5. Power Generation
- 8.1.5.2. Oil Refineries
- 8.1.5.3. Steel
- 8.1.5.4. Fertilizers
- 8.1.5.5. Others
- 8.1.6. United States*
- 8.1.6.1. Market Size & Forecast
- 8.1.6.1.1. By Value
- 8.1.6.1.2. By Volume
- 8.1.6.2. By Power Source
- 8.1.6.2.1. Renewable Energy
- 8.1.6.2.1.1. Solar
- 8.1.6.2.1.2. Wind
- 8.1.6.2.1.3. Biomass
- 8.1.6.2.1.4. Others
- 8.1.6.2.2. Non-renewable Energy
- 8.1.6.2.2.1. Fossil Fuel
- 8.1.6.2.2.2. Nuclear
- 8.1.6.3. By Type
- 8.1.6.3.1. Green Hydrogen
- 8.1.6.3.2. Blue Hydrogen
- 8.1.6.3.3. Aqua Hydrogen
- 8.1.6.4. By Production Process
- 8.1.6.4.1. Electrolysis
- 8.1.6.4.2. Gasification
- 8.1.6.5. By End-use Industry
- 8.1.6.5.1. Transportation
- 8.1.6.5.1.1. Automotive
- 8.1.6.5.1.2. Aerospace
- 8.1.6.5.1.3. Marine
- 8.1.6.5.1.4. Locomotive
- 8.1.6.5.2. Power Generation
- 8.1.6.5.3. Oil Refineries
- 8.1.6.5.4. Steel
- 8.1.6.5.5. Fertilizers
- 8.1.6.5.6. Others
- 8.1.7. Canada
- 8.1.8. Mexico
- 8.1.1. Market Size & Forecast
All segments will be provided for all regions and countries covered
- 8.2. Europe
- 8.2.1. Germany
- 8.2.2. France
- 8.2.3. Italy
- 8.2.4. United Kingdom
- 8.2.5. Russia
- 8.2.6. Netherlands
- 8.2.7. Spain
- 8.2.8. Turkey
- 8.2.9. Poland
- 8.3. South America
- 8.3.1. Brazil
- 8.3.2. Argentina
- 8.4. Asia-Pacific
- 8.4.1. India
- 8.4.2. China
- 8.4.3. Japan
- 8.4.4. Australia
- 8.4.5. Vietnam
- 8.4.6. South Korea
- 8.4.7. Indonesia
- 8.4.8. Philippines
- 8.5. Middle East & Africa
- 8.5.1. Saudi Arabia
- 8.5.2. UAE
- 8.5.3. South Africa
9. Supply Side Analysis
- 9.1. Capacity, By Company
- 9.2. Production, By Company
- 9.3. Operating Efficiency, By Company
- 9.4. Key Plant Locations (Up to 25)
10. Market Mapping, 2022
- 10.1. By Power Source
- 10.2. By Type
- 10.3. By Production Process
- 10.4. By End-use Industry
- 10.5. By Region
11. Macro Environment and Industry Structure
- 11.1. Supply Demand Analysis
- 11.2. Import Export Analysis - Volume and Value
- 11.3. Supply/Value Chain Analysis
- 11.4. PESTEL Analysis
- 11.4.1. Political Factors
- 11.4.2. Economic System
- 11.4.3. Social Implications
- 11.4.4. Technological Advancements
- 11.4.5. Environmental Impacts
- 11.4.6. Legal Compliances and Regulatory Policies (Statutory Bodies Included)
- 11.5. Porter's Five Forces Analysis
- 11.5.1. Supplier Power
- 11.5.2. Buyer Power
- 11.5.3. Substitution Threat
- 11.5.4. Threat from New Entrant
- 11.5.5. Competitive Rivalry
12. Market Dynamics
- 12.1. Growth Drivers
- 12.2. Growth Inhibitors (Challenges, Restraints)
13. Key Players Landscape
- 13.1. Competition Matrix of Top Five Market Leaders
- 13.2. Market Revenue Analysis of Top Five Market Leaders (in %, 2022)
- 13.3. Mergers and Acquisitions/Joint Ventures (If Applicable)
- 13.4. SWOT Analysis (For Five Market Players)
- 13.5. Patent Analysis (If Applicable)
14. Pricing Analysis
15. Case Studies
16. Key Players Outlook
- 16.1. Technip Energies N.V.
- 16.1.1. Company Details
- 16.1.2. Key Management Personnel
- 16.1.3. Products & Services
- 16.1.4. Financials (As reported)
- 16.1.5. Key Market Focus & Geographical Presence
- 16.1.6. Recent Developments
- 16.2. Exxon Mobil Corporation.
- 16.3. Plug Power Inc.
- 16.4. China Petrochemical Corporation
- 16.5. Linde plc
- 16.6. Shell Plc
- 16.7. Ballard Power Systems.
- 16.8. Bloom Energy
- 16.9. GeoPura, Ltd.
- 16.10. Uniper SE
Companies mentioned above DO NOT hold any order as per market share and can be changed as per information available during research work.
17. Strategic Recommendations
18. About Us & Disclaimer