|
|
市場調査レポート
商品コード
1347133
宇宙燃料の世界市場 (2016-2030年):推進剤タイプ・コンポーネン・ビークルタイプ・地域別の機会および予測Space Fuel Market Assessment, By Propellant Type, By Component, By Vehicle Type, By Region, Opportunities and Forecast, 2016-2030F |
||||||
|
|
|||||||
カスタマイズ可能
|
|||||||


| 宇宙燃料の世界市場 (2016-2030年):推進剤タイプ・コンポーネン・ビークルタイプ・地域別の機会および予測 |
|
出版日: 2023年09月12日
発行: Markets & Data
ページ情報: 英文 135 Pages
納期: 3~5営業日
|

- 全表示
- 概要
- 図表
- 目次
宇宙燃料の市場規模は、2022年の139億米ドルから、予測期間中は14.7%のCAGRで推移し、2030年には416億米ドルの規模に成長すると予測されています。 新しい人工衛星の打ち上げや宇宙旅行への熱狂が、技術の進歩を促進し、宇宙関連企業による事業の拡大を促しています。ロケットや革新的な人工衛星の製造が宇宙探査に計り知れない可能性を生み出しており、これらの分野では、さまざまなタイプの宇宙燃料が必要とされています。宇宙燃料は、このような機会を最高レベルへと導くための重要な役割を担っています。有人宇宙探査は科学的発見や重要なブレークスルーをもたらすため、政府や民間企業に宇宙開発プログラムへの投資を促しています。宇宙燃料の発明がなければ、これらのプログラムはどれも実現不可能であり、さまざまな宇宙燃料の重要性が認識されています。
環境に優しい宇宙燃料の開発により、ロケットエンジンで燃料を燃焼する際に発生する温室効果ガスの排出量を低く抑えることができます。国単位で見ると、米国は、軍事的に重要な通信システムから、宇宙飛行士、衛星、ペイロードを含む国際宇宙ステーションの成果物まで、主要な宇宙プログラムに貢献しています。宇宙燃料やロケットの推進剤は、約175秒から最大300~350秒の範囲で特定のインパルスを効果的に供給します。人工衛星や宇宙船を打ち上げるには、毎秒約5マイルの速度をロケットに与え、地球の大気圏を脱出するのを助ける膨大な量の燃料が必要です。宇宙産業の成長に伴い、宇宙燃料の世界市場も指数関数的に成長しています。
当レポートでは、世界の宇宙燃料の市場を調査し、市場の定義と概要、市場規模の推移・予測、各種区分・地域別の詳細分析、産業構造、市場成長への影響因子の分析、ケーススタディ、競合情勢、主要企業のプロファイルなどをまとめています。
目次
第1章 調査手法
第2章 プロジェクトの範囲と定義
第3章 COVID-19が宇宙燃料市場に与える影響
第4章 ロシア・ウクライナ戦争の影響
第5章 エグゼクティブサマリー
第6章 顧客の声
- 市場認識と製品情報
- ブランドの認知度とロイヤルティ
- 購入決定時に考慮される要素
- 購入頻度
- 購入媒体
第7章 宇宙燃料市場の展望
- 市場規模・予測
- 推進剤タイプ別
- 固体化学推進剤
- 液体化学推進剤
- ハイブリッド推進剤
- コンポーネント別
- 燃焼室
- ノズル、熱交換器
- フロー制御デバイス
- その他
- ビークルタイプ別
- 衛星打ち上げロケット
- 有人ロケット
- 再利用可能ロケット
- その他
- 地域別
- 北米
- 欧州
- 南米
- アジア太平洋
- 中東・アフリカ
- 企業別市場シェア
第8章 宇宙燃料市場の展望:地域別
- 北米
- 欧州
- 南米
- アジア太平洋
- 中東・アフリカ
第9章 供給サイド分析
- 製造能力:企業別
- 製造量:企業別
- 稼働効率:企業別
- 主要工場の所在地
第10章 市場マッピング
- 推進剤タイプ別
- コンポーネント別
- ビークルタイプ別
- 地域別
第11章 マクロ環境・産業構造
- 需給分析
- 輸出入分析
- サプライチェーン/バリューチェーン分析
- PESTEL分析
- ポーターのファイブフォース分析
第12章 市場力学
- 成長推進因子
- 成長抑制因子 (課題・制約)
第13章 主要企業の情勢
- 市場リーダー上位5社の競合マトリックス
- 市場リーダー上位5社の市場収益分析
- M&A(該当する場合)
- SWOT分析(参入5社)
- 特許分析(該当する場合)
第14章 価格分析
第15章 ケーススタディ
第16章 主要企業の見通し
- Safran S.A.
- IHI Corporation
- SpaceX
- L3Harris Technologies Inc.
- Northrop Grumman Corporation
- Blue Origin
- Oxeon Energy, LLC.
- Skyroot Aerospace
- Rocket Lab
- European Space Agency
第17章 戦略的提言
第18章 当社について・免責事項
List of Tables
- Table 1. Pricing Analysis of Products from Key Players
- Table 2. Competition Matrix of Top 5 Market Leaders
- Table 3. Mergers & Acquisitions/ Joint Ventures (If Applicable)
- Table 4. About Us - Regions and Countries Where We Have Executed Client Projects
List of Figures
- Figure 1. Global Space Fuel Market, By Value, in USD Billion, 2016-2030F
- Figure 2. Global Space Fuel Market, By Volume, in Tons, 2016-2030F
- Figure 3. Global Space Fuel Market Share, By Propellant Type, in USD Billion, 2016-2030F
- Figure 4. Global Space Fuel Market Share, By Component, in USD Billion, 2016-2030F
- Figure 5. Global Space Fuel Market Share, By Vehicle Type, in USD Billion, 2016-2030F
- Figure 6. Global Space Fuel Market Share, By Region, in USD Billion, 2016-2030F
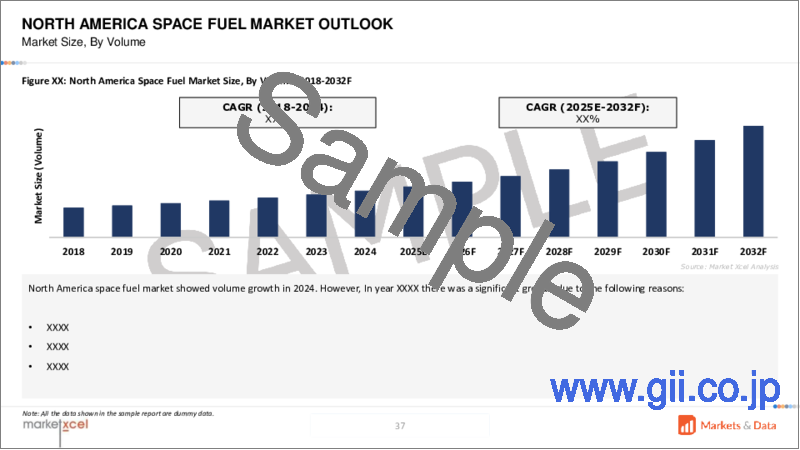
- Figure 7. North America Space Fuel Market, By Value, in USD Billion, 2016-2030F
- Figure 8. North America Space Fuel Market, By Volume, in Tons, 2016-2030F
- Figure 9. North America Space Fuel Market Share, By Propellant Type, in USD Billion, 2016-2030F
- Figure 10. North America Space Fuel Market Share, By Component, in USD Billion, 2016-2030F
- Figure 11. North America Space Fuel Market Share, By Vehicle Type, in USD Billion, 2016-2030F
- Figure 12. North America Space Fuel Market Share, By Country, in USD Billion, 2016-2030F
- Figure 13. United States Space Fuel Market, By Value, in USD Billion, 2016-2030F
- Figure 14. United States Space Fuel Market, By Volume, in Tons, 2016-2030F
- Figure 15. United States Space Fuel Market Share, By Propellant Type, in USD Billion, 2016-2030F
- Figure 16. United States Space Fuel Market Share, By Component, in USD Billion, 2016-2030F
- Figure 17. United States Space Fuel Market Share, By Vehicle Type, in USD Billion, 2016-2030F
- Figure 18. Canada Space Fuel Market, By Value, in USD Billion, 2016-2030F
- Figure 19. Canada Space Fuel Market, By Volume, in Tons, 2016-2030F
- Figure 20. Canada Space Fuel Market Share, By Propellant Type, in USD Billion, 2016-2030F
- Figure 21. Canada Space Fuel Market Share, By Component, in USD Billion, 2016-2030F
- Figure 22. Canada Space Fuel Market Share, By Vehicle Type, in USD Billion, 2016-2030F
- Figure 23. Mexico Space Fuel Market, By Value, in USD Billion, 2016-2030F
- Figure 24. Mexico Space Fuel Market, By Volume, in Tons, 2016-2030F
- Figure 25. Mexico Space Fuel Market Share, By Propellant Type, in USD Billion, 2016-2030F
- Figure 26. Mexico Space Fuel Market Share, By Component, in USD Billion, 2016-2030F
- Figure 27. Mexico Space Fuel Market Share, By Vehicle Type, in USD Billion, 2016-2030F
- Figure 28. Europe Space Fuel Market, By Value, in USD Billion, 2016-2030F
- Figure 29. Europe Space Fuel Market, By Volume, in Tons, 2016-2030F
- Figure 30. Europe Space Fuel Market Share, By Propellant Type, in USD Billion, 2016-2030F
- Figure 31. Europe Space Fuel Market Share, By Component, in USD Billion, 2016-2030F
- Figure 32. Europe Space Fuel Market Share, By Vehicle Type, in USD Billion, 2016-2030F
- Figure 33. Europe Space Fuel Market Share, By Country, in USD Billion, 2016-2030F
- Figure 34. Germany Space Fuel Market, By Value, in USD Billion, 2016-2030F
- Figure 35. Germany Space Fuel Market, By Volume, in Tons, 2016-2030F
- Figure 36. Germany Space Fuel Market Share, By Propellant Type, in USD Billion, 2016-2030F
- Figure 37. Germany Space Fuel Market Share, By Component, in USD Billion, 2016-2030F
- Figure 38. Germany Space Fuel Market Share, By Vehicle Type, in USD Billion, 2016-2030F
- Figure 39. France Space Fuel Market, By Value, in USD Billion, 2016-2030F
- Figure 40. France Space Fuel Market, By Volume, in Tons, 2016-2030F
- Figure 41. France Space Fuel Market Share, By Propellant Type, in USD Billion, 2016-2030F
- Figure 42. France Space Fuel Market Share, By Component, in USD Billion, 2016-2030F
- Figure 43. France Space Fuel Market Share, By Vehicle Type, in USD Billion, 2016-2030F
- Figure 44. Italy Space Fuel Market, By Value, in USD Billion, 2016-2030F
- Figure 45. Italy Space Fuel Market, By Volume, in Tons, 2016-2030F
- Figure 46. Italy Space Fuel Market Share, By Propellant Type, in USD Billion, 2016-2030F
- Figure 47. Italy Space Fuel Market Share, By Component, in USD Billion, 2016-2030F
- Figure 48. Italy Space Fuel Market Share, By Vehicle Type, in USD Billion, 2016-2030F
- Figure 49. United Kingdom Space Fuel Market, By Value, in USD Billion, 2016-2030F
- Figure 50. United Kingdom Space Fuel Market, By Volume, in Tons, 2016-2030F
- Figure 51. United Kingdom Space Fuel Market Share, By Propellant Type, in USD Billion, 2016-2030F
- Figure 52. United Kingdom Space Fuel Market Share, By Component, in USD Billion, 2016-2030F
- Figure 53. United Kingdom Space Fuel Market Share, By Vehicle Type, in USD Billion, 2016-2030F
- Figure 54. Russia Space Fuel Market, By Value, in USD Billion, 2016-2030F
- Figure 55. Russia Space Fuel Market, By Volume, in Tons, 2016-2030F
- Figure 56. Russia Space Fuel Market Share, By Propellant Type, in USD Billion, 2016-2030F
- Figure 57. Russia Space Fuel Market Share, By Component, in USD Billion, 2016-2030F
- Figure 58. Russia Space Fuel Market Share, By Vehicle Type, in USD Billion, 2016-2030F
- Figure 59. Netherlands Space Fuel Market, By Value, in USD Billion, 2016-2030F
- Figure 60. Netherlands Space Fuel Market, By Volume, in Tons, 2016-2030F
- Figure 61. Netherlands Space Fuel Market Share, By Propellant Type, in USD Billion, 2016-2030F
- Figure 62. Netherlands Space Fuel Market Share, By Component, in USD Billion, 2016-2030F
- Figure 63. Netherlands Space Fuel Market Share, By Vehicle Type, in USD Billion, 2016-2030F
- Figure 64. Market, By Value, in USD Billion, 2016-2030F
- Figure 65. Spain Space Fuel Market, By Volume, in Tons, 2016-2030F
- Figure 66. Spain Space Fuel Market Share, By Propellant Type, in USD Billion, 2016-2030F
- Figure 67. Spain Space Fuel Market Share, By Component, in USD Billion, 2016-2030F
- Figure 68. Spain Space Fuel Market Share, By Vehicle Type, in USD Billion, 2016-2030F
- Figure 69. Turkey Space Fuel Market, By Value, in USD Billion, 2016-2030F
- Figure 70. Turkey Space Fuel Market, By Volume, in Tons, 2016-2030F
- Figure 71. Turkey Space Fuel Market Share, By Propellant Type, in USD Billion, 2016-2030F
- Figure 72. Turkey Space Fuel Market Share, By Component, in USD Billion, 2016-2030F
- Figure 73. Turkey Space Fuel Market Share, By Vehicle Type, in USD Billion, 2016-2030F
- Figure 74. Poland Space Fuel Market, By Value, in USD Billion, 2016-2030F
- Figure 75. Poland Space Fuel Market, By Volume, in Tons, 2016-2030F
- Figure 76. Poland Space Fuel Market Share, By Propellant Type, in USD Billion, 2016-2030F
- Figure 77. Poland Space Fuel Market Share, By Component, in USD Billion, 2016-2030F
- Figure 78. Poland Space Fuel Market Share, By Vehicle Type, in USD Billion, 2016-2030F
- Figure 79. South America Space Fuel Market, By Value, in USD Billion, 2016-2030F
- Figure 80. South America Space Fuel Market, By Volume, in Tons, 2016-2030F
- Figure 81. South America Space Fuel Market Share, By Propellant Type, in USD Billion, 2016-2030F
- Figure 82. South America Space Fuel Market Share, By Component, in USD Billion, 2016-2030F
- Figure 83. South America Space Fuel Market Share, By Vehicle Type, in USD Billion, 2016-2030F
- Figure 84. South America Space Fuel Market Share, By Country, in USD Billion, 2016-2030F
- Figure 85. Brazil Space Fuel Market, By Value, in USD Billion, 2016-2030F
- Figure 86. Brazil Space Fuel Market, By Volume, in Tons, 2016-2030F
- Figure 87. Brazil Space Fuel Market Share, By Propellant Type, in USD Billion, 2016-2030F
- Figure 88. Brazil Space Fuel Market Share, By Component, in USD Billion, 2016-2030F
- Figure 89. Brazil Space Fuel Market Share, By Vehicle Type, in USD Billion, 2016-2030F
- Figure 90. Argentina Space Fuel Market, By Value, in USD Billion, 2016-2030F
- Figure 91. Argentina Space Fuel Market, By Volume, in Tons, 2016-2030F
- Figure 92. Argentina Space Fuel Market Share, By Propellant Type, in USD Billion, 2016-2030F
- Figure 93. Argentina Space Fuel Market Share, By Component, in USD Billion, 2016-2030F
- Figure 94. Argentina Space Fuel Market Share, By Vehicle Type, in USD Billion, 2016-2030F
- Figure 95. Asia-Pacific Space Fuel Market, By Value, in USD Billion, 2016-2030F
- Figure 96. Asia-Pacific Space Fuel Market, By Volume, in Tons, 2016-2030F
- Figure 97. Asia-Pacific Space Fuel Market Share, By Propellant Type, in USD Billion, 2016-2030F
- Figure 98. Asia-Pacific Space Fuel Market Share, By Component, in USD Billion, 2016-2030F
- Figure 99. Asia-Pacific Space Fuel Market Share, By Vehicle Type, in USD Billion, 2016-2030F
- Figure 100. Asia-Pacific Space Fuel Market Share, By Country, in USD Billion, 2016-2030F
- Figure 101. India Space Fuel Market, By Value, in USD Billion, 2016-2030F
- Figure 102. India Space Fuel Market, By Volume, in Tons, 2016-2030F
- Figure 103. India Space Fuel Market Share, By Propellant Type, in USD Billion, 2016-2030F
- Figure 104. India Space Fuel Market Share, By Component, in USD Billion, 2016-2030F
- Figure 105. India Space Fuel Market Share, By Vehicle Type, in USD Billion, 2016-2030F
- Figure 106. China Space Fuel Market, By Value, in USD Billion, 2016-2030F
- Figure 107. China Space Fuel Market, By Volume, in Tons, 2016-2030F
- Figure 108. China Space Fuel Market Share, By Propellant Type, in USD Billion, 2016-2030F
- Figure 109. China Space Fuel Market Share, By Component, in USD Billion, 2016-2030F
- Figure 110. China Space Fuel Market Share, By Vehicle Type, in USD Billion, 2016-2030F
- Figure 111. Japan Space Fuel Market, By Value, in USD Billion, 2016-2030F
- Figure 112. Japan Space Fuel Market, By Volume, in Tons, 2016-2030F
- Figure 113. Japan Space Fuel Market Share, By Propellant Type, in USD Billion, 2016-2030F
- Figure 114. Japan Space Fuel Market Share, By Component, in USD Billion, 2016-2030F
- Figure 115. Japan Space Fuel Market Share, By Vehicle Type, in USD Billion, 2016-2030F
- Figure 116. Australia Space Fuel Market, By Value, in USD Billion, 2016-2030F
- Figure 117. Australia Space Fuel Market, By Volume, in Tons, 2016-2030F
- Figure 118. Australia Space Fuel Market Share, By Propellant Type, in USD Billion, 2016-2030F
- Figure 119. Australia Space Fuel Market Share, By Component, in USD Billion, 2016-2030F
- Figure 120. Australia Space Fuel Market Share, By Vehicle Type, in USD Billion, 2016-2030F
- Figure 121. Vietnam Space Fuel Market, By Value, in USD Billion, 2016-2030F
- Figure 122. Vietnam Space Fuel Market, By Volume, in Tons, 2016-2030F
- Figure 123. Vietnam Space Fuel Market Share, By Propellant Type, in USD Billion, 2016-2030F
- Figure 124. Vietnam Space Fuel Market Share, By Component, in USD Billion, 2016-2030F
- Figure 125. Vietnam Space Fuel Market Share, By Vehicle Type, in USD Billion, 2016-2030F
- Figure 126. South Korea Space Fuel Market, By Value, in USD Billion, 2016-2030F
- Figure 127. South Korea Space Fuel Market, By Volume, in Tons, 2016-2030F
- Figure 128. South Korea Space Fuel Market Share, By Propellant Type, in USD Billion, 2016-2030F
- Figure 129. South Korea Space Fuel Market Share, By Component, in USD Billion, 2016-2030F
- Figure 130. South Korea Space Fuel Market Share, By Vehicle Type, in USD Billion, 2016-2030F
- Figure 131. Indonesia Space Fuel Market, By Value, in USD Billion, 2016-2030F
- Figure 132. Indonesia Space Fuel Market, By Volume, in Tons, 2016-2030F
- Figure 133. Indonesia Space Fuel Market Share, By Propellant Type, in USD Billion, 2016-2030F
- Figure 134. Indonesia Space Fuel Market Share, By Component, in USD Billion, 2016-2030F
- Figure 135. Indonesia Space Fuel Market Share, By Vehicle Type, in USD Billion, 2016-2030F
- Figure 136. Philippines Space Fuel Market, By Value, in USD Billion, 2016-2030F
- Figure 137. Philippines Space Fuel Market, By Volume, in Tons, 2016-2030F
- Figure 138. Philippines Space Fuel Market Share, By Propellant Type, in USD Billion, 2016-2030F
- Figure 139. Philippines Space Fuel Market Share, By Component, in USD Billion, 2016-2030F
- Figure 140. Philippines Space Fuel Market Share, By Vehicle Type, in USD Billion, 2016-2030F
- Figure 141. Middle East & Africa Space Fuel Market, By Value, in USD Billion, 2016-2030F
- Figure 142. Middle East & Africa Space Fuel Market, By Volume, in Tons, 2016-2030F
- Figure 143. Middle East & Africa Space Fuel Market Share, By Propellant Type, in USD Billion, 2016-2030F
- Figure 144. Middle East & Africa Space Fuel Market Share, By Component, in USD Billion, 2016-2030F
- Figure 145. Middle East & Africa Space Fuel Market Share, By Vehicle Type, in USD Billion, 2016-2030F
- Figure 146. Middle East & Africa Space Fuel Market Share, By Country, in USD Billion, 2016-2030F
- Figure 147. Saudi Arabia Space Fuel Market, By Value, in USD Billion, 2016-2030F
- Figure 148. Saudi Arabia Space Fuel Market, By Volume, in Tons, 2016-2030F
- Figure 149. Saudi Arabia Space Fuel Market Share, By Propellant Type, in USD Billion, 2016-2030F
- Figure 150. Saudi Arabia Space Fuel Market Share, By Component, in USD Billion, 2016-2030F
- Figure 151. Saudi Arabia Space Fuel Market Share, By Vehicle Type, in USD Billion, 2016-2030F
- Figure 152. UAE Space Fuel Market, By Value, in USD Billion, 2016-2030F
- Figure 153. UAE Space Fuel Market, By Volume, in Tons, 2016-2030F
- Figure 154. UAE Space Fuel Market Share, By Propellant Type, in USD Billion, 2016-2030F
- Figure 155. UAE Space Fuel Market Share, By Component, in USD Billion, 2016-2030F
- Figure 156. UAE Space Fuel Market Share, By Vehicle Type, in USD Billion, 2016-2030F
- Figure 157. South Africa Space Fuel Market, By Value, in USD Billion, 2016-2030F
- Figure 158. South Africa Space Fuel Market, By Volume, in Tons, 2016-2030F
- Figure 159. South Africa Space Fuel Market Share, By Propellant Type, in USD Billion, 2016-2030F
- Figure 160. South Africa Space Fuel Market Share, By Component, in USD Billion, 2016-2030F
- Figure 161. South Africa Space Fuel Market Share, By Vehicle Type, in USD Billion, 2016-2030F
- Figure 162. By Propellant Type Map-Market Size (USD Billion) & Growth Rate (%), 2022
- Figure 163. By Component Map-Market Size (USD Billion) & Growth Rate (%), 2022
- Figure 164. By Vehicle Type Map-Market Size (USD Billion) & Growth Rate (%), 2022
- Figure 165. By Region Map-Market Size (USD Billion) & Growth Rate (%), 2022
Space Fuel Market was valued at USD 13.9 billion in 2022, expected to reach USD 41.6 billion in 2030 with a CAGR of 14.7% for the forecast period between 2023 and 2030. The commencement of new satellites and the rising craze for space tourism has created advancement in technologies and space-related companies to expand their business. The production of launch vehicles and innovative satellites has generated immense potential for space exploration. Imperatively, every operation in these sectors requires different types of space fuels. Space fuels deliver a prominent segment in taking these opportunities to the highest altitude. Human space exploration to yield scientific discoveries and significant breakthroughs has encouraged government and private companies to invest more in space development programs. Without the invention of space fuel, none of these programs could be feasible where the importance of various space fuels is recognized.
The development of green-based space fuels has ensured low greenhouse gas emissions associated with burning fuels in rocket engines. On a country basis, the United States contributes to major space programs accounting for military-heavy communication systems to International Space Station deliverables, including astronauts, satellites, and payloads. Space fuels or rocket propellants effectively deliver specific impulses ranging from around 175 to a maximum of 300-350 seconds. Launching a satellite or any space vehicle requires an enormous quantity of fuels that assist in escaping Earth's atmosphere by providing velocity to the rocket around 5 miles per second. Decisively, with the growing space industry, the global market of space fuel is also increasing exponentially.
Space Fuel in Satellite Applications
The growing demand to put more advanced satellites into orbit has tremendously increased such that all technological practices depend on such rolling satellites. The United States government has released data that states as of 2022, around 5,500 active satellites are revolving in orbit, and by 2030, another 58,000 are projected to be launched by different countries. The launching coordinates of the satellite from the earth's surface beyond the atmosphere vary from 80 miles to 22,000 miles. Falcon 9 rocket developed by SpaceX can utilize around 902,793 lbs of fuel, which is equivalent to 150 mass of elephants.
The current propellant or fuel for launching a satellite is hydrazine-based fuel, which is severely toxic and can be explosive and violent to nature. HyproGEO, a significant project commenced by giant Airbus, has successfully developed a non-toxic propulsion system for launching satellites in the geostationary orbit around 22,223 miles above the earth's surface. The HyperGEO has incorporated a hybrid propulsion system that produces very hot oxygen and water vapor by passing hydrogen peroxide over a catalyzer. For different purposes like phone communications, high-tech network connectivity, and military operations, the satellites are launched into specific orbits like low-orbits, middle-orbits, and geostationary orbits where the requirement of rocket-based space fuel varies. The proliferation of the space industry for launching rockets is creating massive space fuel opportunities, involving major space companies.
Sustainability Goals with Space Fuel
The development of various space programs to explore scientific discoveries in outer space and planets has significantly raised demands for space fuel. Space fuels can be categorized into solid and liquid types comprising small quantities of additives. Various liquid propellants, including hydrogen, oxygen, hydrazine, and monomethyl hydrazine, have been extensively used as rocket fuel carriers for satellites and humans. Burning solid rocket fuels in different space launches can lead to substantial carbon footprints. In every launch, a plume of exhaust is produced and, with effective launches, can accumulate a humongous harmful contaminant over time. This heap of contaminants has raised concerns for the atmospheric environment as these can potentially alter the atmospheric compositions.
Unsymmetrical dimethyl hydrazine and dinitrogen tetroxide propellants are potentially accountable for rocket emissions engine, which subsequently leaves small traces of soot and alumina. These harmful contaminants and materials gradually build up in the stratosphere, the primary cause of ozone layer depletion. The growing number of space missions with the enhancement in the space industry poses a significant threat for which alternative solutions are continuously being developed. Blue Origin has successfully created Shepard's BE-3PM engine, where it is fueled by highly efficient and clean liquid, oxygen only leaving water vapor with no carbon emissions. The advancement in space technologies predominantly creates global market opportunities for space fuel exploration.
Impact of COVID-19
The outbreak of COVID-19 has created unprecedented impacts by negatively influencing trade dynamics across the globe, including the space sector. Space missions by significant space companies were disrupted due to the pandemic crisis as the expenditure for the space departments was significantly reduced. Consequently, the market of space fuel also got severely affected as the demand for respective fuels drastically reduced. Gaganyaan, a space program for ISRO, India, with the objective of crewed orbital spacecraft missions, was rescheduled during COVID-19. Various satellite launch missions also got delayed, which prominently caused trouble for space exploration companies-with the gradual ease of conditions and impact of COVID-19, government space organizations started developing new strategies for space programs, which subsequently created massive potential for the space fuel market worldwide.
Impact of Russia-Ukraine War
The invasion of Russia on Ukraine has severely impacted various sectors around the globe, extending to the space industry too. The annexation in 2022 has developed ramifications among the space companies where the stringent sanctions by Europe and the United States on Russia have decreased their reliance on essential space equipment and technologies that earlier dealt with Russian space agencies. The space fuel market was also affected, and the unprecedented variation due to war led to less consumption of space fuel for different rocket boosters and launchers. The United States has started building its launch capabilities by replacing Russian engines and fuel exploration. The significant measures adopted by space agencies have again created the global market potential of space fuel, generating multiple opportunities to expand the space industry.
Key Players Landscape and Outlook
Space companies are exploring various opportunities to build effective space fuel technology. IHI Corporation, a Japanese aerospace company, has successfully developed an LNG propulsion system that uses liquid natural gas (LNG) as a fuel, which accounts for better space storability and higher density than hydrogen. The company is on the path of developing clean orbit control engines through low-toxicity and zero-toxic propellants. Analyzing the combustion states of various machines, they are researching building propulsion systems of high reliability. Similarly, other space companies invest in innovative research to develop adequate space fuel for space exploration.
Table of Contents
1. Research Methodology
2. Project Scope & Definitions
3. Impact of COVID-19 on the Space Fuel Market
4. Impact of Russia-Ukraine War
5. Executive Summary
6. Voice of Customer
- 6.1. Market Awareness and Product Information
- 6.2. Brand Awareness and Loyalty
- 6.3. Factors Considered in Purchase Decision
- 6.3.1. Brand Name
- 6.3.2. Quality
- 6.3.3. Quantity
- 6.3.4. Price
- 6.3.5. Product Specification
- 6.3.6. Application Specification
- 6.3.7. Shelf-life
- 6.3.8. Availability of Product
- 6.4. Frequency of Purchase
- 6.5. Medium of Purchase
7. Space Fuel Market Outlook, 2016-2030F
- 7.1. Market Size & Forecast
- 7.1.1. By Value
- 7.1.2. By Volume
- 7.2. By Propellant Type
- 7.2.1. Solid Chemical Propellants
- 7.2.2. Liquid Chemical Propellants
- 7.2.2.1. Petroleum
- 7.2.2.2. Cryogens
- 7.2.2.3. Hypergolic
- 7.2.3. Hybrid Propellants
- 7.2.3.1. Free-Radical Propellants
- 7.2.3.2. Liquid-Solid Propellants
- 7.2.3.3. Others
- 7.3. By Component
- 7.3.1. Combustion Chamber
- 7.3.2. Nozzle, Heat Exchanger
- 7.3.3. Flow Control Devices
- 7.3.4. Others
- 7.4. By Vehicle Type
- 7.4.1. Satellite Launch Vehicle
- 7.4.1.1. Low-Orbit Satellites
- 7.4.1.2. Middle-Orbit Satellites
- 7.4.1.3. Geostationary Orbit Satellites
- 7.4.2. Human Launch Vehicles
- 7.4.3. Reusable Launch Vehicle
- 7.4.4. Others
- 7.4.1. Satellite Launch Vehicle
- 7.5. By Region
- 7.5.1. North America
- 7.5.2. Europe
- 7.5.3. South America
- 7.5.4. Asia-Pacific
- 7.5.5. Middle East and Africa
- 7.6. By Company Market Share (%), 2022
8. Space Fuel Market Outlook, By Region, 2016-2030F
- 8.1. North America*
- 8.1.1. By Propellant Type
- 8.1.1.1. Solid Chemical Propellants
- 8.1.1.2. Liquid Chemical Propellants
- 8.1.1.2.1. Petroleum
- 8.1.1.2.2. Cryogens
- 8.1.1.2.3. Hypergolic
- 8.1.1.3. Hybrid Propellants
- 8.1.1.3.1. Free-Radical Propellants
- 8.1.1.3.2. Liquid-Solid Propellants
- 8.1.1.3.3. Others
- 8.1.2. By Component
- 8.1.2.1. Combustion Chamber
- 8.1.2.2. Nozzle, Heat Exchanger
- 8.1.2.3. Flow Control Devices
- 8.1.2.4. Others
- 8.1.3. By Vehicle Type
- 8.1.3.1. Satellite Launch Vehicle
- 8.1.3.1.1. Low-Orbit Satellites
- 8.1.3.1.2. Middle-Orbit Satellites
- 8.1.3.1.3. Geostationary Orbit Satellites
- 8.1.3.2. Human Launch Vehicles
- 8.1.3.3. Reusable Launch Vehicle
- 8.1.3.4. Others
- 8.1.4. United States*
- 8.1.4.1. By Propellant Type
- 8.1.4.1.1. Solid Chemical Propellants
- 8.1.4.1.2. Liquid Chemical Propellants
- 8.1.4.1.2.1. Petroleum
- 8.1.4.1.2.2. Cryogens
- 8.1.4.1.2.3. Hypergolic
- 8.1.4.1.3. Hybrid Propellants
- 8.1.4.1.3.1. Free-Radical Propellants
- 8.1.4.1.3.2. Liquid-Solid Propellants
- 8.1.4.1.3.3. Others
- 8.1.4.2. By Component
- 8.1.4.2.1. Combustion Chamber
- 8.1.4.2.2. Nozzle, Heat Exchanger
- 8.1.4.2.3. Flow Control Devices
- 8.1.4.2.4. Others
- 8.1.4.3. By Vehicle Type
- 8.1.4.3.1. Satellite Launch Vehicle
- 8.1.4.3.1.1. Low-Orbit Satellites
- 8.1.4.3.1.2. Middle-Orbit Satellites
- 8.1.4.3.1.3. Geostationary Orbit Satellites
- 8.1.4.3.2. Human Launch Vehicles
- 8.1.4.3.3. Reusable Launch Vehicle
- 8.1.4.3.4. Others
- 8.1.5. Canada
- 8.1.6. Mexico
- 8.1.1. By Propellant Type
All segments will be provided for all regions and countries covered:
- 8.2. Europe
- 8.2.1. Germany
- 8.2.2. France
- 8.2.3. Italy
- 8.2.4. United Kingdom
- 8.2.5. Russia
- 8.2.6. Netherlands
- 8.2.7. Spain
- 8.2.8. Turkey
- 8.2.9. Poland
- 8.3. South America
- 8.3.1. Brazil
- 8.3.2. Argentina
- 8.4. Asia-Pacific
- 8.4.1. India
- 8.4.2. China
- 8.4.3. Japan
- 8.4.4. Australia
- 8.4.5. Vietnam
- 8.4.6. South Korea
- 8.4.7. Indonesia
- 8.4.8. Philippines
- 8.5. Middle East & Africa
- 8.5.1. Saudi Arabia
- 8.5.2. UAE
- 8.5.3. South Africa
9. Supply Side Analysis
- 9.1. Capacity, By Company
- 9.2. Production, By Company
- 9.3. Operating Efficiency, By Company
- 9.4. Key Plant Locations (Up to 25)
10. Market Mapping, 2022
- 10.1. By Propellant Type
- 10.2. By Component
- 10.3. By Vehicle Type
- 10.4. By Region
11. Macro Environment and Industry Structure
- 11.1. Supply Demand Analysis
- 11.2. Import Export Analysis - Volume and Value
- 11.3. Supply/Value Chain Analysis
- 11.4. PESTEL Analysis
- 11.4.1. Political Factors
- 11.4.2. Economic System
- 11.4.3. Social Implications
- 11.4.4. Technological Advancements
- 11.4.5. Environmental Impacts
- 11.4.6. Legal Compliances and Regulatory Policies (Statutory Bodies Included)
- 11.5. Porter's Five Forces Analysis
- 11.5.1. Supplier Power
- 11.5.2. Buyer Power
- 11.5.3. Substitution Threat
- 11.5.4. Threat from New Entrant
- 11.5.5. Competitive Rivalry
12. Market Dynamics
- 12.1. Growth Drivers
- 12.2. Growth Inhibitors (Challenges, Restraints)
13. Key Players Landscape
- 13.1. Competition Matrix of Top Five Market Leaders
- 13.2. Market Revenue Analysis of Top Five Market Leaders (in %, 2022)
- 13.3. Mergers and Acquisitions/Joint Ventures (If Applicable)
- 13.4. SWOT Analysis (For Five Market Players)
- 13.5. Patent Analysis (If Applicable)
14. Pricing Analysis
15. Case Studies
16. Key Players Outlook
- 16.1. Safran S.A.
- 16.1.1. Company Details
- 16.1.2. Key Management Personnel
- 16.1.3. Products & Services
- 16.1.4. Financials (As reported)
- 16.1.5. Key Market Focus & Geographical Presence
- 16.1.6. Recent Developments
- 16.2. IHI Corporation
- 16.3. SpaceX
- 16.4. L3Harris Technologies Inc.
- 16.5. Northrop Grumman Corporation
- 16.6. Blue Origin
- 16.7. Oxeon Energy, LLC.
- 16.8. Skyroot Aerospace
- 16.9. Rocket Lab
- 16.10. European Space Agency
Companies mentioned above DO NOT hold any order as per market share and can be changed as per information available during research work.
