|
|
市場調査レポート
商品コード
1341022
水素ガス貯蔵市場:状態別、貯蔵タイプ別、技術別、エンドユーザー別、地域別、機会、予測、2016年~2030年Hydrogen Gas Storage Market Assessment, By State, By Storage Type, By Technology, By End-user, By Region, Opportunities and Forecast, 2016-2030F |
||||||
|
|
|||||||
カスタマイズ可能
|
|||||||


| 水素ガス貯蔵市場:状態別、貯蔵タイプ別、技術別、エンドユーザー別、地域別、機会、予測、2016年~2030年 |
|
出版日: 2023年09月01日
発行: Markets & Data
ページ情報: 英文 121 Pages
納期: 3~5営業日
|

- 全表示
- 概要
- 図表
- 目次
水素ガス貯蔵の市場規模は、2022年に25億1,114万米ドルと評価され、2023年から2030年の予測期間に8.3%のCAGRで拡大し、2030年には47億5,220万米ドルに達すると予測されています。水素元素は周期表の最初の元素であり、軽く、エネルギー密度が高く、貯蔵可能で、多領域にわたる様々な形態での応用に適しています。他の元素とは異なり、水素は他の燃料に比べて質量あたりのエネルギーが最も高くなります。クリーンな水素は、世界中のさまざまなプロジェクトに不可欠な燃料源と考えられており、調査によって技術の拡大が進められています。発電においては、水素貯蔵は再生可能エネルギーの貯蔵につながり、ガスタービンで使用することができます。
炭素ベースの燃料の使用と排出を削減するための継続的な世界的努力により、水素燃料電池の重要性は、小型の電子機器から巨大な運搬車両、航空、そして人間社会を含む電力開発プロジェクトに、より環境に優しい解決策を生み出す手助けをするものとして説明することができます。水素は、用途に応じて液体または気体として貯蔵することができます。水素を気体で貯蔵するには通常、高圧タンク(5000~10000psi)が必要であり、液体で貯蔵するには極低温が必要です。水素はまた、吸着や吸着と呼ばれる固体物質の中や表面に貯蔵することもできます。
水素の貯蔵が難しいのは、体積エネルギー密度が低いことや、ヘリウムよりも軽い元素であることなど、さまざまなパラメータが関係しています。液体水素は、宇宙旅行で広く使用されるため需要がありますが、特有の課題があり、最も一般的なのは貯蔵温度が低いことです。液体水素が気体に変化するのを防ぐため、-252.8℃以下にしなければなりません。その後、水素を圧縮する前に冷却する圧縮法が、極低温冷却とともに開発された水素貯蔵プロセスです。このプロセスで必要なエネルギーは、圧縮に利用可能なエネルギーの9~12%、液化に利用可能なエネルギーの約30%に相当します。
さらに、水素はさまざまなプロセスで材料を使用して貯蔵することもできます。固体材料と液体を使用する水素化物貯蔵は、水素貯蔵に広く使用されています。工業的規模では、塩の洞窟、石油・ガスの廃井戸、帯水層を使って地下水素貯蔵ができます。余剰水素は、複数のガスネットワークに挿入して水素富化天然ガス(HENG)を生成することができます。
水素は一般に、温室効果ガス排出がほぼゼロになる可能性のある燃料と考えられています。水素は多様な資源から生成することができ、別の燃料電池で電力を生産することができます。排出されるのは水蒸気と暖かい空気だけであり、水素は純粋で環境に優しい燃料です。石炭、天然ガス、太陽エネルギー、風力など、地元のさまざまな天然資源は、水素を製造するための有力な供給源となり、実質的に電気自動車の燃料電池として機能します。水素燃料は世界のエネルギー安全保障を強化し、石油埋蔵量を保全し、エネルギー輸送をより良いものに変えます。従来の燃料が自動車から排出するものとは異なり、有害な亜酸化窒素、炭化水素、そして重大な汚染物質とされる不要な粒子状物質が排出されます。しかし、水素を燃料とする自動車は、水と暖かい空気しか排出しないため、自然を愛する自動車となります。その結果、水素は、2050年までに世界全体でネット・ゼロ・エミッションを達成するという大きな課題を回避する可能性を秘めています。
当レポートでは、世界の水素ガス貯蔵市場について調査し、市場の概要とともに、状態別、貯蔵タイプ別、技術別、エンドユーザー別、地域別動向、および市場に参入する企業のプロファイルなどを提供しています。
目次
第1章 調査手法
第2章 プロジェクトの範囲と定義
第3章 COVID-19が水素ガス貯蔵市場に与える影響
第4章 ロシア・ウクライナ戦争の影響
第5章 エグゼクティブサマリー
第6章 お客様の声
第7章 水素ガス貯蔵市場の見通し、2016年~2030年
- 市場規模と予測
- 状態別
- 物理ベース
- 材料ベース
- 貯蔵タイプ別
- 加圧複合容器
- 繊維強化複合容器
- 低温圧縮容器
- その他
- 技術別
- 地質学ベース
- 圧縮
- 液化
- 材料ベース
- その他
- エンドユーザー別
- エネルギーと産業
- モビリティ
- 宇宙探査
- その他
- 地域別
- 北米
- 欧州
- 南米
- アジア太平洋
- 中東・アフリカ
- 企業別市場シェア(%)、2022年
第8章 水素ガス貯蔵市場の見通し、2016年~2030年、地域別
- 北米
- 欧州
- 南米
- アジア太平洋
- 中東・アフリカ
第9章 供給サイド分析
第10章 市場マッピング、2022年
第11章 マクロ環境と産業構造
- 需給分析
- 輸出入分析- 量と金額
- サプライ/バリューチェーン分析
- PESTEL分析
- ポーターのファイブフォース分析
第12章 市場力学
第13章 主要参入企業の情勢
第14章 価格分析
第15章 ケーススタディ
第16章 主要企業の見通し
- ITM Power
- Air Liquide
- Cummins Inc.
- Aramco
- FuelCell Energy Inc.
- Air Products and Chemicals Inc.
- Linde plc
- Shell plc
- NPROXX
- GRZ Technologies
第17章 戦略的推奨事項
第18章 お問合せと免責事項
List of Tables
- Table 1. Pricing Analysis of Products from Key Players
- Table 2. Competition Matrix of Top 5 Market Leaders
- Table 3. Mergers & Acquisitions/ Joint Ventures (If Applicable)
- Table 4. About Us - Regions and Countries Where We Have Executed Client Projects
List of Figures
- Figure 1. Global Hydrogen Gas Storage Market, By Value, In USD Million, 2016-2030F
- Figure 2. Global Hydrogen Gas Storage Market, By Volume, In Unit Thousand, 2016-2030F
- Figure 3. Global Hydrogen Gas Storage Market Share, By State, In USD Million, 2016-2030F
- Figure 4. Global Hydrogen Gas Storage Market Share, By Storage Type, In USD Million, 2016-2030F
- Figure 5. Global Hydrogen Gas Storage Market Share, By Technology, In USD Million, 2016-2030F
- Figure 6. Global Hydrogen Gas Storage Market Share, By End User, In USD Million, 2016-2030F
- Figure 7. Global Hydrogen Gas Storage Market Share, By Region, In USD Million, 2016-2030F
- Figure 8. North America Hydrogen Gas Storage Market, By Value, In USD Million, 2016-2030F
- Figure 9. North America Hydrogen Gas Storage Market, By Volume, In Unit Thousand, 2016-2030F
- Figure 10. North America Hydrogen Gas Storage Market Share, By State, In USD Million, 2016-2030F
- Figure 11. North America Hydrogen Gas Storage Market Share, By Storage Type, In USD Million, 2016-2030F
- Figure 12. North America Hydrogen Gas Storage Market Share, By Technology, In USD Million, 2016-2030F
- Figure 13. North America Hydrogen Gas Storage Market Share, By End User, In USD Million, 2016-2030F
- Figure 14. North America Hydrogen Gas Storage Market Share, By Country, In USD Million, 2016-2030F
- Figure 15. United States Hydrogen Gas Storage Market, By Value, In USD Million, 2016-2030F
- Figure 16. United States Hydrogen Gas Storage Market, By Volume, In Unit Thousand, 2016-2030F
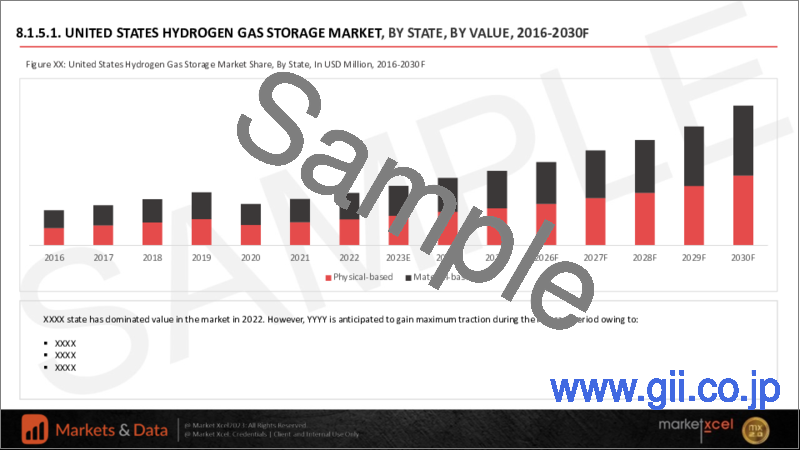
- Figure 17. United States Hydrogen Gas Storage Market Share, By State, In USD Million, 2016-2030F
- Figure 18. United States Hydrogen Gas Storage Market Share, By Storage Type, In USD Million, 2016-2030F
- Figure 19. United States Hydrogen Gas Storage Market Share, By Technology, In USD Million, 2016-2030F
- Figure 20. United States Hydrogen Gas Storage Market Share, By End User, In USD Million, 2016-2030F
- Figure 21. Canada Hydrogen Gas Storage Market, By Value, In USD Million, 2016-2030F
- Figure 22. Canada Hydrogen Gas Storage Market, By Volume, In Unit Thousand, 2016-2030F
- Figure 23. Canada Hydrogen Gas Storage Market Share, By State, In USD Million, 2016-2030F
- Figure 24. Canada Hydrogen Gas Storage Market Share, By Storage Type, In USD Million, 2016-2030F
- Figure 25. Canada Hydrogen Gas Storage Market Share, By Technology, In USD Million, 2016-2030F
- Figure 26. Canada Hydrogen Gas Storage Market Share, By End User, In USD Million, 2016-2030F
- Figure 27. Mexico Hydrogen Gas Storage Market, By Value, In USD Million, 2016-2030F
- Figure 28. Mexico Hydrogen Gas Storage Market, By Volume, In Unit Thousand, 2016-2030F
- Figure 29. Mexico Hydrogen Gas Storage Market Share, By State, In USD Million, 2016-2030F
- Figure 30. Mexico Hydrogen Gas Storage Market Share, By Storage Type, In USD Million, 2016-2030F
- Figure 31. Mexico Hydrogen Gas Storage Market Share, By Technology, In USD Million, 2016-2030F
- Figure 32. Mexico Hydrogen Gas Storage Market Share, By End User, In USD Million, 2016-2030F
- Figure 33. Europe Hydrogen Gas Storage Market, By Value, In USD Million, 2016-2030F
- Figure 34. Europe Hydrogen Gas Storage Market, By Volume, In Unit Thousand, 2016-2030F
- Figure 35. Europe Hydrogen Gas Storage Market Share, By State, In USD Million, 2016-2030F
- Figure 36. Europe Hydrogen Gas Storage Market Share, By Storage Type, In USD Million, 2016-2030F
- Figure 37. Europe Hydrogen Gas Storage Market Share, By Technology, In USD Million, 2016-2030F
- Figure 38. Europe Hydrogen Gas Storage Market Share, By End User, In USD Million, 2016-2030F
- Figure 39. Europe Hydrogen Gas Storage Market Share, By Country, In USD Million, 2016-2030F
- Figure 40. Germany Hydrogen Gas Storage Market, By Value, In USD Million, 2016-2030F
- Figure 41. Germany Hydrogen Gas Storage Market, By Volume, In Unit Thousand, 2016-2030F
- Figure 42. Germany Hydrogen Gas Storage Market Share, By State, In USD Million, 2016-2030F
- Figure 43. Germany Hydrogen Gas Storage Market Share, By Storage Type, In USD Million, 2016-2030F
- Figure 44. Germany Hydrogen Gas Storage Market Share, By Technology, In USD Million, 2016-2030F
- Figure 45. Germany Hydrogen Gas Storage Market Share, By End User, In USD Million, 2016-2030F
- Figure 46. France Hydrogen Gas Storage Market, By Value, In USD Million, 2016-2030F
- Figure 47. France Hydrogen Gas Storage Market, By Volume, In Unit Thousand, 2016-2030F
- Figure 48. France Hydrogen Gas Storage Market Share, By State, In USD Million, 2016-2030F
- Figure 49. France Hydrogen Gas Storage Market Share, By Storage Type, In USD Million, 2016-2030F
- Figure 50. France Hydrogen Gas Storage Market Share, By Technology, In USD Million, 2016-2030F
- Figure 51. France Hydrogen Gas Storage Market Share, By End User, In USD Million, 2016-2030F
- Figure 52. Italy Hydrogen Gas Storage Market, By Value, In USD Million, 2016-2030F
- Figure 53. Italy Hydrogen Gas Storage Market, By Volume, In Unit Thousand, 2016-2030F
- Figure 54. Italy Hydrogen Gas Storage Market Share, By State, In USD Million, 2016-2030F
- Figure 55. Italy Hydrogen Gas Storage Market Share, By Storage Type, In USD Million, 2016-2030F
- Figure 56. Italy Hydrogen Gas Storage Market Share, By Technology, In USD Million, 2016-2030F
- Figure 57. Italy Hydrogen Gas Storage Market Share, By End User, In USD Million, 2016-2030F
- Figure 58. United Kingdom Hydrogen Gas Storage Market, By Value, In USD Million, 2016-2030F
- Figure 59. United Kingdom Hydrogen Gas Storage Market, By Volume, In Unit Thousand, 2016-2030F
- Figure 60. United Kingdom Hydrogen Gas Storage Market Share, By State, In USD Million, 2016-2030F
- Figure 61. United Kingdom Hydrogen Gas Storage Market Share, By Storage Type, In USD Million, 2016-2030F
- Figure 62. United Kingdom Hydrogen Gas Storage Market Share, By Technology, In USD Million, 2016-2030F
- Figure 63. United Kingdom Hydrogen Gas Storage Market Share, By End User, In USD Million, 2016-2030F
- Figure 64. Russia Hydrogen Gas Storage Market, By Value, In USD Million, 2016-2030F
- Figure 65. Russia Hydrogen Gas Storage Market, By Volume, In Unit Thousand, 2016-2030F
- Figure 66. Russia Hydrogen Gas Storage Market Share, By State, In USD Million, 2016-2030F
- Figure 67. Russia Hydrogen Gas Storage Market Share, By Storage Type, In USD Million, 2016-2030F
- Figure 68. Russia Hydrogen Gas Storage Market Share, By Technology, In USD Million, 2016-2030F
- Figure 69. Russia Hydrogen Gas Storage Market Share, By End User, In USD Million, 2016-2030F
- Figure 70. Netherlands Hydrogen Gas Storage Market, By Value, In USD Million, 2016-2030F
- Figure 71. Netherlands Hydrogen Gas Storage Market, By Volume, In Unit Thousand, 2016-2030F
- Figure 72. Netherlands Hydrogen Gas Storage Market Share, By State, In USD Million, 2016-2030F
- Figure 73. Netherlands Hydrogen Gas Storage Market Share, By Storage Type, In USD Million, 2016-2030F
- Figure 74. Netherlands Hydrogen Gas Storage Market Share, By Technology, In USD Million, 2016-2030F
- Figure 75. Netherlands Hydrogen Gas Storage Market Share, By End User, In USD Million, 2016-2030F
- Figure 76. Spain Hydrogen Gas Storage Market, By Value, In USD Million, 2016-2030F
- Figure 77. Spain Hydrogen Gas Storage Market, By Volume, In Unit Thousand, 2016-2030F
- Figure 78. Spain Hydrogen Gas Storage Market Share, By State, In USD Million, 2016-2030F
- Figure 79. Spain Hydrogen Gas Storage Market Share, By Storage Type, In USD Million, 2016-2030F
- Figure 80. Spain Hydrogen Gas Storage Market Share, By Technology, In USD Million, 2016-2030F
- Figure 81. Spain Hydrogen Gas Storage Market Share, By End User, In USD Million, 2016-2030F
- Figure 82. Turkey Hydrogen Gas Storage Market, By Value, In USD Million, 2016-2030F
- Figure 83. Turkey Hydrogen Gas Storage Market, By Volume, In Unit Thousand, 2016-2030F
- Figure 84. Turkey Hydrogen Gas Storage Market Share, By State, In USD Million, 2016-2030F
- Figure 85. Turkey Hydrogen Gas Storage Market Share, By Storage Type, In USD Million, 2016-2030F
- Figure 86. Turkey Hydrogen Gas Storage Market Share, By Technology, In USD Million, 2016-2030F
- Figure 87. Turkey Hydrogen Gas Storage Market Share, By End User, In USD Million, 2016-2030F
- Figure 88. Poland Hydrogen Gas Storage Market, By Value, In USD Million, 2016-2030F
- Figure 89. Poland Hydrogen Gas Storage Market, By Volume, In Unit Thousand, 2016-2030F
- Figure 90. Poland Hydrogen Gas Storage Market Share, By State, In USD Million, 2016-2030F
- Figure 91. Poland Hydrogen Gas Storage Market Share, By Storage Type, In USD Million, 2016-2030F
- Figure 92. Poland Hydrogen Gas Storage Market Share, By Technology, In USD Million, 2016-2030F
- Figure 93. Poland Hydrogen Gas Storage Market Share, By End User, In USD Million, 2016-2030F
- Figure 94. South America Hydrogen Gas Storage Market, By Value, In USD Million, 2016-2030F
- Figure 95. South America Hydrogen Gas Storage Market, By Volume, In Unit Thousand, 2016-2030F
- Figure 96. South America Hydrogen Gas Storage Market Share, By State, In USD Million, 2016-2030F
- Figure 97. South America Hydrogen Gas Storage Market Share, By Storage Type, In USD Million, 2016-2030F
- Figure 98. South America Hydrogen Gas Storage Market Share, By Technology, In USD Million, 2016-2030F
- Figure 99. South America Hydrogen Gas Storage Market Share, By End User, In USD Million, 2016-2030F
- Figure 100. South America Hydrogen Gas Storage Market Share, By Country, In USD Million, 2016-2030F
- Figure 101. Brazil Hydrogen Gas Storage Market, By Value, In USD Million, 2016-2030F
- Figure 102. Brazil Hydrogen Gas Storage Market, By Volume, In Unit Thousand, 2016-2030F
- Figure 103. Brazil Hydrogen Gas Storage Market Share, By State, In USD Million, 2016-2030F
- Figure 104. Brazil Hydrogen Gas Storage Market Share, By Storage Type, In USD Million, 2016-2030F
- Figure 105. Brazil Hydrogen Gas Storage Market Share, By Technology, In USD Million, 2016-2030F
- Figure 106. Brazil Hydrogen Gas Storage Market Share, By End User, In USD Million, 2016-2030F
- Figure 107. Argentina Hydrogen Gas Storage Market, By Value, In USD Million, 2016-2030F
- Figure 108. Argentina Hydrogen Gas Storage Market, By Volume, In Unit Thousand, 2016-2030F
- Figure 109. Argentina Hydrogen Gas Storage Market Share, By State, In USD Million, 2016-2030F
- Figure 110. Argentina Hydrogen Gas Storage Market Share, By Storage Type, In USD Million, 2016-2030F
- Figure 111. Argentina Hydrogen Gas Storage Market Share, By Technology, In USD Million, 2016-2030F
- Figure 112. Argentina Hydrogen Gas Storage Market Share, By End User, In USD Million, 2016-2030F
- Figure 113. Asia-Pacific Hydrogen Gas Storage Market, By Value, In USD Million, 2016-2030F
- Figure 114. Asia-Pacific Hydrogen Gas Storage Market, By Volume, In Unit Thousand, 2016-2030F
- Figure 115. Asia-Pacific Hydrogen Gas Storage Market Share, By State, In USD Million, 2016-2030F
- Figure 116. Asia-Pacific Hydrogen Gas Storage Market Share, By Storage Type, In USD Million, 2016-2030F
- Figure 117. Asia-Pacific Hydrogen Gas Storage Market Share, By Technology, In USD Million, 2016-2030F
- Figure 118. Asia- Pacific Cream Market Share, By End User, In USD Million, 2016-2030F
- Figure 119. Asia-Pacific Hydrogen Gas Storage Market Share, By Country, In USD Million, 2016-2030F
- Figure 120. India Hydrogen Gas Storage Market, By Value, In USD Million, 2016-2030F
- Figure 121. India Hydrogen Gas Storage Market, By Volume, In Unit Thousand, 2016-2030F
- Figure 122. India Hydrogen Gas Storage Market Share, By State, In USD Million, 2016-2030F
- Figure 123. India Hydrogen Gas Storage Market Share, By Storage Type, In USD Million, 2016-2030F
- Figure 124. India Hydrogen Gas Storage Market Share, By Technology, In USD Million, 2016-2030F
- Figure 125. India Hydrogen Gas Storage Market Share, By End User, In USD Million, 2016-2030F
- Figure 126. China Hydrogen Gas Storage Market, By Value, In USD Million, 2016-2030F
- Figure 127. China Hydrogen Gas Storage Market, By Volume, In Unit Thousand, 2016-2030F
- Figure 128. China Hydrogen Gas Storage Market Share, By State, In USD Million, 2016-2030F
- Figure 129. China Hydrogen Gas Storage Market Share, By Storage Type, In USD Million, 2016-2030F
- Figure 130. China Hydrogen Gas Storage Market Share, By Technology, In USD Million, 2016-2030F
- Figure 131. China Hydrogen Gas Storage Market Share, By End User, In USD Million, 2016-2030F
- Figure 132. Japan Hydrogen Gas Storage Market, By Value, In USD Million, 2016-2030F
- Figure 133. Japan Hydrogen Gas Storage Market, By Volume, In Unit Thousand, 2016-2030F
- Figure 134. Japan Hydrogen Gas Storage Market Share, By State, In USD Million, 2016-2030F
- Figure 135. Japan Hydrogen Gas Storage Market Share, By Storage Type, In USD Million, 2016-2030F
- Figure 136. Japan Hydrogen Gas Storage Market Share, By Technology, In USD Million, 2016-2030F
- Figure 137. Japan Hydrogen Gas Storage Market Share, By End User, In USD Million, 2016-2030F
- Figure 138. Australia Hydrogen Gas Storage Market, By Value, In USD Million, 2016-2030F
- Figure 139. Australia Hydrogen Gas Storage Market, By Volume, In Unit Thousand, 2016-2030F
- Figure 140. Australia Hydrogen Gas Storage Market Share, By State, In USD Million, 2016-2030F
- Figure 141. Australia Hydrogen Gas Storage Market Share, By Storage Type, In USD Million, 2016-2030F
- Figure 142. Australia Hydrogen Gas Storage Market Share, By Technology, In USD Million, 2016-2030F
- Figure 143. Australia Hydrogen Gas Storage Market Share, By End User, In USD Million, 2016-2030F
- Figure 144. Vietnam Hydrogen Gas Storage Market, By Value, In USD Million, 2016-2030F
- Figure 145. Vietnam Hydrogen Gas Storage Market, By Volume, In Unit Thousand, 2016-2030F
- Figure 146. Vietnam Hydrogen Gas Storage Market Share, By State, In USD Million, 2016-2030F
- Figure 147. Vietnam Hydrogen Gas Storage Market Share, By Storage Type, In USD Million, 2016-2030F
- Figure 148. Vietnam Hydrogen Gas Storage Market Share, By Technology, In USD Million, 2016-2030F
- Figure 149. Vietnam Hydrogen Gas Storage Market Share, By End User, In USD Million, 2016-2030F
- Figure 150. South Korea Hydrogen Gas Storage Market, By Value, In USD Million, 2016-2030F
- Figure 151. South Korea Hydrogen Gas Storage Market, By Volume, In Unit Thousand, 2016-2030F
- Figure 152. South Korea Hydrogen Gas Storage Market Share, By State, In USD Million, 2016-2030F
- Figure 153. South Korea Hydrogen Gas Storage Market Share, By Storage Type, In USD Million, 2016-2030F
- Figure 154. South Korea Hydrogen Gas Storage Market Share, By Technology, In USD Million, 2016-2030F
- Figure 155. South Korea Hydrogen Gas Storage Market Share, By End User, In USD Million, 2016-2030F
- Figure 156. Indonesia Hydrogen Gas Storage Market, By Value, In USD Million, 2016-2030F
- Figure 157. Indonesia Hydrogen Gas Storage Market, By Volume, In Unit Thousand, 2016-2030F
- Figure 158. Indonesia Hydrogen Gas Storage Market Share, By State, In USD Million, 2016-2030F
- Figure 159. Indonesia Hydrogen Gas Storage Market Share, By Storage Type, In USD Million, 2016-2030F
- Figure 160. Indonesia Hydrogen Gas Storage Market Share, By Technology, In USD Million, 2016-2030F
- Figure 161. Indonesia Hydrogen Gas Storage Market Share, By End User, In USD Million, 2016-2030F
- Figure 162. Philippines Hydrogen Gas Storage Market, By Value, In USD Million, 2016-2030F
- Figure 163. Philippines Hydrogen Gas Storage Market, By Volume, In Unit Thousand, 2016-2030F
- Figure 164. Philippines Hydrogen Gas Storage Market Share, By State, In USD Million, 2016-2030F
- Figure 165. Philippines Hydrogen Gas Storage Market Share, By Storage Type, In USD Million, 2016-2030F
- Figure 166. Philippines Hydrogen Gas Storage Market Share, By Technology, In USD Million, 2016-2030F
- Figure 167. Philippines Hydrogen Gas Storage Market Share, By End User, In USD Million, 2016-2030F
- Figure 168. Middle East & Africa Hydrogen Gas Storage Market, By Value, In USD Million, 2016-2030F
- Figure 169. Middle East & Africa Hydrogen Gas Storage Market, By Volume, In Unit Thousand, 2016-2030F
- Figure 170. Middle East & Africa Hydrogen Gas Storage Market Share, By State, In USD Million, 2016-2030F
- Figure 171. Middle East & Africa Hydrogen Gas Storage Market Share, By Storage Type, In USD Million, 2016-2030F
- Figure 172. Middle East & Africa Hydrogen Gas Storage Market Share, By Technology, In USD Million, 2016-2030F
- Figure 173. Middle East & Africa Hydrogen Gas Storage Market Share, By End User, In USD Million, 2016-2030F
- Figure 174. Middle East & Africa Hydrogen Gas Storage Market Share, By Country, In USD Million, 2016-2030F
- Figure 175. Saudi Arabia Hydrogen Gas Storage Market, By Value, In USD Million, 2016-2030F
- Figure 176. Saudi Arabia Hydrogen Gas Storage Market, By Volume, In Unit Thousand, 2016-2030F
- Figure 177. Saudi Arabia Hydrogen Gas Storage Market Share, By State, In USD Million, 2016-2030F
- Figure 178. Saudi Arabia Hydrogen Gas Storage Market Share, By Storage Type, In USD Million, 2016-2030F
- Figure 179. Saudi Arabia Hydrogen Gas Storage Market Share, By Technology, In USD Million, 2016-2030F
- Figure 180. Saudi Arabia Hydrogen Gas Storage Market Share, By End User, In USD Million, 2016-2030F
- Figure 181. UAE Hydrogen Gas Storage Market, By Value, In USD Million, 2016-2030F
- Figure 182. UAE Hydrogen Gas Storage Market, By Volume, In Unit Thousand, 2016-2030F
- Figure 183. UAE Hydrogen Gas Storage Market Share, By State, In USD Million, 2016-2030F
- Figure 184. UAE Hydrogen Gas Storage Market Share, By Storage Type, In USD Million, 2016-2030F
- Figure 185. UAE Hydrogen Gas Storage Market Share, By Technology, In USD Million, 2016-2030F
- Figure 186. UAE Hydrogen Gas Storage Market Share, By End User, In USD Million, 2016-2030F
- Figure 187. South Africa Hydrogen Gas Storage Market, By Value, In USD Million, 2016-2030F
- Figure 188. South Africa Hydrogen Gas Storage Market, By Volume, In Unit Thousand, 2016-2030F
- Figure 189. South Africa Hydrogen Gas Storage Market Share, By State, In USD Million, 2016-2030F
- Figure 190. South Africa Hydrogen Gas Storage Market Share, By Storage Type, In USD Million, 2016-2030F
- Figure 191. South Africa Hydrogen Gas Storage Market Share, By Technology, In USD Million, 2016-2030F
- Figure 192. South Africa Hydrogen Gas Storage Market Share, By End User, In USD Million, 2016-2030F
- Figure 193. By State Map-Market Size (USD Million) & Growth Rate (%), 2022
- Figure 194. By Storage Type Map-Market Size (USD Million) & Growth Rate (%), 2022
- Figure 195. By Technology Map-Market Size (USD Million) & Growth Rate (%), 2022
- Figure 196. By End User Map-Market Size (USD Million) & Growth Rate (%), 2022
- Figure 197. By Region Map-Market Size (USD Million) & Growth Rate (%), 2022
The Hydrogen Gas Storage Market size was valued at USD 2511.14 million in 2022, expected to reach USD 4752.2 million in 2030 with a CAGR of 8.3% for the forecast period between 2023 and 2030. The hydrogen element is the first one in the periodic table, which is light, energy-dense, storable, and commensurate with its application in various forms across multi-domains. Unlikely other elements, hydrogen has the highest energy per mass compared to other fuels. Clean hydrogen is considered an essential source of fuel for various projects across the globe, and research is driving us to scale up technologies. In power generation, hydrogen storage leads to storing renewable energy, which can be used in gas turbines.
With the continuous global efforts to reduce emissions and the use of carbon-based fuels, the importance of hydrogen fuel cells can be accounted for as it assists in creating a greener solution to the power development projects, including small electronic devices to huge-carrying vehicles, aviation, and the human community. Hydrogen can be stored as liquid or gas according to the required applications. High-pressure tanks (5000-10000 psi) are usually needed for storing hydrogen in gaseous form, while cryogenic temperatures drive hydrogen storage in liquid form. Hydrogen can also be stored within solid materials or on the surface, called absorption and adsorption.
Demand for Hydrogen Storage Facilities
The various parameters, such as low volumetric energy density and lightest element than Helium, account for the difficulty in storing hydrogen. Liquid hydrogen, which is in demand for being used extensively in space travel, has specific challenges; the most common is low storage temperature. Cryogenically, hydrogen can be stored in liquid form where the temperature must be lower than -252.8°C to prevent liquid hydrogen from converting into gaseous form. Subsequently, compression, along with cryogenic cooling, is an advanced developed process for storing hydrogen where the hydrogen is cooled before compressing it. The energy required using this process is equivalent to 9-12% of the energy available for compression and around 30% liquefaction.
To a further extent, hydrogen can also be stored using materials with different processes. Hydride storage, which uses solid materials and liquid, has been extensively used for storing hydrogen. On an industrial scale, underground hydrogen storage can be obtained using salt caverns, abandoned oil and gas wells, or aquifers. Surplus hydrogen can be inserted into the multiple gas network to generate hydrogen-enriched natural gas (HENG), which could be an alternative to underground cavern storage.
Hydrogen Benefits and Energy Security
Hydrogen is generally considered a potential fuel that is on the mark of near-zero greenhouse gas emissions. It can be generated from diverse resources that impulse to produce electric power in a different fuel cell. The emitted elements are only water vapor and warm air, making hydrogen a pure, environmentally friendly fuel. Locally various natural resources such as coal, natural gas, solar energy, wind, etc., can be a prominent source to produce hydrogen, substantially serving as a fuel cell for electric vehicles. Hydrogen fuel strengthens global energy security, preserves petroleum reserves, and transforms energy transportation into a better one. Unlikely emissions from conventional fuels from vehicles are harmful nitrous oxides, hydrocarbons, and unwanted particulates, which is considered a significant pollutant. Still, hydrogen-powered fuel vehicles indispensably produce only water and warm air, ultimately making them nature-loving. Consequently, hydrogen carries the potential to circumvent significant challenges to meet net zero emissions globally by 2050.
With the increasing demand for the mobility of compressed hydrogen systems, the capacities and pressure of tube trailers has significantly increased to 1000 kg of hydrogen at 500 bar, the largest. Cryostars' transferable system is very effective as their systems are equipped with a wide range of compressed hydrogen container filling pumps with larger capacities and lower power consumptions than usual compressors.
Impact of COVID-19
The COVID-19 pandemic has led to unprecedented economic crises, affecting the clean hydrogen sector. During the outbreak, a significant lagging has occurred in the adoption and commercial roll-out of pure hydrogen. The momentum of building hydrogen storage infrastructure has slowed as annual installations of energy storage subsequently declined-the structures of the power grid scale fell by around 20%, which created uncertainties around battery safety. The COVID-19 outbreak has impacted several clean hydrogen projects using CCUS technology due to supply chain disruptions, a global economic downturn, and a fall in effective capital investment across energy sectors. Despite various troubles and uncertainties with the growth, there are more rising opportunities to mobilize investments toward clean hydrogen energy storage.
Impact of Russia-Ukraine War
The annexation of Russia on Ukraine has developed sternness in energy security globally, which resembles the center of the geopolitical conversation. The International Renewable Energy Agency (IRENA) has proposed a strategy for the emergence of clean hydrogen as a mainstream source which aims to reevaluate global trade relations, minimize the dependence, and shift the power far away from oil and gas-dominating countries, including Russia and gulf regions. The invasion has soared energy prices globally, which drives 25 countries to commit an investment of around USD 73 billion in fresh lower-cost green hydrogen. A progressive acceleration in the buy to produce clean hydrogen assets has inspired investors across the globe as they are looking at hydrogen as an alternative fuel source.
In October 2022, the cost of pure green hydrogen ranges between USD3.8 to 5.8 per kg, and the impact of war has led to lower prices in a very short time interval. Massive energy importers like Morocco, Chile, and Namibia have already developed strategies to become green hydrogen producers and exporters.
Key Players Landscape and Outlook
Prominent companies are heavily investing in sustainability goals to develop technologies for producing green energy. FuelCell Energy Inc., a key player in the green hydrogen industry, offers an environmentally friendly alternative to conventional energy generation. The company's specifications can be admired in different applications such as designing, manufacturing, and operating fuel cell power plants. The company has already implemented operations in over 50 countries, from which only 21 power plants are established in South Korea. It uses trigeneration technology to generate green hydrogen from natural gas or biogas, extending its domain to serve commercial and industrial clients across the globe.
Table of Contents
1. Research Methodology
2. Project Scope & Definitions
3. Impact of COVID-19 on the Hydrogen Gas Storage Market
4. Impact of Russia-Ukraine War
5. Executive Summary
6. Voice of Customer
- 6.1. Market Awareness and Product Information
- 6.2. Brand Awareness and Loyalty
- 6.3. Factors Considered in Purchase Decision
- 6.3.1. Brand Name
- 6.3.2. Quality
- 6.3.3. Quantity
- 6.3.4. Price
- 6.3.5. Product Specification
- 6.3.6. Application Specification
- 6.3.7. VOC/Toxicity Content
- 6.3.8. Availability of Product
- 6.4. Frequency of Purchase
- 6.5. Medium of Purchase
7. Hydrogen Gas Storage Market Outlook, 2016-2030F
- 7.1. Market Size & Forecast
- 7.1.1. By Value
- 7.1.2. By Volume
- 7.2. By State
- 7.2.1. Physical-based
- 7.2.1.1. Gas
- 7.2.1.2. Liquid
- 7.2.1.3. Others
- 7.2.2. Material-based
- 7.2.2.1. Chemical Hydrogen
- 7.2.2.2. Adsorbent
- 7.2.2.3. Interstitial Hydride
- 7.2.2.4. Others
- 7.2.1. Physical-based
- 7.3. By Storage Type
- 7.3.1. Pressurized Composite Vessels
- 7.3.2. Fiber Reinforced Composite Vessels
- 7.3.3. Cryo-Compressed Vessels
- 7.3.4. Others
- 7.4. By Technology
- 7.4.1. Geological Based
- 7.4.2. Compression
- 7.4.3. Liquefaction
- 7.4.4. Material Based
- 7.4.5. Others
- 7.5. By End-user
- 7.5.1. Energy & Industry
- 7.5.1.1. Nuclear Plant
- 7.5.1.2. Power Grids
- 7.5.1.3. Others
- 7.5.2. Mobility
- 7.5.2.1. Shipment
- 7.5.2.2. Heavy Transport
- 7.5.2.3. Others
- 7.5.3. Space Exploration
- 7.5.4. Others
- 7.5.1. Energy & Industry
- 7.6. By Region
- 7.6.1. North America
- 7.6.2. Europe
- 7.6.3. South America
- 7.6.4. Asia-Pacific
- 7.6.5. Middle East and Africa
- 7.7. By Company Market Share (%), 2022
8. Hydrogen Gas Storage Market Outlook, By Region, 2016-2030F
- 8.1. North America*
- 8.1.1. By State
- 8.1.1.1. Physical-based
- 8.1.1.1.1. Gas
- 8.1.1.1.2. Liquid
- 8.1.1.1.3. Others
- 8.1.1.2. Material-based
- 8.1.1.2.1. Chemical Hydrogen
- 8.1.1.2.2. Adsorbent
- 8.1.1.2.3. Interstitial Hydride
- 8.1.1.2.4. Others
- 8.1.2. By Storage Type
- 8.1.2.1. Pressurized Composite Vessels
- 8.1.2.2. Fiber Reinforced Composite Vessels
- 8.1.2.3. Cryo-Compressed Vessels
- 8.1.2.4. Others
- 8.1.3. By Technology
- 8.1.3.1. Geological Based
- 8.1.3.2. Compression
- 8.1.3.3. Liquefaction
- 8.1.3.4. Material Based
- 8.1.3.5. Others
- 8.1.4. By End-user
- 8.1.4.1. Energy
- 8.1.4.1.1. Nuclear Plant
- 8.1.4.1.2. Power Grids
- 8.1.4.1.3. Others
- 8.1.4.2. Mobility
- 8.1.4.2.1. Shipment
- 8.1.4.2.2. Heavy Transport
- 8.1.4.2.3. Others
- 8.1.4.3. Space Exploration
- 8.1.4.4. Others
- 8.1.5. United States*
- 8.1.5.1. By State
- 8.1.5.1.1. Physical-based
- 8.1.5.1.1.1. Gas
- 8.1.5.1.1.2. Liquid
- 8.1.5.1.1.3. Others
- 8.1.5.1.2. Material-based
- 8.1.5.1.2.1. Chemical Hydrogen
- 8.1.5.1.2.2. Adsorbent
- 8.1.5.1.2.3. Interstitial Hydride
- 8.1.5.1.2.4. Others
- 8.1.5.2. By Storage Type
- 8.1.5.2.1. Pressurized Composite Vessels
- 8.1.5.2.2. Fiber Reinforced Composite Vessels
- 8.1.5.2.3. Cryo-Compressed Vessels
- 8.1.5.2.4. Others
- 8.1.5.3. By Technology
- 8.1.5.3.1. Geological Based
- 8.1.5.3.2. Compression
- 8.1.5.3.3. Liquefaction
- 8.1.5.3.4. Material Based
- 8.1.5.3.5. Others
- 8.1.5.4. By End-user
- 8.1.5.4.1. Energy
- 8.1.5.4.1.1. Nuclear Plant
- 8.1.5.4.1.2. Power Grids
- 8.1.5.4.1.3. Others
- 8.1.5.4.2. Mobility
- 8.1.5.4.2.1. Shipment
- 8.1.5.4.2.2. Heavy Transport
- 8.1.5.4.2.3. Others
- 8.1.5.4.3. Space Exploration
- 8.1.5.4.4. Others
- 8.1.6. Canada
- 8.1.7. Mexico
- 8.1.1. By State
All segments will be provided for all regions and countries covered
- 8.2. Europe
- 8.2.1. Germany
- 8.2.2. France
- 8.2.3. Italy
- 8.2.4. United Kingdom
- 8.2.5. Russia
- 8.2.6. Netherlands
- 8.2.7. Spain
- 8.2.8. Turkey
- 8.2.9. Poland
- 8.3. South America
- 8.3.1. Brazil
- 8.3.2. Argentina
- 8.4. Asia-Pacific
- 8.4.1. India
- 8.4.2. China
- 8.4.3. Japan
- 8.4.4. Australia
- 8.4.5. Vietnam
- 8.4.6. South Korea
- 8.4.7. Indonesia
- 8.4.8. Philippines
- 8.5. Middle East & Africa
- 8.5.1. Saudi Arabia
- 8.5.2. UAE
- 8.5.3. South Africa
9. Supply Side Analysis
- 9.1. Capacity, By Company
- 9.2. Production, By Company
- 9.3. Operating Efficiency, By Company
- 9.4. Key Plant Locations (Up to 25)
10. Market Mapping, 2022
- 10.1. By State
- 10.2. By Storage Type
- 10.3. By Technology
- 10.4. By End-user
- 10.5. By Region
11. Macro Environment and Industry Structure
- 11.1. Supply Demand Analysis
- 11.2. Import Export Analysis - Volume and Value
- 11.3. Supply/Value Chain Analysis
- 11.4. PESTEL Analysis
- 11.4.1. Political Factors
- 11.4.2. Economic System
- 11.4.3. Social Implications
- 11.4.4. Technological Advancements
- 11.4.5. Environmental Impacts
- 11.4.6. Legal Compliances and Regulatory Policies (Statutory Bodies Included)
- 11.5. Porter's Five Forces Analysis
- 11.5.1. Supplier Power
- 11.5.2. Buyer Power
- 11.5.3. Substitution Threat
- 11.5.4. Threat from New Entrant
- 11.5.5. Competitive Rivalry
12. Market Dynamics
- 12.1. Growth Drivers
- 12.2. Growth Inhibitors (Challenges, Restraints)
13. Key Players Landscape
- 13.1. Competition Matrix of Top Five Market Leaders
- 13.2. Market Revenue Analysis of Top Five Market Leaders (in %, 2022)
- 13.3. Mergers and Acquisitions/Joint Ventures (If Applicable)
- 13.4. SWOT Analysis (For Five Market Players)
- 13.5. Patent Analysis (If Applicable)
14. Pricing Analysis
15. Case Studies
16. Key Players Outlook
- 16.1. ITM Power
- 16.1.1. Company Details
- 16.1.2. Key Management Personnel
- 16.1.3. Products & Services
- 16.1.4. Financials (As reported)
- 16.1.5. Key Market Focus & Geographical Presence
- 16.1.6. Recent Developments
- 16.2. Air Liquide
- 16.3. Cummins Inc.
- 16.4. Aramco
- 16.5. FuelCell Energy Inc.
- 16.6. Air Products and Chemicals Inc.
- 16.7. Linde plc
- 16.8. Shell plc
- 16.9. NPROXX
- 16.10. GRZ Technologies
Companies mentioned above DO NOT hold any order as per market share and can be changed as per information available during research work
