|
|
市場調査レポート
商品コード
1341017
生物農薬有効成分の世界市場:成分タイプ別、由来別、害虫タイプ別、用途別、作物タイプ別、地域別、機会、予測、2016年~2030年Biopesticide Active Ingredients Market Assessment, By Ingredient Type, By Source, By Pest Type, By Application, By Crop Type, By Region, Opportunities and Forecast, 2016-2030F |
||||||
|
|
|||||||
カスタマイズ可能
|
|||||||


| 生物農薬有効成分の世界市場:成分タイプ別、由来別、害虫タイプ別、用途別、作物タイプ別、地域別、機会、予測、2016年~2030年 |
|
出版日: 2023年09月01日
発行: Market Xcel - Markets and Data
ページ情報: 英文 122 Pages
納期: 3~5営業日
|

- 全表示
- 概要
- 図表
- 目次
生物農薬有効成分の市場規模は、2022年に26億米ドルと評価され、2023年から2030年の予測期間には8.8%のCAGRで拡大し、2030年には51億米ドルに達すると予測されています。従来の合成農薬は有害な化学物質とみなされ、作物収量や水生生物を脅かし、さらには人間の健康悪化にもつながります。これらの農薬は土壌の生物多様性に悪影響を与え、土壌呼吸を低下させ、微生物の活動を弱めるため、持続可能な作物生産には適しません。生物農薬は、環境にやさしく、持続可能で、特異的な作用様式を持つなど、そのユニークな特徴から、より優れた代替手段となります。
既知の生物農薬の中でも、バチルス・チューリンゲンシス(BT)は有効性が高く、生物農薬に広く使用されている著名な有効成分です。長年にわたるバチルス・チューリンゲンシスの組成に関するさまざまな製剤化技術が、その特異的作用の変化を分析するために実施されています。バチルス・チューリンゲンシス(BT)菌は、鱗翅目害虫(イモムシ)の幼虫を中心に、昆虫に特異的に有害な結晶性タンパク質(Cry毒素)を生成します。その作用機序は、害虫のイモムシに摂取され、BT結晶が幼虫の中腸のアルカリ性環境で可溶化し、鱗翅目特有の腸内酵素によって順次分解され、活性のある毒素タンパク質に変化します。こうした用途と作物中の有機飼料が、生物農薬活性成分の市場需要を促進すると予想されます。
市場に出回っている微生物生物農薬の大部分約90%は、よく知られた単一細菌であるバチルス・チューリンゲンシス(BT)に由来するもので、生物農薬の大部分を占めています。米国の農作物保護剤の市場シェアは世界で約30億米ドルで、世界市場のわずか5%にすぎません。生物農薬の市場シェアの増加は、世界全体の約10%に相当します。米国市場では200以上の製品が流通していますが、欧州連合(EU)市場ではわずか60の類似品で構成されています。EUは化学合成物質と同じ規制で生物農薬を認可しており、生物農薬の市場拡大のために既存の規制にいくつかの条項を追加する絶好の機会です。しかし、すべての農務省は、生物農薬の活動の価値を認め、導入しやすいツールとするために、生物農薬にライセンシングを提供する厳格な規制を実施すべきです。欧州連合(EU)の数カ国では、新しい安全食品規制が施行され、ヒトや動物の健康への悪影響を考慮し、植物保護における合成化学物質の使用を取りやめています。上記のような規定は、規制の観点から生物農薬有効成分市場に大きなチャンスをもたらす可能性があります。
合成農薬の大量消費とその有害な影響は、代替農薬の探索を刺激し、生物農薬へと導きました。生物活性分子と加水分解酵素は総合的害虫管理にとって非常に重要であると考えられており、キチナーゼは殺菌、殺虫、殺線虫活性を単独または組み合わせて付与する特異的な特性を持っているため、作物保護に適しています。総合的病害虫管理(IPM)は国連食糧農業機関によって明確に定義されており、利用可能な害虫駆除技術を注意深く実行することを目的としています。適切な方法を統合することで、結果的に害虫の発生を抑制し、人間の健康や環境を脅かす有害な農薬の介入を監視することにつながっています。キチナーゼはキチンを構成しない植物や脊椎動物には無害であり、総合的害虫管理の有望な要素です。
当レポートでは、世界の生物農薬有効成分市場について調査し、市場の概要とともに、成分タイプ別、由来別、害虫タイプ別、用途別、作物タイプ別、地域別動向、および市場に参入する企業のプロファイルなどを提供しています。
目次
第1章 調査手法
第2章 プロジェクトの範囲と定義
第3章 COVID-19が生物農薬有効成分市場に与える影響
第4章 ロシア・ウクライナ戦争の影響
第5章 エグゼクティブサマリー
第6章 お客様の声
第7章 生物農薬有効成分市場の見通し、2016年~2030年
- 市場規模と予測
- 成分タイプ別
- トリコデルマビリデ
- ボーベリアバシアナ
- シュードモナス・フルオレッセンス
- バーティシリウムレカニイ
- バチルス・チューリンゲンシス
- その他
- 由来別
- 植物
- 昆虫
- 微生物
- 害虫タイプ別
- 殺虫剤
- 殺菌剤
- 殺線虫剤
- その他
- 用途別
- 土壌処理
- 葉面処理
- 種子の処理
- その他
- 作物タイプ別
- 換金作物
- 果物と野菜
- 芝生と観賞植物
- 地域別
- 北米
- 欧州
- 南米
- アジア太平洋
- 中東・アフリカ
- 企業別市場シェア(%)、2022年
第8章 生物農薬有効成分市場の見通し、地域別、2016年~2030年
- 北米
- 欧州
- 南米
- アジア太平洋
- 中東・アフリカ
第9章 供給サイド分析
第10章 市場マッピング、2022年
第11章 マクロ環境と産業構造
- 需給分析
- 輸出入分析- 量と金額
- サプライ/バリューチェーン分析
- PESTEL分析
- ポーターのファイブフォース分析
第12章 市場力学
第13章 主要参入企業の情勢
第14章 価格分析
第15章 ケーススタディ
第16章 主要企業の見通し
- Syngenta AG
- FMC Corporation
- Isagro S.P.A
- Corteva Agriscience
- Koppert Biological Systems
- Novozymes A/S
- Bionema
- UPL Limited
- Certis Biologicals
- STK Bio-Ag Technologies
第17章 戦略的推奨事項
第18章 お問合せと免責事項
List of Tables
- Table 1. Pricing Analysis of Products from Key Players
- Table 2. Competition Matrix of Top 5 Market Leaders
- Table 3. Mergers & Acquisitions/ Joint Ventures (If Applicable)
- Table 4. About Us - Regions and Countries Where We Have Executed Client Projects
List of Figures
- Figure 1. Global Biopesticide Active Ingredients Market, By Value, In USD Billion, 2016-2030F
- Figure 2. Global Biopesticide Active Ingredients Market, By Volume, In Tons, 2016-2030F
- Figure 3. Global Biopesticide Active Ingredients Market Share, By Ingredient Type, In USD Billion, 2016-2030F
- Figure 4. Global Biopesticide Active Ingredients Market Share, By Source, In USD Billion, 2016-2030F
- Figure 5. Global Biopesticide Active Ingredients Market Share, By Pest Type, In USD Billion, 2016-2030F
- Figure 6. Global Biopesticide Active Ingredients Market Share, By Application, In USD Billion, 2016-2030F
- Figure 7. Global Biopesticide Active Ingredients Market Share, By Crop Type, In USD Billion, 2016-2030F
- Figure 8. Global Biopesticide Active Ingredients Market Share, By Region, In USD Billion, 2016-2030F
- Figure 9. North America Biopesticide Active Ingredients Market, By Value, In USD Billion, 2016-2030F
- Figure 10. North America Biopesticide Active Ingredients Market, By Volume, In Tons, 2016-2030F
- Figure 11. North America Biopesticide Active Ingredients Market Share, By Ingredient Type, In USD Billion, 2016-2030F
- Figure 12. North America Biopesticide Active Ingredients Market Share, By Source, In USD Billion, 2016-2030F
- Figure 13. North America Biopesticide Active Ingredients Market Share, By Pest Type, In USD Billion, 2016-2030F
- Figure 14. North America Biopesticide Active Ingredients Market Share, By Application, In USD Billion, 2016-2030F
- Figure 15. North America Biopesticide Active Ingredients Market Share, By Crop Type, In USD Billion, 2016-2030F
- Figure 16. North America Biopesticide Active Ingredients Market Share, By Country, In USD Billion, 2016-2030F
- Figure 17. United States Biopesticide Active Ingredients Market, By Value, In USD Billion, 2016-2030F
- Figure 18. United States Biopesticide Active Ingredients Market, By Volume, In Tons, 2016-2030F
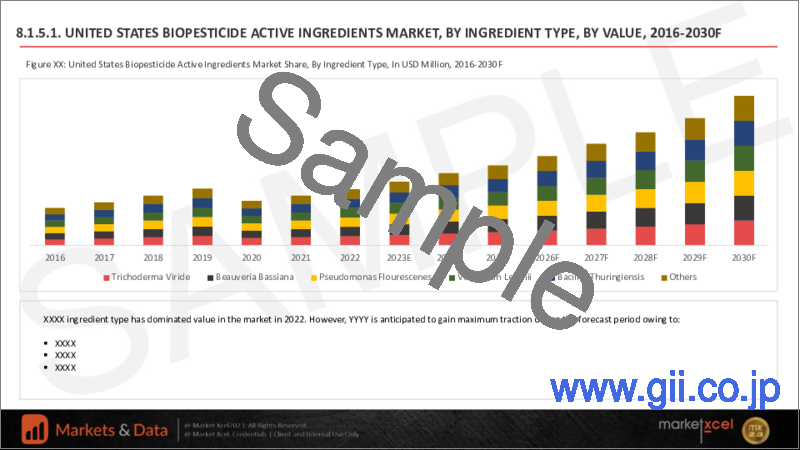
- Figure 19. United States Biopesticide Active Ingredients Market Share, By Ingredient Type, In USD Billion, 2016-2030F
- Figure 20. United States Biopesticide Active Ingredients Market Share, By Source, In USD Billion, 2016-2030F
- Figure 21. United States Biopesticide Active Ingredients Market Share, By Pest Type, In USD Billion, 2016-2030F
- Figure 22. United States Biopesticide Active Ingredients Market Share, By Application, In USD Billion, 2016-2030F
- Figure 23. United States Biopesticide Active Ingredients Market Share, By Crop Type, In USD Billion, 2016-2030F
- Figure 24. Canada Biopesticide Active Ingredients Market, By Value, In USD Billion, 2016-2030F
- Figure 25. Canada Biopesticide Active Ingredients Market, By Volume, In Tons, 2016-2030F
- Figure 26. Canada Biopesticide Active Ingredients Market Share, By Ingredient Type, In USD Billion, 2016-2030F
- Figure 27. Canada Biopesticide Active Ingredients Market Share, By Source, In USD Billion, 2016-2030F
- Figure 28. Canada Biopesticide Active Ingredients Market Share, By Pest Type, In USD Billion, 2016-2030F
- Figure 29. Canada Biopesticide Active Ingredients Market Share, By Application, In USD Billion, 2016-2030F
- Figure 30. Canada Biopesticide Active Ingredients Market Share, By Crop Type, In USD Billion, 2016-2030F
- Figure 31. Mexico Biopesticide Active Ingredients Market, By Value, In USD Billion, 2016-2030F
- Figure 32. Mexico Biopesticide Active Ingredients Market, By Volume, In Tons, 2016-2030F
- Figure 33. Mexico Biopesticide Active Ingredients Market Share, By Ingredient Type, In USD Billion, 2016-2030F
- Figure 34. Mexico Biopesticide Active Ingredients Market Share, By Source, In USD Billion, 2016-2030F
- Figure 35. Mexico Biopesticide Active Ingredients Market Share, By Pest Type, In USD Billion, 2016-2030F
- Figure 36. Mexico Biopesticide Active Ingredients Market Share, By Application, In USD Billion, 2016-2030F
- Figure 37. Mexico Biopesticide Active Ingredients Market Share, By Crop Type, In USD Billion, 2016-2030F
- Figure 38. Europe Biopesticide Active Ingredients Market, By Value, In USD Billion, 2016-2030F
- Figure 39. Europe Biopesticide Active Ingredients Market, By Volume, In Tons, 2016-2030F
- Figure 40. Europe Biopesticide Active Ingredients Market Share, By Ingredient Type, In USD Billion, 2016-2030F
- Figure 41. Europe Biopesticide Active Ingredients Market Share, By Source, In USD Billion, 2016-2030F
- Figure 42. Europe Biopesticide Active Ingredients Market Share, By Pest Type, In USD Billion, 2016-2030F
- Figure 43. Europe Biopesticide Active Ingredients Market Share, By Application, In USD Billion, 2016-2030F
- Figure 44. Europe Biopesticide Active Ingredients Market Share, By Crop Type, In USD Billion, 2016-2030F
- Figure 45. Europe Biopesticide Active Ingredients Market Share, By Country, In USD Billion, 2016-2030F
- Figure 46. Germany Biopesticide Active Ingredients Market, By Value, In USD Billion, 2016-2030F
- Figure 47. Germany Biopesticide Active Ingredients Market, By Volume, In Tons, 2016-2030F
- Figure 48. Germany Biopesticide Active Ingredients Market Share, By Ingredient Type, In USD Billion, 2016-2030F
- Figure 49. Germany Biopesticide Active Ingredients Market Share, By Source, In USD Billion, 2016-2030F
- Figure 50. Germany Biopesticide Active Ingredients Market Share, By Pest Type, In USD Billion, 2016-2030F
- Figure 51. Germany Biopesticide Active Ingredients Market Share, By Application, In USD Billion, 2016-2030F
- Figure 52. Germany Biopesticide Active Ingredients Market Share, By Crop Type, In USD Billion, 2016-2030F
- Figure 53. France Biopesticide Active Ingredients Market, By Value, In USD Billion, 2016-2030F
- Figure 54. France Biopesticide Active Ingredients Market, By Volume, In Tons, 2016-2030F
- Figure 55. France Biopesticide Active Ingredients Market Share, By Ingredient Type, In USD Billion, 2016-2030F
- Figure 56. France Biopesticide Active Ingredients Market Share, By Source, In USD Billion, 2016-2030F
- Figure 57. France Biopesticide Active Ingredients Market Share, By Pest Type, In USD Billion, 2016-2030F
- Figure 58. France Biopesticide Active Ingredients Market Share, By Application, In USD Billion, 2016-2030F
- Figure 59. France Biopesticide Active Ingredients Market Share, By Crop Type, In USD Billion, 2016-2030F
- Figure 60. Italy Biopesticide Active Ingredients Market, By Value, In USD Billion, 2016-2030F
- Figure 61. Italy Biopesticide Active Ingredients Market, By Volume, In Tons, 2016-2030F
- Figure 62. Italy Biopesticide Active Ingredients Market Share, By Ingredient Type, In USD Billion, 2016-2030F
- Figure 63. Italy Biopesticide Active Ingredients Market Share, By Source, In USD Billion, 2016-2030F
- Figure 64. Italy Biopesticide Active Ingredients Market Share, By Pest Type, In USD Billion, 2016-2030F
- Figure 65. Italy Biopesticide Active Ingredients Market Share, By Application, In USD Billion, 2016-2030F
- Figure 66. Italy Biopesticide Active Ingredients Market Share, By Crop Type, In USD Billion, 2016-2030F
- Figure 67. United Kingdom Biopesticide Active Ingredients Market, By Value, In USD Billion, 2016-2030F
- Figure 68. United Kingdom Biopesticide Active Ingredients Market, By Volume, In Tons, 2016-2030F
- Figure 69. United Kingdom Biopesticide Active Ingredients Market Share, By Ingredient Type, In USD Billion, 2016-2030F
- Figure 70. United Kingdom Biopesticide Active Ingredients Market Share, By Source, In USD Billion, 2016-2030F
- Figure 71. United Kingdom Biopesticide Active Ingredients Market Share, By Pest Type, In USD Billion, 2016-2030F
- Figure 72. United Kingdom Biopesticide Active Ingredients Market Share, By Application, In USD Billion, 2016-2030F
- Figure 73. United Kingdom Biopesticide Active Ingredients Market Share, By Crop Type, In USD Billion, 2016-2030F
- Figure 74. Russia Biopesticide Active Ingredients Market, By Value, In USD Billion, 2016-2030F
- Figure 75. Russia Biopesticide Active Ingredients Market, By Volume, In Tons, 2016-2030F
- Figure 76. Russia Biopesticide Active Ingredients Market Share, By Ingredient Type, In USD Billion, 2016-2030F
- Figure 77. Russia Biopesticide Active Ingredients Market Share, By Source, In USD Billion, 2016-2030F
- Figure 78. Russia Biopesticide Active Ingredients Market Share, By Pest Type, In USD Billion, 2016-2030F
- Figure 79. Russia Biopesticide Active Ingredients Market Share, By Application, In USD Billion, 2016-2030F
- Figure 80. Russia Biopesticide Active Ingredients Market Share, By Crop Type, In USD Billion, 2016-2030F
- Figure 81. Netherlands Biopesticide Active Ingredients Market, By Value, In USD Billion, 2016-2030F
- Figure 82. Netherlands Biopesticide Active Ingredients Market, By Volume, In Tons, 2016-2030F
- Figure 83. Netherlands Biopesticide Active Ingredients Market Share, By Ingredient Type, In USD Billion, 2016-2030F
- Figure 84. Netherlands Biopesticide Active Ingredients Market Share, By Source, In USD Billion, 2016-2030F
- Figure 85. Netherlands Biopesticide Active Ingredients Market Share, By Pest Type, In USD Billion, 2016-2030F
- Figure 86. Netherlands Biopesticide Active Ingredients Market Share, By Application, In USD Billion, 2016-2030F
- Figure 87. Netherlands Biopesticide Active Ingredients Market Share, By Crop Type, In USD Billion, 2016-2030F
- Figure 88. Spain Biopesticide Active Ingredients Market, By Value, In USD Billion, 2016-2030F
- Figure 89. Spain Biopesticide Active Ingredients Market, By Volume, In Tons, 2016-2030F
- Figure 90. Spain Biopesticide Active Ingredients Market Share, By Ingredient Type, In USD Billion, 2016-2030F
- Figure 91. Spain Biopesticide Active Ingredients Market Share, By Source, In USD Billion, 2016-2030F
- Figure 92. Spain Biopesticide Active Ingredients Market Share, By Pest Type, In USD Billion, 2016-2030F
- Figure 93. Spain Biopesticide Active Ingredients Market Share, By Application, In USD Billion, 2016-2030F
- Figure 94. Spain Biopesticide Active Ingredients Market Share, By Crop Type, In USD Billion, 2016-2030F
- Figure 95. Turkey Biopesticide Active Ingredients Market, By Value, In USD Billion, 2016-2030F
- Figure 96. Turkey Biopesticide Active Ingredients Market, By Volume, In Tons, 2016-2030F
- Figure 97. Turkey Biopesticide Active Ingredients Market Share, By Ingredient Type, In USD Billion, 2016-2030F
- Figure 98. Turkey Biopesticide Active Ingredients Market Share, By Source, In USD Billion, 2016-2030F
- Figure 99. Turkey Biopesticide Active Ingredients Market Share, By Pest Type, In USD Billion, 2016-2030F
- Figure 100. Turkey Biopesticide Active Ingredients Market Share, By Application, In USD Billion, 2016-2030F
- Figure 101. Turkey Biopesticide Active Ingredients Market Share, By Crop Type, In USD Billion, 2016-2030F
- Figure 102. Poland Biopesticide Active Ingredients Market, By Value, In USD Billion, 2016-2030F
- Figure 103. Poland Biopesticide Active Ingredients Market, By Volume, In Tons, 2016-2030F
- Figure 104. Poland Biopesticide Active Ingredients Market Share, By Ingredient Type, In USD Billion, 2016-2030F
- Figure 105. Poland Biopesticide Active Ingredients Market Share, By Source, In USD Billion, 2016-2030F
- Figure 106. Poland Biopesticide Active Ingredients Market Share, By Pest Type, In USD Billion, 2016-2030F
- Figure 107. Poland Biopesticide Active Ingredients Market Share, By Application, In USD Billion, 2016-2030F
- Figure 108. Poland Biopesticide Active Ingredients Market Share, By Crop Type, In USD Billion, 2016-2030F
- Figure 109. South America Biopesticide Active Ingredients Market, By Value, In USD Billion, 2016-2030F
- Figure 110. South America Biopesticide Active Ingredients Market, By Volume, In Tons, 2016-2030F
- Figure 111. South America Biopesticide Active Ingredients Market Share, By Ingredient Type, In USD Billion, 2016-2030F
- Figure 112. South America Biopesticide Active Ingredients Market Share, By Source, In USD Billion, 2016-2030F
- Figure 113. South America Biopesticide Active Ingredients Market Share, By Pest Type, In USD Billion, 2016-2030F
- Figure 114. South America Biopesticide Active Ingredients Market Share, By Application, In USD Billion, 2016-2030F
- Figure 115. South America Biopesticide Active Ingredients Market Share, By Crop Type, In USD Billion, 2016-2030F
- Figure 116. South America Biopesticide Active Ingredients Market Share, By Country, In USD Billion, 2016-2030F
- Figure 117. Brazil Biopesticide Active Ingredients Market, By Value, In USD Billion, 2016-2030F
- Figure 118. Brazil Biopesticide Active Ingredients Market, By Volume, In Tons, 2016-2030F
- Figure 119. Brazil Biopesticide Active Ingredients Market Share, By Ingredient Type, In USD Billion, 2016-2030F
- Figure 120. Brazil Biopesticide Active Ingredients Market Share, By Source, In USD Billion, 2016-2030F
- Figure 121. Brazil Biopesticide Active Ingredients Market Share, By Pest Type, In USD Billion, 2016-2030F
- Figure 122. Brazil Biopesticide Active Ingredients Market Share, By Application, In USD Billion, 2016-2030F
- Figure 123. Brazil Biopesticide Active Ingredients Market Share, By Crop Type, In USD Billion, 2016-2030F
- Figure 124. Argentina Biopesticide Active Ingredients Market, By Value, In USD Billion, 2016-2030F
- Figure 125. Argentina Biopesticide Active Ingredients Market, By Volume, In Tons, 2016-2030F
- Figure 126. Argentina Biopesticide Active Ingredients Market Share, By Ingredient Type, In USD Billion, 2016-2030F
- Figure 127. Argentina Biopesticide Active Ingredients Market Share, By Source, In USD Billion, 2016-2030F
- Figure 128. Argentina Biopesticide Active Ingredients Market Share, By Pest Type, In USD Billion, 2016-2030F
- Figure 129. Argentina Biopesticide Active Ingredients Market Share, By Application, In USD Billion, 2016-2030F
- Figure 130. Argentina Biopesticide Active Ingredients Market Share, By Crop Type, In USD Billion, 2016-2030F
- Figure 131. Asia-Pacific Biopesticide Active Ingredients Market, By Value, In USD Billion, 2016-2030F
- Figure 132. Asia-Pacific Biopesticide Active Ingredients Market, By Volume, In Tons, 2016-2030F
- Figure 133. Asia-Pacific Biopesticide Active Ingredients Market Share, By Ingredient Type, In USD Billion, 2016-2030F
- Figure 134. Asia-Pacific Biopesticide Active Ingredients Market Share, By Source, In USD Billion, 2016-2030F
- Figure 135. Asia-Pacific Biopesticide Active Ingredients Market Share, By Pest Type, In USD Billion, 2016-2030F
- Figure 136. Asia-Pacific Biopesticide Active Ingredients Market Share, By Application, In USD Billion, 2016-2030F
- Figure 137. Asia- Pacific Cream Market Share, By Crop Type, In USD Billion, 2016-2030F
- Figure 138. Asia-Pacific Biopesticide Active Ingredients Market Share, By Country, In USD Billion, 2016-2030F
- Figure 139. India Biopesticide Active Ingredients Market, By Value, In USD Billion, 2016-2030F
- Figure 140. India Biopesticide Active Ingredients Market, By Volume, In Tons, 2016-2030F
- Figure 141. India Biopesticide Active Ingredients Market Share, By Ingredient Type, In USD Billion, 2016-2030F
- Figure 142. India Biopesticide Active Ingredients Market Share, By Source, In USD Billion, 2016-2030F
- Figure 143. India Biopesticide Active Ingredients Market Share, By Pest Type, In USD Billion, 2016-2030F
- Figure 144. India Biopesticide Active Ingredients Market Share, By Application, In USD Billion, 2016-2030F
- Figure 145. India Biopesticide Active Ingredients Market Share, By Crop Type, In USD Billion, 2016-2030F
- Figure 146. China Biopesticide Active Ingredients Market, By Value, In USD Billion, 2016-2030F
- Figure 147. China Biopesticide Active Ingredients Market, By Volume, In Tons, 2016-2030F
- Figure 148. China Biopesticide Active Ingredients Market Share, By Ingredient Type, In USD Billion, 2016-2030F
- Figure 149. China Biopesticide Active Ingredients Market Share, By Source, In USD Billion, 2016-2030F
- Figure 150. China Biopesticide Active Ingredients Market Share, By Pest Type, In USD Billion, 2016-2030F
- Figure 151. China Biopesticide Active Ingredients Market Share, By Application, In USD Billion, 2016-2030F
- Figure 152. China Biopesticide Active Ingredients Market Share, By Crop Type, In USD Billion, 2016-2030F
- Figure 153. Japan Biopesticide Active Ingredients Market, By Value, In USD Billion, 2016-2030F
- Figure 154. Japan Biopesticide Active Ingredients Market, By Volume, In Tons, 2016-2030F
- Figure 155. Japan Biopesticide Active Ingredients Market Share, By Ingredient Type, In USD Billion, 2016-2030F
- Figure 156. Japan Biopesticide Active Ingredients Market Share, By Source, In USD Billion, 2016-2030F
- Figure 157. Japan Biopesticide Active Ingredients Market Share, By Pest Type, In USD Billion, 2016-2030F
- Figure 158. Japan Biopesticide Active Ingredients Market Share, By Application, In USD Billion, 2016-2030F
- Figure 159. Japan Biopesticide Active Ingredients Market Share, By Crop Type, In USD Billion, 2016-2030F
- Figure 160. Australia Biopesticide Active Ingredients Market, By Value, In USD Billion, 2016-2030F
- Figure 161. Australia Biopesticide Active Ingredients Market, By Volume, In Tons, 2016-2030F
- Figure 162. Australia Biopesticide Active Ingredients Market Share, By Ingredient Type, In USD Billion, 2016-2030F
- Figure 163. Australia Biopesticide Active Ingredients Market Share, By Source, In USD Billion, 2016-2030F
- Figure 164. Australia Biopesticide Active Ingredients Market Share, By Pest Type, In USD Billion, 2016-2030F
- Figure 165. Australia Biopesticide Active Ingredients Market Share, By Application, In USD Billion, 2016-2030F
- Figure 166. Australia Biopesticide Active Ingredients Market Share, By Crop Type, In USD Billion, 2016-2030F
- Figure 167. Vietnam Biopesticide Active Ingredients Market, By Value, In USD Billion, 2016-2030F
- Figure 168. Vietnam Biopesticide Active Ingredients Market, By Volume, In Tons, 2016-2030F
- Figure 169. Vietnam Biopesticide Active Ingredients Market Share, By Ingredient Type, In USD Billion, 2016-2030F
- Figure 170. Vietnam Biopesticide Active Ingredients Market Share, By Source, In USD Billion, 2016-2030F
- Figure 171. Vietnam Biopesticide Active Ingredients Market Share, By Pest Type, In USD Billion, 2016-2030F
- Figure 172. Vietnam Biopesticide Active Ingredients Market Share, By Application, In USD Billion, 2016-2030F
- Figure 173. Vietnam Biopesticide Active Ingredients Market Share, By Crop Type, In USD Billion, 2016-2030F
- Figure 174. South Korea Biopesticide Active Ingredients Market, By Value, In USD Billion, 2016-2030F
- Figure 175. South Korea Biopesticide Active Ingredients Market, By Volume, In Tons, 2016-2030F
- Figure 176. South Korea Biopesticide Active Ingredients Market Share, By Ingredient Type, In USD Billion, 2016-2030F
- Figure 177. South Korea Biopesticide Active Ingredients Market Share, By Source, In USD Billion, 2016-2030F
- Figure 178. South Korea Biopesticide Active Ingredients Market Share, By Pest Type, In USD Billion, 2016-2030F
- Figure 179. South Korea Biopesticide Active Ingredients Market Share, By Application, In USD Billion, 2016-2030F
- Figure 180. South Korea Biopesticide Active Ingredients Market Share, By Crop Type, In USD Billion, 2016-2030F
- Figure 181. Indonesia Biopesticide Active Ingredients Market, By Value, In USD Billion, 2016-2030F
- Figure 182. Indonesia Biopesticide Active Ingredients Market, By Volume, In Tons, 2016-2030F
- Figure 183. Indonesia Biopesticide Active Ingredients Market Share, By Ingredient Type, In USD Billion, 2016-2030F
- Figure 184. Indonesia Biopesticide Active Ingredients Market Share, By Source, In USD Billion, 2016-2030F
- Figure 185. Indonesia Biopesticide Active Ingredients Market Share, By Pest Type, In USD Billion, 2016-2030F
- Figure 186. Indonesia Biopesticide Active Ingredients Market Share, By Application, In USD Billion, 2016-2030F
- Figure 187. Indonesia Biopesticide Active Ingredients Market Share, By Crop Type, In USD Billion, 2016-2030F
- Figure 188. Philippines Biopesticide Active Ingredients Market, By Value, In USD Billion, 2016-2030F
- Figure 189. Philippines Biopesticide Active Ingredients Market, By Volume, In Tons, 2016-2030F
- Figure 190. Philippines Biopesticide Active Ingredients Market Share, By Ingredient Type, In USD Billion, 2016-2030F
- Figure 191. Philippines Biopesticide Active Ingredients Market Share, By Source, In USD Billion, 2016-2030F
- Figure 192. Philippines Biopesticide Active Ingredients Market Share, By Pest Type, In USD Billion, 2016-2030F
- Figure 193. Philippines Biopesticide Active Ingredients Market Share, By Application, In USD Billion, 2016-2030F
- Figure 194. Philippines Biopesticide Active Ingredients Market Share, By Crop Type, In USD Billion, 2016-2030F
- Figure 195. Middle East & Africa Biopesticide Active Ingredients Market, By Value, In USD Billion, 2016-2030F
- Figure 196. Middle East & Africa Biopesticide Active Ingredients Market, By Volume, In Tons, 2016-2030F
- Figure 197. Middle East & Africa Biopesticide Active Ingredients Market Share, By Ingredient Type, In USD Billion, 2016-2030F
- Figure 198. Middle East & Africa Biopesticide Active Ingredients Market Share, By Ingredient Type, In Tons, 2016-2030F
- Figure 199. Middle East & Africa Biopesticide Active Ingredients Market Share, By Source, In USD Billion, 2016-2030F
- Figure 200. Middle East & Africa Biopesticide Active Ingredients Market Share, By Pest Type, In USD Billion, 2016-2030F
- Figure 201. Middle East & Africa Biopesticide Active Ingredients Market Share, By Application, In USD Billion, 2016-2030F
- Figure 202. Middle East & Africa Biopesticide Active Ingredients Market Share, By Crop Type, In USD Billion, 2016-2030F
- Figure 203. Middle East & Africa Biopesticide Active Ingredients Market Share, By Country, In USD Billion, 2016-2030F
- Figure 204. Saudi Arabia Biopesticide Active Ingredients Market, By Value, In USD Billion, 2016-2030F
- Figure 205. Saudi Arabia Biopesticide Active Ingredients Market, By Volume, In Tons, 2016-2030F
- Figure 206. Saudi Arabia Biopesticide Active Ingredients Market Share, By Ingredient Type, In USD Billion, 2016-2030F
- Figure 207. Saudi Arabia Biopesticide Active Ingredients Market Share, By Source, In USD Billion, 2016-2030F
- Figure 208. Saudi Arabia Biopesticide Active Ingredients Market Share, By Pest Type, In USD Billion, 2016-2030F
- Figure 209. Saudi Arabia Biopesticide Active Ingredients Market Share, By Application, In USD Billion, 2016-2030F
- Figure 210. Saudi Arabia Biopesticide Active Ingredients Market Share, By Crop Type, In USD Billion, 2016-2030F
- Figure 211. UAE Biopesticide Active Ingredients Market, By Value, In USD Billion, 2016-2030F
- Figure 212. UAE Biopesticide Active Ingredients Market, By Volume, In Tons, 2016-2030F
- Figure 213. UAE Biopesticide Active Ingredients Market Share, By Ingredient Type, In USD Billion, 2016-2030F
- Figure 214. UAE Biopesticide Active Ingredients Market Share, By Source, In USD Billion, 2016-2030F
- Figure 215. UAE Biopesticide Active Ingredients Market Share, By Pest Type, In USD Billion, 2016-2030F
- Figure 216. UAE Biopesticide Active Ingredients Market Share, By Application, In USD Billion, 2016-2030F
- Figure 217. UAE Biopesticide Active Ingredients Market Share, By Crop Type, In USD Billion, 2016-2030F
- Figure 218. South Africa Biopesticide Active Ingredients Market, By Value, In USD Billion, 2016-2030F
- Figure 219. South Africa Biopesticide Active Ingredients Market, By Volume, In Tons, 2016-2030F
- Figure 220. South Africa Biopesticide Active Ingredients Market Share, By Ingredient Type, In USD Billion, 2016-2030F
- Figure 221. South Africa Biopesticide Active Ingredients Market Share, By Source, In USD Billion, 2016-2030F
- Figure 222. South Africa Biopesticide Active Ingredients Market Share, By Pest Type, In USD Billion, 2016-2030F
- Figure 223. South Africa Biopesticide Active Ingredients Market Share, By Application, In USD Billion, 2016-2030F
- Figure 224. South Africa Biopesticide Active Ingredients Market Share, By Crop Type, In USD Billion, 2016-2030F
- Figure 225. By Ingredient Type Map-Market Source (USD Billion) & Growth Rate (%), 2022
- Figure 226. By Source Map-Market Source (USD Billion) & Growth Rate (%), 2022
- Figure 227. By Pest Type Map-Market Source (USD Billion) & Growth Rate (%), 2022
- Figure 228. By Application Map-Market Source (USD Billion) & Growth Rate (%), 2022
- Figure 229. By Crop Type Map-Market Source (USD Billion) & Growth Rate (%), 2022
- Figure 230. By Region Map-Market Source (USD Billion) & Growth Rate (%), 2022
The Biopesticide Active Ingredients Market size was valued at USD 2.6 billion in 2022, which is expected to reach USD 5.1 billion in 2030 with a CAGR of 8.8% for the forecast period between 2023 and 2030. Conventional synthetic pesticides are considered harmful chemicals, threaten crop yield and aquatic life, and even lead to the deterioration of human health. These agrochemical products are unsuitable for sustainable crop production as they negatively impact soil biodiversity, reduce soil respiration, and lessen the activities of microorganisms. Biopesticides are a better alternative due to their unique characteristics such as environmentally friendly, sustainable, and specific mode of action.
Among the known biological pesticides, Bacillus Thuringiensis (BT) are a prominent active ingredients which are effective and widely used in biopesticides. The different formulation technologies are executed on the composition of Bacillus Thuringiensis over the years to analyze the variation of its specific action. The Bacillus Thuringiensis (BT) bacterium generates crystalline proteins (Cry toxins) that are specifically noxious to insects, focusing on larvae of Lepidoptera pests (caterpillars). Its mode of action comprises of ingestion by a pest caterpillar, BT crystals solubilize in the alkaline environment of the larval midgut and are sequentially broken down by Lepidopteran-specific gut enzymes into active toxin proteins. These applications and organic feeds in the crop are expected to fuel the market demand for active biopesticide ingredients.
Commercial Exploitation of Biopesticides
Majorly around 90% of microbial biopesticides on the market are derived from the well-known single bacterium Bacillus Thuringiensis (BT) which covers a vast portion of biological pesticides. The market share for crop protection in the United States is around USD 3 billion globally, just 5% of the global market. The increase in market share for biological pesticides corresponds to around 10% globally. Over 200 products are circulated across the United States market, while the European Union (EU) market comprises only 60 analogs. EU authorizes biopesticides by the same regulations as synthetic substances, where it has an excellent opportunity to add several provisions to the existing one for enhancing the market of biological pesticides. However, all agriculture departments should enforce stringent regulations to provide licensing for biopesticides to recognize the value of their activity and make it an easy-to-implement tool. In a few countries across the European Union, new safety food regulations are implemented, which withdraw the usage of synthetic chemicals in plant protection considering its adverse effects on human and animal health. The above-discussed provisions can generate enormous opportunities for the biopesticides active ingredient market in terms of regulations.
Integrated Pest Management
Massive consumption of synthetic pesticides and their harmful impacts stimulated the search for alternatives, leading to biological pesticides. Bioactive molecules and hydrolytic enzymes are considered very important for integrated pest management, where chitinases are suitable for crop protection due to their specific characteristics imparting fungicidal, insecticidal, and nematicidal activities individually or in combination. Integrated Pest Management (IPM) is explicitly defined by the Food and Agriculture Organization of the United Nations that operates with the objective of careful execution of available pest control techniques. Integrating appropriate methods consequently led to discouraging the application of pest populations and monitoring the interventions of harmful pesticides that threaten human health and the environment. Chitinases are harmless for plants and vertebrates that don't comprise Chitin and serve as a promising component for integrated pest management.
The IPM can be practiced with proper application to agricultural and non-agricultural applications such as gardens, homes, and workplaces. IPM practices are not a one-step process; instead consist of a series of pest management evaluations, proper decisions, and controls. Generally, it comprises four significant steps: setting action thresholds, monitoring, identifying pests, preventing, and controlling sequentially. The goal of implementing IPM practices has huge potential in the market to expand and create opportunities for the biopesticides active ingredients market.
Impact of COVID-19
The COVID-19 pandemic has led to unprecedented economic instability, supply chain disruptions, and workforce reductions. The supply of plant protection products (PPPs) comprised of active biopesticide ingredients was affected by imposed lockdown and quarantine protocols. In the early stage of the pandemic, China was severely hit regarding the production of PPPs, which declined sharply. The disturbance created by COVID-19 for the movement of PPPs from global suppliers to the base ground level has significantly reduced the conventional outcomes. To compensate for the losses, countries implement efforts to increase the production of biopesticides. The demand for crops was rising significantly, and to reach the farmer's demand into various applications of various biological pesticides in different crop productions. The global requirement for meeting food demand is exploding, which requires more crop production and, ultimately, biopesticides, giving the biopesticides active ingredients market to grow in different allied sectors.
Impact of Russia-Ukraine War
The annexation of Russia on Ukraine has imposed various sanctions on natural gas supplies by European countries, severely impacting the European agrochemical industry. Natural gas is extensively used to drive active ingredient production. Ukraine and Russia are both key exporters of cereal and oilseed crops, where war led to the impact of cereal grains and sunflower oil seed stocks. The prevailing situation is gradually improving as countries focus on innovation and technological advancement to develop biological pesticides and grow favorable crops according to their conditions. This will reduce dependency on importer countries and provide a way for indigenous structure. Consequently, the market will explode for biopesticide active ingredients, which could fascinate investors to explore the market's potential.
Key Players Landscape and Outlook
Companies are continuously putting their efforts into reducing the dependence on synthetic chemicals and increasing the application of biological pesticides. The companies are generating various products which are organic and eco-friendly in usage across the arable lands. For instance, Syngenta AG has a wide range of crop protection products that comprise biopesticides. Their products are registered under trademark in the respective country, which includes individual unique characteristics and delivers significant results to crop protection. BANVEL/CADENCE, herbicide selective, has been extensively used in Argentina, Canada, France, Hungary, and Russia. A well-defined product for perennial broad-leaf weed control primarily focuses on corn and cereals extending its application to turf, pasture, and non-crop land.
Another product, ISABION, which lies in the category of biologicals/bio-stimulants, is complementary to crop nutrition and its protection. It is an amino acid and nutrient-based bio-stimulant that can enhance crop performance (growth, vigor, yield, quality). Likewise, there are opportunities for new biopesticide active ingredients specific to crop protection and improving various characteristics that will dominate the market.
Table of Contents
1. Research Methodology
2. Project Scope & Definitions
3. Impact of COVID-19 on Biopesticide Active Ingredients Market
4. Impact of Russia-Ukraine War
5. Executive Summary
6. Voice of Customer
- 6.1. Market Awareness and Product Information
- 6.2. Brand Awareness and Loyalty
- 6.3. Factors Considered in Purchase Decision
- 6.3.1. Brand Name
- 6.3.2. Quality
- 6.3.3. Quantity
- 6.3.4. Price
- 6.3.5. Product Specification
- 6.3.6. Application Specification
- 6.3.7. Shelf-life
- 6.3.8. Availability of Product
- 6.4. Frequency of Purchase
- 6.5. Medium of Purchase
7. Biopesticide Active Ingredients Market Outlook, 2016-2030F
- 7.1. Market Size & Forecast
- 7.1.1. By Value
- 7.1.2. By Volume
- 7.2. By Ingredient Type
- 7.2.1. Trichoderma Viride
- 7.2.2. Beauveria Bassiana
- 7.2.3. Pseudomonas Fluorescence
- 7.2.4. Verticilium Lecanii
- 7.2.5. Bacillus Thuringiensis
- 7.2.6. Others
- 7.3. By Source
- 7.3.1. Plants
- 7.3.2. Insects
- 7.3.3. Microorganisms
- 7.4. By Pest Type
- 7.4.1. Insecticide
- 7.4.2. Fungicide
- 7.4.3. Nematicide
- 7.4.4. Others
- 7.5. By Application
- 1.1.1. Soil Treatment
- 1.1.2. Foliar Treatment
- 1.1.3. Seed Treatment
- 1.1.4. Others
- 7.6. By Crop Type
- 7.6.1. Cash Crop
- 7.6.1.1. Cereals & Grains
- 7.6.1.1.1. Wheat
- 7.6.1.1.2. Rice
- 7.6.1.1.3. Corn
- 7.6.1.1.4. Others
- 7.6.1.2. Oilseeds & Pulses
- 7.6.1.2.1. Cotton Seed
- 7.6.1.2.2. Soya Bean
- 7.6.1.2.3. Sunflower
- 7.6.1.2.4. Others
- 7.6.2. Fruits and Vegetables
- 7.6.3. Turf and Ornamentals
- 7.6.1. Cash Crop
- 7.7. By Region
- 7.7.1. North America
- 7.7.2. Europe
- 7.7.3. South America
- 7.7.4. Asia-Pacific
- 7.7.5. Middle East and Africa
- 7.8. By Company Market Share (%), 2022
8. Biopesticide Active Ingredients Market Outlook, By Region, 2016-2030F
- 8.1. North America*
- 8.1.1. By Ingredient Type
- 8.1.1.1. Trichoderma Viride
- 8.1.1.2. Beauveria Bassiana
- 8.1.1.3. Pseudomonas Flourescenes
- 8.1.1.4. Verticilium Lecanii
- 8.1.1.5. Bacillus Thuringiensis
- 8.1.1.6. Others
- 8.1.2. By Source
- 8.1.2.1. Plants
- 8.1.2.2. Insects
- 8.1.2.3. Microorganisms
- 8.1.3. By Pest Type
- 8.1.3.1. Insecticide
- 8.1.3.2. Fungicide
- 8.1.3.3. Nematicide
- 8.1.3.4. Others
- 8.1.4. By Application
- 8.1.4.1. Soil Treatment
- 8.1.4.2. Foliar Treatment
- 8.1.4.3. Seed Treatment
- 8.1.4.4. Others
- 8.1.5. By Crop Type
- 8.1.5.1. Cash Crop
- 8.1.5.1.1. Cereals & Grains
- 8.1.5.1.1.1. Wheat
- 8.1.5.1.1.2. Rice
- 8.1.5.1.1.3. Corn
- 8.1.5.1.1.4. Others
- 8.1.5.1.2. Oilseeds & Pulses
- 8.1.5.1.2.1. Cotton Seed
- 8.1.5.1.2.2. Soya Bean
- 8.1.5.1.2.3. Sunflower
- 8.1.5.1.2.4. Others
- 8.1.5.2. Fruits and Vegetables
- 8.1.5.3. Turf and Ornamentals
- 8.1.6. United States*
- 8.1.6.1. By Ingredient Type
- 8.1.6.1.1. Trichoderma Viride
- 8.1.6.1.2. Beauveria Bassiana
- 8.1.6.1.3. Pseudomonas Flourescenes
- 8.1.6.1.4. Verticilium Lecanii
- 8.1.6.1.5. Bacillus Thuringiensis
- 8.1.6.1.6. Others
- 8.1.6.2. By Source
- 8.1.6.2.1. Plants
- 8.1.6.2.2. Insects
- 8.1.6.2.3. Microorganisms
- 8.1.6.3. By Pest Type
- 8.1.6.3.1. Insecticide
- 8.1.6.3.2. Fungicide
- 8.1.6.3.3. Nematicide
- 8.1.6.3.4. Others
- 8.1.6.4. By Application
- 8.1.6.4.1. Soil Treatment
- 8.1.6.4.2. Foliar Treatment
- 8.1.6.4.3. Seed Treatment
- 8.1.6.4.4. Others
- 8.1.6.5. By Crop Type
- 8.1.6.5.1. Cash Crop
- 8.1.6.5.1.1. Cereals & Grains
- 8.1.6.5.1.1.1. Wheat
- 8.1.6.5.1.1.2. Rice
- 8.1.6.5.1.1.3. Corn
- 8.1.6.5.1.1.4. Others
- 8.1.6.5.1.2. Oilseeds & Pulses
- 8.1.6.5.1.2.1. Cotton Seed
- 8.1.6.5.1.2.2. Soya Bean
- 8.1.6.5.1.2.3. Sunflower
- 8.1.6.5.1.2.4. Others
- 8.1.6.5.2. Fruits and Vegetables
- 8.1.6.6. Turf and Ornamentals
- 8.1.7. Canada
- 8.1.8. Mexico
- 8.1.1. By Ingredient Type
All segments will be provided for all regions and countries covered
- 8.2. Europe
- 8.2.1. Germany
- 8.2.2. France
- 8.2.3. Italy
- 8.2.4. United Kingdom
- 8.2.5. Russia
- 8.2.6. Netherlands
- 8.2.7. Spain
- 8.2.8. Turkey
- 8.2.9. Poland
- 8.3. South America
- 8.3.1. Brazil
- 8.3.2. Argentina
- 8.4. Asia-Pacific
- 8.4.1. India
- 8.4.2. China
- 8.4.3. Japan
- 8.4.4. Australia
- 8.4.5. Vietnam
- 8.4.6. South Korea
- 8.4.7. Indonesia
- 8.4.8. Philippines
- 8.5. Middle East & Africa
- 8.5.1. Saudi Arabia
- 8.5.2. UAE
- 8.5.3. South Africa
9. Supply Side Analysis
- 9.1. Capacity, By Company
- 9.2. Production, By Company
- 9.3. Operating Efficiency, By Company
- 9.4. Key Plant Locations (Up to 25)
10. Market Mapping, 2022
- 10.1. By Ingredient Type
- 10.2. By Source
- 10.3. By Pest Type
- 10.4. By Application
- 10.5. By Crop Type
- 10.6. By Region
11. Macro Environment and Industry Structure
- 11.1. Supply Demand Analysis
- 11.2. Import Export Analysis - Volume and Value
- 11.3. Supply/Value Chain Analysis
- 11.4. PESTEL Analysis
- 11.4.1. Political Factors
- 11.4.2. Economic System
- 11.4.3. Social Implications
- 11.4.4. Technological Advancements
- 11.4.5. Environmental Impacts
- 11.4.6. Legal Compliances and Regulatory Policies (Statutory Bodies Included)
- 11.5. Porter's Five Forces Analysis
- 11.5.1. Supplier Power
- 11.5.2. Buyer Power
- 11.5.3. Substitution Threat
- 11.5.4. Threat from New Entrant
- 11.5.5. Competitive Rivalry
12. Market Dynamics
- 12.1. Growth Drivers
- 12.2. Growth Inhibitors (Challenges, Restraints)
13. Key Players Landscape
- 13.1. Competition Matrix of Top Five Market Leaders
- 13.2. Market Revenue Analysis of Top Five Market Leaders (in %, 2022)
- 13.3. Mergers and Acquisitions/Joint Ventures (If Applicable)
- 13.4. SWOT Analysis (For Five Market Players)
- 13.5. Patent Analysis (If Applicable)
14. Pricing Analysis
15. Case Studies
16. Key Players Outlook
- 16.1. Syngenta AG
- 16.1.1. Company Details
- 16.1.2. Key Management Personnel
- 16.1.3. Products & Services
- 16.1.4. Financials (As reported)
- 16.1.5. Key Market Focus & Geographical Presence
- 16.1.6. Recent Developments
- 16.2. FMC Corporation
- 16.3. Isagro S.P.A
- 16.4. Corteva Agriscience
- 16.5. Koppert Biological Systems
- 16.6. Novozymes A/S
- 16.7. Bionema
- 16.8. UPL Limited
- 16.9. Certis Biologicals
- 16.10. STK Bio-Ag Technologies
Companies mentioned above DO NOT hold any order as per market share and can be changed as per information available during research work