|
|
市場調査レポート
商品コード
1336076
生成AIの世界市場 (2016-2030年):コンポーネント・技術・エンドユーザー・地域別の機会と予測Global Generative Artificial Intelligence (AI) Market Assessment, By Component, By Technology, By End-user, By Region, Opportunities and Forecast, 2016-2030F |
||||||
|
|
|||||||
カスタマイズ可能
|
|||||||


| 生成AIの世界市場 (2016-2030年):コンポーネント・技術・エンドユーザー・地域別の機会と予測 |
|
出版日: 2023年08月22日
発行: Markets & Data
ページ情報: 英文 295 Pages
納期: 3~5営業日
|

- 全表示
- 概要
- 図表
- 目次
世界の生成AIの市場規模は、2022年の69億3,000万米ドルから、予測期間中は35.95%のCAGRで推移し、2030年には728億米ドルの規模に成長すると予測されています。
生成AIには、抽象的なアイデアの理解度向上、高品質な素材の効率的な生産、アイデンティティ保護の強化など、いくつかの利点があります。このため、生成AIは、IT 、ロボティクス、エンターテインメント、マーケティング、ヘルスケア、教育、BFSI (銀行・金融サービス・保険) など、さまざまな分野で広く利用されています。大規模なデータセットのアベイラビリティ、ディープラーニングに対する需要の増加、IoTの拡大が市場拡大の原動力となっています。
自動運転車へのAIの統合も同市場の成長を牽引しています。また、潜在顧客とのコミュニケーションにおいて、特にデータ収集やメッセージターゲティングの分野で、マーケターがAI戦術を活用するケースも増えています。B2Bマーケターの約68%が、マーケティング戦略の一環として自動化を採用しています。
各国政府は、さまざまな取り組みを通じて積極的に生成AI市場を支援しています。その取り組みには、資金援助や助成金の提供、研究・イノベーションセンターの設立、政策の策定、人材開発と教育の促進、産業界との連携やパートナーシップの促進、AIインフラへの投資などが含まれます。
ヘルスケア部門も生成AI市場を牽引する産業のひとつです。生成AIは、ヘルスケア関連の業務時間の40%を支援または強化すると予想されています。医療用画像診断では、病気の診断を強化するために生成AIが活用されています。これらのシステムは、医療用X線フィルムの膨大なデータセットを調べることで、人間の医師には見つけにくいパターンや異常を認識することを学習します。さらに、生成AIは、3DプリンティングやCRISPRなどの技術と併用することで、生体分子や義肢などをゼロから構築するのに役立ちます。さらに、癌の早期診断やより効率的な治療レジメンにもつながります。
当レポートでは、世界の生成AIの市場を調査し、製品の概要、市場規模の推移・予測、各種区分・地域別の詳細分析、産業構造、市場影響因子および市場機会の分析、ケーススタディ、競合情勢、主要企業のプロファイルなどをまとめています。
目次
第1章 調査手法
第2章 プロジェクトの範囲と定義
第3章 COVID-19の影響
第4章 エグゼクティブサマリー
第5章 顧客の声
- 人口動態
- 生成AIについての知識
- 消費者の認識と見通し
- 生成AIの普及
- 生成AIの用途
- 生成AIの導入において考慮される要素
- 生成AIの課題
- 生成AIの導入と導入スケジュール
- 生成AIと配置転換
- 内部および外部のリスク
- 労働力への影響
- 実装の課題
第6章 世界の生成AI市場の展望
- 市場規模・予測
- コンポーネント別
- ソフトウェア
- サービス
- 技術別
- トランスフォーマー
- 拡散ネットワーク
- 敵対的生成ネットワーク (GAN)
- 変分オートエンコーダー
- エンドユーザー別
- BFSI (銀行・金融サービス・保険)
- ゲーム
- ICT・通信
- ヘルスケア
- メディア・エンターテイメント
- 自動車・輸送
- その他
- 地域別
- 北米
- 欧州
- 南米
- アジア太平洋
- 中東・アフリカ
- 企業別市場シェア
第7章 世界の生成AI市場の見通し:地域別
- 北米
- 欧州
- 南米
- アジア太平洋
- 中東・アフリカ
第8章 市場マッピング
- コンポーネント別
- 技術別
- エンドユーザー別
- 地域別
第9章 マクロ環境と産業構造
- 需給分析
- サプライ/バリューチェーン分析
- PESTEL分析
- ポーターのファイブフォース分析
第10章 市場力学
- 成長推進因子
- 成長阻害因子 (課題・抑制因子)
第11章 競合情勢
- 市場リーダー上位5社の競合マトリックス
- 市場リーダー上位10社の市場収益分析
- M&A・ジョイントベンチャー (該当する場合)
- 特許分析 (該当する場合)
第12章 価格分析
第13章 ケーススタディ
第14章 主要企業の見通し
- Google LLC
- Amazon Web Services, Inc.
- Microsoft Corporation
- NVIDIA Corporation
- Openai Opco, Llc
- Adobe Inc.
- IBM Corporation
- Meta Platforms, Inc.
- Genie Ai Limited
- Synthesia Limited
第15章 戦略的推奨事項
第16章 当社について・免責事項
List of Tables
- Table 01: India Generative AI Market - Competition Matrix of Market Leaders, 2022
List of Figures
- Figure 1: Respondents (%) Region
- Figure 2: Respondents by Type of Company
- Figure 3: Respondents by Company Size
- Figure 4: Respondents Familiarity with Generative AI (%)
- Figure 5: Respondents Perception and Outlook (%)
- Figure 6: Respondents Usage of Generative AI (%)
- Figure 7: Respondents Generative AI Applications (%)
- Figure 8: Respondents Factors Considered (%)
- Figure 9: Respondents Challenges with Generative AI (%)
- Figure 10: Respondents Industry Adoption (%)
- Figure 11: Respondents Adoption Timelines (%)
- Figure 12: Respondents Job Displacement (%)
- Figure 13: Respondents Risk Evaluation (%)
- Figure 14: Generative AI Workforce Implications
- Figure 15: Respondents Implementation Challenges
- Figure 16: Global Generative Artificial Intelligence Market, By Value, In USD Billion, 2016-2030F
- Figure 17 : Global Generative Artificial Intelligence Market Share, By Component, By Value Share, In %, 2016-2030F
- Figure 18: Global Generative Artificial Intelligence Market Share, By Software, By Value Share, In %, 2016-2030F
- Figure 19: Global Generative Artificial Intelligence Market Share, By Services, By Value Share, In %, 2016-2030F
- Figure 20: Global Generative Artificial Intelligence Market Share, By Technology, By Value Share, In %, 2016-2030F
- Figure 21: Global Generative Artificial Intelligence Market Share, By End-user, By Value Share, In %, 2016-2030F
- Figure 22: Global Generative Artificial Intelligence Market Share, By Region, By Value Share, In %, 2016-2030F
- Figure 23: Global Generative AI Market Share, By Company Market Share (%), FY2022
- Figure 24: North America Generative Artificial Intelligence Market, By Value, In USD Billion, 2016-2030F
- Figure 25: North America Generative Artificial Intelligence Market Share, By Component, By Value Share, In %, 2016-2030F
- Figure 26: North America Generative Artificial Intelligence Market Share, By Software, By Value Share, In %, 2016-2030F
- Figure 27: North America Generative Artificial Intelligence Market Share, By Services, By Value Share, In %, 2016-2030F
- Figure 28: North America Generative Artificial Intelligence Market Share, By Technology, By Value Share, In %, 2016-2030F
- Figure 29: North America Generative Artificial Intelligence Market Share, By End-user, By Value Share, In %, 2016-2030F
- Figure 30: North America Generative Artificial Intelligence Market Share, By Region, By Value Share, In %, 2016-2030F
- Figure 31: United States Generative Artificial Intelligence Market, By Value, In USD Billion, 2016-2030F
- Figure 32: United States Artificial Intelligence Market Share, By Component, By Value Share, In %, 2016-2030F
- Figure 33 : United States Artificial Intelligence Market Share, By Technology, By Value Share, In %, 2016-2030F
- Figure 34: United States Artificial Intelligence Market Share, By End-user, By Value Share, In %, 2016-2030F
- Figure 35: Canada Generative Artificial Intelligence Market, By Value, In USD Billion, 2016-2030F
- Figure 36: Canada Artificial Intelligence Market Share, By Component, By Value Share, In %, 2016-2030F
- Figure 37: Canada Artificial Intelligence Market Share, By Technology, By Value Share, In %, 2016-2030F
- Figure 38: Canada Artificial Intelligence Market Share, By End-user, By Value Share, In %, 2016-2030F
- Figure 39: Mexico Generative Artificial Intelligence Market, By Value, In USD Billion, 2016-2030F
- Figure 40: Mexico Artificial Intelligence Market Share, By Component, By Value Share, In %, 2016-2030F
- Figure 41: Mexico Artificial Intelligence Market Share, By Technology, By Value Share, In %, 2016-2030F
- Figure 42: Mexico Artificial Intelligence Market Share, By End-user, By Value Share, In %, 2016-2030F
- Figure 43: Europe Generative Artificial Intelligence Market, By Value, In USD Billion, 2016-2030F
- Figure 44: Europe Generative Artificial Intelligence Market Share, By Component, By Value Share, In %, FY2017-2031F
- Figure 45: Europe Generative Artificial Intelligence Market Share, By Software, By Value Share, In %, FY2017-2031F
- Figure 46: Europe Generative Artificial Intelligence Market Share, By Services, By Value Share, In %, FY2017-2031F
- Figure 47: Europe Generative Artificial Intelligence Market Share, By Technology, By Value Share, In %, FY2017-2031F
- Figure 48: Europe Generative Artificial Intelligence Market Share, By End-user, By Value Share, In %, 2016-2030F
- Figure 49: Europe Generative Artificial Intelligence Market share, By Region, By Value Share, In %, 2016-2030F
- Figure 50: Germany Generative Artificial Intelligence Market, By Value, In USD Billion, 2016-2030F
- Figure 51: Germany Artificial Intelligence Market Share, By Component, By Value Share, In %, 2016-2030F
- Figure 52: Germany Artificial Intelligence Market Share, By Technology, By Value Share, In %, 2016-2030F
- Figure 53: Germany Artificial Intelligence Market Share, By End-user, By Value Share, In %, 2016-2030F
- Figure 54: France Generative Artificial Intelligence Market, By Value, In USD Billion, 2016-2030F
- Figure 55: France Artificial Intelligence Market Share, By Component, By Value Share, In %, 2016-2030F
- Figure 56: France Artificial Intelligence Market Share, By Technology, By Value Share, In %, 2016-2030F
- Figure 57: France Artificial Intelligence Market Share, By End-user, By Value Share, In %, 2016-2030F
- Figure 58: United Kingdom Generative Artificial Intelligence Market, By Value, In USD Billion, 2016-2030F
- Figure 59: United Kingdom Artificial Intelligence Market Share, By Component, By Value Share, In %, 2016-2030F
- Figure 60: United Kingdom Artificial Intelligence Market Share, By Technology, By Value Share, In %, 2016-2030F
- Figure 61: United Kingdom Artificial Intelligence Market Share, By End-user, By Value Share, In %, 2016-2030F
- Figure 62: Russia Generative Artificial Intelligence Market, By Value, In USD Billion, 2016-2030F
- Figure 63: Russia Artificial Intelligence Market Share, By Component, By Value Share, In %, 2016-2030F
- Figure 64: Russia Artificial Intelligence Market Share, By Technology, By Value Share, In %, 2016-2030F
- Figure 65: Russia Artificial Intelligence Market Share, By End-user, By Value Share, In %, 2016-2030F
- Figure 66: Spain Generative Artificial Intelligence Market, By Value, In USD Billion, 2016-2030F
- Figure 67: Spain Artificial Intelligence Market Share, By Component, By Value Share, In %, 2016-2030F
- Figure 68: Spain Artificial Intelligence Market Share, By Technology, By Value Share, In %, 2016-2030F
- Figure 69: Spain Artificial Intelligence Market Share, By End-user, By Value Share, In %, 2016-2030F
- Figure 70: South America Generative Artificial Intelligence Market, By Value, In USD Billion, 2016-2030F
- Figure 71: South America Generative Artificial Intelligence Market Share, By Component, By Value Share, In %, 2016-2030F
- Figure 72: South America Generative Artificial Intelligence Market Share, By Software, By Value Share, In %, 2016-2030F
- Figure 73: South America Generative Artificial Intelligence Market Share, By Services, By Value Share, In %, 2016-2030F
- Figure 74: South America Generative Artificial Intelligence Market Share, By Technology, By Value Share, In %, 2016-2030F
- Figure 75: South America Generative Artificial Intelligence Market Share, By End-user, By Value Share, In %, 2016-2030F
- Figure 76: South America Generative Artificial Intelligence Market Share, By Region, By Value Share, In %, 2016-2030F
- Figure 77: Brazil Generative Artificial Intelligence Market, By Value, In USD Billion, 2016-2030F
- Figure 78: Brazil Artificial Intelligence Market Share, By Component, By Value Share, In %, 2016-2030F
- Figure 79: Brazil Generative Artificial Intelligence Market Share, By Technology, By Value Share, In %, 2016-2030F
- Figure 80: Brazil Generative Artificial Intelligence Market Share, By End-user, By Value Share, In %, 2016-2030F
- Figure 81: Argentina Generative Artificial Intelligence Market, By Value, In USD Billion, 2016-2030F
- Figure 82: Argentina Artificial Intelligence Market Share, By Component, By Value Share, In %, 2016-2030F
- Figure 83: Argentina Generative Artificial Intelligence Market Share, By Technology, By Value Share, In %, 2016-2030F
- Figure 84: Argentina Generative Artificial Intelligence Market Share, By End-user, By Value Share, In %, 2016-2030F
- Figure 85: Colombia Generative Artificial Intelligence Market, By Value, In USD Billion, 2016-2030F
- Figure 86: Colombia Artificial Intelligence Market Share, By Component, By Value Share, In %, 2016-2030F
- Figure 87: Colombia Generative Artificial Intelligence Market Share, By Technology, By Value Share, In %, 2016-2030F
- Figure 88: Colombia Generative Artificial Intelligence Market Share, By End-user, By Value Share, In %, 2016-2030F
- Figure 89: Asia-Pacific Generative Artificial Intelligence Market, By Value, In USD Billion, 2016-2030F
- Figure 90: Asia-Pacific Generative Artificial Intelligence Market Share, By Component, By Value Share, In %, 2016-2030F
- Figure 91: Asia-Pacific Generative Artificial Intelligence Market Share, By Software, By Value Share, In %, 2016-2030F
- Figure 92: Asia-Pacific Generative Artificial Intelligence Market Share, By Services, By Value Share, In %, 2016-2030F
- Figure 93: Asia-Pacific Generative Artificial Intelligence Market Share, By Technology, By Value Share, In %, 2016-2030F
- Figure 94: Asia-Pacific Generative Artificial Intelligence Market Share, By End-user, By Value Share, In %, 2016-2030F
- Figure 95: Asia-Pacific Generative Artificial Intelligence Market Share, By Region, By Value Share, In %, 2016-2030F
- Figure 96: China Generative Artificial Intelligence Market, By Value, In USD Billion, 2016-2030F
- Figure 97: China Artificial Intelligence Market Share, By Component, By Value Share, In %, 2016-2030F
- Figure 98: China Generative Artificial Intelligence Market Share, By Technology, By Value Share, In %, 2016-2030F
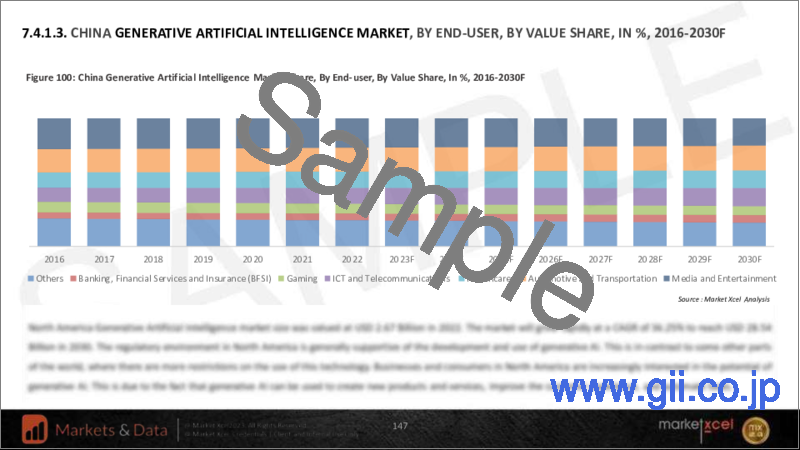
- Figure 99: China Generative Artificial Intelligence Market Share, By End-user, By Value Share, In %, 2016-2030F
- Figure 100: India Generative Artificial Intelligence Market, By Value, In USD Billion, 2016-2030F
- Figure 101: India Artificial Intelligence Market Share, By Component, By Value Share, In %, 2016-2030F
- Figure 102: India Generative Artificial Intelligence Market Share, By Technology, By Value Share, In %, 2016-2030F
- Figure 103: India Generative Artificial Intelligence Market Share, By End-user, By Value Share, In %, 2016-2030F
- Figure 104: Japan Generative Artificial Intelligence Market, By Value, In USD Billion, 2016-2030F
- Figure 105: Japan Artificial Intelligence Market Share, By Component, By Value Share, In %, 2016-2030F
- Figure 106: Japan Generative Artificial Intelligence Market Share, By Technology, By Value Share, In %, 2016-2030F
- Figure 107: Japan Generative Artificial Intelligence Market Share, By End-user, By Value Share, In %, 2016-2030F
- Figure 108: Australia Generative Artificial Intelligence Market, By Value, In USD Billion, 2016-2030F
- Figure 109: Australia Artificial Intelligence Market Share, By Component, By Value Share, In %, 2016-2030F
- Figure 110: Australia Generative Artificial Intelligence Market Share, By Technology, By Value Share, In %, 2016-2030F
- Figure 111: Australia Generative Artificial Intelligence Market Share, By End-user, By Value Share, In %, 2016-2030F
- Figure 112: South Korea Generative Artificial Intelligence Market, By Value, In USD Billion, 2016-2030F
- Figure 113: South Korea Artificial Intelligence Market Share, By Component, By Value Share, In %, 2016-2030F
- Figure 114: South Korea Generative Artificial Intelligence Market Share, By Technology, By Value Share, In %, 2016-2030F
- Figure 115: South Korea Generative Artificial Intelligence Market Share, By End-user, By Value Share, In %, 2016-2030F
- Figure 116: Middle East & Africa Generative Artificial Intelligence Market, By Value, In USD Billion, 2016-2030F
- Figure 117: Middle East & Africa Generative Artificial Intelligence Market Share, By Component, By Value Share, In %, 2016-2030F
- Figure 118: Middle East & Africa Generative Artificial Intelligence Market Share, By Software, By Value Share, In %, 2016-2030F
- Figure 119: Middle East & Africa Generative Artificial Intelligence Market Share, By Services, By Value Share, In %, 2016-2030F
- Figure 120: Middle East & Africa Generative Artificial Intelligence Market Share, By Technology, By Value Share, In %, 2016-2030F
- Figure 121: Middle East & Africa Generative Artificial Intelligence Market Share, By End-user, By Value Share, In %, 2016-2030F
- Figure 122: Middle East & Africa Generative Artificial Intelligence Market Share, By Region, By Value Share, In %, 2016-2030F
- Figure 123: Saudi Arabia Generative Artificial Intelligence Market, By Value, In USD Billion, 2016-2030F
- Figure 124: Saudi Arabia Artificial Intelligence Market Share, By Component, By Value Share, In %, 2016-2030F
- Figure 125: Saudi Arabia Artificial Intelligence Market Share, By Technology, By Value Share, In %, 2016-2030F
- Figure 126: Saudi Arabia Artificial Intelligence Market Share, By End-user, By Value Share, In %, 2016-2030F
- Figure 127 : UAE Generative Artificial Intelligence Market, By Value, In USD Billion, 2016-2030F
- Figure 128: UAE Artificial Intelligence Market Share, By Component, By Value Share, In %, 2016-2030F
- Figure 129: UAE Artificial Intelligence Market Share, By Technology, By Value Share, In %, 2016-2030F
- Figure 130: UAE Artificial Intelligence Market Share, By End-user, By Value Share, In %, 2016-2030F
- Figure 131: South Africa Generative Artificial Intelligence Market, By Value, In USD Billion, 2016-2030F
- Figure 132: South Africa Artificial Intelligence Market Share, By Component, By Value Share, In %, 2016-2030F
- Figure 133: South Africa Artificial Intelligence Market Share, By Technology, By Value Share, In %, 2016-2030F
- Figure 134: South Africa Artificial Intelligence Market Share, By End-user, By Value Share, In %, 2016-2030F
- Figure 135: Egypt Generative Artificial Intelligence Market, By Value, In USD Billion, 2016-2030F
- Figure 136: Egypt Artificial Intelligence Market Share, By Component, By Value Share, In %, 2016-2030F
- Figure 137: Egypt Artificial Intelligence Market Share, By Technology, By Value Share, In %, 2016-2030F
- Figure 138: Egypt Artificial Intelligence Market Share, By End-user, By Value Share, In %, 2016-2030F
- Figure 139: By Component Map-Market Size (USD Billion, 2023) & Growth Rate (%), 2023E-2030F
- Figure 140: By Software Map-Market Size (USD Billion, 2023) & Growth Rate (%), 2023E-2030F
- Figure 141: By Services Map-Market Size (USD Billion, 2023) & Growth Rate (%), 2023E-2030F
- Figure 142: By Technology, Map-Market Size (USD Billion, 2023) & Growth Rate (%), 2023E-2030F
- Figure 143: By End-User, Map-Market Size (USD Billion, 2023) & Growth Rate (%), 2023E-2030F
- Figure 144: By Region, Map-Market Size (USD Billion, 2023) & Growth Rate (%), 2023E-2030F
- Figure 145: Estimated Revenues of Top Ten Players in Global Generative AI Market, in USD Billion, FY2022
Global Generative Artificial Intelligence (AI) Market size was valued at USD 6.93 billion in 2022 which is expected to reach USD 72.80 billion in 2030 with a CAGR of 35.95% for the forecast period between 2023 and 2030. Generative AI has several benefits, including increased understanding of abstract ideas, effective production of high-quality material, and enhanced identity protection. Because of this, generative AI is widely used in a variety of sectors, including information and technology (IT), robotics, entertainment, marketing, healthcare, education, banking, financial services, and insurance (BFSI). The availability of large data sets, increasing demand for deep learning, and expansion of the Internet of Things (IoT) are driving the market expansion.
Moreover, for spam identification, image compression, and processing data stages like eliminating noise from visual data to improve picture quality, generative AI uses unsupervised learning techniques. In addition, supervised learning algorithms are employed in image categorization and medical imaging. Owing to its various benefits, many companies are exploring their way into the market. For example, the release of ChatGPT generative AI by a startup named OpenAI has sparked competition among big tech giants such as Google and others to create technology that has the potential to revolutionize civilization.
The market is driven due to the integration of AI in autonomous vehicles as well. For example, Tesla is developing autonomous algorithms utilizing data from car sensors. Also, while communicating with potential clients, marketers are increasingly utilizing AI tactics, notably in the areas of data collecting and message targeting. Approximately 68% of B2B marketers adopt automation as part of their marketing strategy. Similarly, Netflix is a prime example of leveraging generative AI for personalized recommendations. The company's recommendation algorithm analyses user viewing patterns, ratings, and other data to generate personalized recommendations for each user, increasing user engagement and retention. However, the shortage of specialized labor and high implementation costs restrain the growth of this sector, and generative AI has security vulnerabilities that might lead to greater identity theft.
Rising Adoption Owing to its Advantage of Automation
One of the key benefits of generative AI is that it can automate processes like product design, content production, and data analysis that often require human input. Since Generative AI can produce content that appears to be identical to human-created output, many businesses are looking to simplify their processes and allocate more of their human resources to other projects. By integrating hyper-automation technologies such as generative AI, machine learning, and robotic process automation (RPA), etc., with improved operational procedures, organizations are expected to reduce operational expenses by 30%. Moreover, generative AI frequently outperforms humans in these activities, resulting in increased productivity and quality. According to the National Bureau of Economic Research, generative AI increases productivity by approximately 14%.
Integration of Generative AI by Big Firms
While the economic recession in the United States and Europe has clouded the prognosis for discretionary spending, the adoption of Generative AI provides room for many big companies to expand budgets with an aim to enhance productivity and provide more value to consumers. Technical budgets are expected to continue to grow as savings from generative AI adoption are reinvested in new programs.
In 2023, NVIDIA, a leading manufacturer of high-end graphics processing units (GPUs), declared to incorporate generative AI into every product, service, and business activity. Shift from general-purpose to accelerated computing will result due to the firm's trillion dollars of deployed global data center equipment. Similarly, Myntra, a fashion shopping site owned by the Flipkart group, has launched 'MyFashionGPT,' a search tool powered by ChatGPT. This latest invention enables consumers to convey their fashion demands, allowing them to select their preferences from over 2 million designs. Additionally, the company announced the debut of 'MyStylist', an AI-based stylist expert that gives users professional style suggestions and vernacular searches in 11 languages on its platform.
Government Initiatives and Regulations
Governments worldwide are actively supporting the generative AI market through a range of initiatives. Their efforts include providing funding and grants, establishing research and innovation centers, developing policies and regulations, promoting talent development and education, fostering industry collaboration and partnerships, and investing in AI infrastructure.
Ministry of Electronics and Information Technology (MeitY) launched Digital India Bhashini as an independent business division, which is based on Chat-GPT, which would assist students in learning scientific and technological topics in their own language .
Moreover, The European Union has proposed new copyright restrictions for generative AI. Companies adopting generative AI tools, such as ChatGPT, will be required to declare any copyrighted information utilized in the creation of their systems, as per an early EU agreement that pave the way for the world's first comprehensive legislation controlling the technology.
Healthcare Industry Contributing to Market Expansion
The generative AI market is primarily driven by the healthcare sector, and in the years to come, further expansion and innovation are expected to boost the market. Generative AI is expected to assist or enhance 40% of all healthcare labor hours. Medical imaging is utilizing generative AI to enhance illness diagnosis. These systems learn to recognize patterns and anomalies that are hard for human doctors to spot by examining massive datasets of medical radiographic films. Moreover, generative AI helps in building biological molecules, prosthetic limbs, and other things from scratch when used in conjunction with 3D printing, CRISPR, and other technologies. Moreover, it results in early cancer diagnosis and more efficient treatment regimens.
North America Making Significant Contributions
Owing to the presence of many market players and government support, North America has emerged as a dominant region in the adoption and development of generative AI. The United States, particularly the Silicon Valley area in California, has been at the forefront of generative AI research and development. Many leading technology companies and research institutions in the U.S., such as OpenAI, Google, Facebook, NVIDIA, and IBM have made substantial contributions to advancing generative AI technologies. In addition, the United States' National Science Foundation (NSF) announced the establishment of 11 new NSF National Artificial Intelligence Research Institutes and announced an additional USD 140 million investment for the setup which broadens the scope of these institute to cover 40 states and the District of Columbia.
Impact of COVID-19
Due to the COVID-19 pandemic, there have been several effects on the global market for generative AI. Several companies have been pressured to reduce expenses, and purchases of generative AI technology have either been postponed or abandoned. However, the need for generative AI solutions has increased significantly in several industries. For instance, the need for AI-powered medical diagnosis and treatment solutions has surged in the healthcare sector. The virus outbreak has also boosted the need for remote work solutions, which has raised the need for chatbots and virtual assistants, thereby boosting the global generative AI market.
Key Players Landscape and Outlook
Solutions for a wide range of applications, including text-to-image, image-to-image, and super-resolution, are provided by several market participants in generative AI. Market players are engaged in active acquisitions and mergers with the motive to dominate the industry. Apart from this, companies are integrating AI in pre-existing software. For instance, Microsoft Corp., a software firm based in the United States, announced Microsoft 365 Copilot , an AI assistant feature for Microsoft 365 services and apps, in March 2023. Businesses may benefit from Microsoft 365 Copilot by saving time, simplifying and automating IT operations, and improving productivity.
Table of Contents
1. Research Methodology
2. Project Scope & Definitions
3. Impact of COVID-19
4. Executive Summary
5. Voice of Customer
- 5.1. Demographics
- 5.2. Familiarity With Generative AI
- 5.3. Consumer Perception And Outlook
- 5.4. Penetration Of Generative AI
- 5.5. Generative Ai Applications
- 5.6. Factors Considered In The Adoption Of Generative Artificial Intelligence (AI)
- 5.7. Challenges With Generative AI
- 5.8. Booming Industry Adoption Of Generative AI And Adoption Timelines
- 5.9. Generative AI And Job Displacement
- 5.10. Internal And External Risks
- 5.11. Workforce Implications
- 5.12. Implementation Challenges
6. Global Generative Artificial Intelligence (AI) Market Outlook, 2016-2030F
- 6.1. Market Size & Forecast
- 6.1.1. By Value
- 6.2. By Component
- 6.2.1. Software
- 6.2.1.1. On Premises
- 6.2.1.2. Cloud Based
- 6.2.2. Services
- 6.2.2.1. Managed Service
- 6.2.2.2. Professional Service
- 6.2.1. Software
- 6.3. By Technology
- 6.3.1. Transformers
- 6.3.2. Diffusion Networks
- 6.3.3. Generative Adversarial Networks (GANs)
- 6.3.4. Variational Auto-Encoders
- 6.4. By End-user
- 6.4.1. Banking, Financial Services and Insurance (BFSI)
- 6.4.2. Gaming
- 6.4.3. ICT and Telecommunications
- 6.4.4. Healthcare
- 6.4.5. Media and Entertainment
- 6.4.6. Automotive and Transportation
- 6.4.7. Others
- 6.5. By Region
- 6.5.1. North America
- 6.5.2. Europe
- 6.5.3. South America
- 6.5.4. Asia-Pacific
- 6.5.5. Middle East and Africa
- 6.6. By Company Market Share (%), 2022
7. Global Generative Artificial Intelligence (AI) Market Outlook, By Region, 2016-2030F
- 7.1. North America
- 7.1.1. By Component
- 7.1.1.1. Software
- 7.1.1.1.1. On Premises
- 7.1.1.1.2. Cloud Based
- 7.1.1.2. Services
- 7.1.1.2.1. Managed Service
- 7.1.1.2.2. Professional Service
- 7.1.2. By Technology
- 7.1.2.1. Transformers
- 7.1.2.2. Diffusion Networks
- 7.1.2.3. Generative Adversarial Networks (GANs)
- 7.1.2.4. Variational Auto-Encoders
- 7.1.3. By End-user
- 7.1.3.1. Banking, Financial Services and Insurance (BFSI)
- 7.1.3.2. Gaming
- 7.1.3.3. ICT and Telecommunications
- 7.1.3.4. Healthcare
- 7.1.3.5. Media and Entertainment
- 7.1.3.6. Automotive and Transportation
- 7.1.3.7. Others
- 7.1.4. United States
- 7.1.4.1. By Component
- 7.1.4.1.1. Software
- 7.1.4.1.2. Services
- 7.1.4.2. By Technology
- 7.1.4.2.1. Transformers
- 7.1.4.2.2. Diffusion Networks
- 7.1.4.2.3. Generative Adversarial Networks (GANs)
- 7.1.4.2.4. Variational Auto-Encoders
- 7.1.4.3. By End-user
- 7.1.4.3.1. Banking, Financial Services and Insurance (BFSI)
- 7.1.4.3.2. Gaming
- 7.1.4.3.3. ICT and Telecommunications
- 7.1.4.3.4. Healthcare
- 7.1.4.3.5. Media and Entertainment
- 7.1.4.3.6. Automotive and Transportation
- 7.1.4.3.7. Others
- 7.1.5. Canada
- 7.1.6. Mexico
- 7.1.1. By Component
- 7.2. Europe
- 7.2.1. Germany
- 7.2.2. France
- 7.2.3. United Kingdom
- 7.2.4. Russia
- 7.2.5. Spain
- 7.3. South America
- 7.3.1. Brazil
- 7.3.2. Argentina
- 7.3.3. Colombia
- 7.4. Asia-Pacific
- 7.4.1. China
- 7.4.2. India
- 7.4.3. Japan
- 7.4.4. Australia
- 7.4.5. South Korea
- 7.5. Middle East & Africa
- 7.5.1. Saudi Arabia
- 7.5.2. UAE
- 7.5.3. South Africa
- 7.5.4. Egypt
8. Market Mapping, 2022
- 8.1. By Component
- 8.2. By Technology
- 8.3. By End-user
- 8.4. By Region
9. Macro Environment and Industry Structure
- 9.1. Supply Demand Analysis
- 9.2. Supply/Value Chain Analysis
- 9.3. PESTEL Analysis
- 9.3.1. Political Factors
- 9.3.2. Economic System
- 9.3.3. Social Implications
- 9.3.4. Technological Advancements
- 9.3.5. Environmental Impacts
- 9.3.6. Legal Compliances and Regulatory Policies (Statutory Bodies Included)
- 9.4. Porter's Five Forces Analysis
- 9.4.1. Supplier Power
- 9.4.2. Buyer Power
- 9.4.3. Substitution Threat
- 9.4.4. Threat from New Entrant
- 9.4.5. Competitive Rivalry
10. Market Dynamics
- 10.1. Growth Drivers
- 10.2. Growth Inhibitors
11. Competitive Landscape
- 11.1. Competition Matrix of Top Five Market Leaders
- 11.2. Market Revenue Analysis of Top Ten Market Leaders (in %, 2022)
- 11.3. Mergers and Acquisitions/Joint Ventures (If Applicable)
- 11.4. Patent Analysis (If Applicable)
12. Pricing Analysis
13. Case Studies
14. Key Players Outlook
- 14.1. Google LLC
- 14.1.1. Company Details
- 14.1.2. Key Management Personnel
- 14.1.3. SWOT Analysis (For Five Market Players)
- 14.1.4. Products & Services
- 14.1.5. Financials (As Reported)
- 14.1.6. Key Market Focus & Geographical Presence
- 14.1.7. Recent Developments
- 14.2. Amazon Web Services, Inc.
- 14.3. Microsoft Corporation
- 14.4. NVIDIA Corporation
- 14.5. Openai Opco, Llc
- 14.6. Adobe Inc.
- 14.7. IBM Corporation
- 14.8. Meta Platforms, Inc.
- 14.9. Genie Ai Limited
- 14.10. Synthesia Limited
Companies mentioned above DO NOT hold any order as per market share and can be changed as per information available during research work
