|
|
市場調査レポート
商品コード
1889066
Webスケール市場の追跡調査 (2025年第3四半期):過去12カ月のCAPEXが4,500億ドルに到達 - 収益は14%増加するも、前年比63%増のCAPEX急増がキャッシュフローを圧迫し負債を悪化させる。NVIDIAは優位性確保に向け急ピッチで動き、ビッグテック企業のCEOらはリスクヘッジを図りつつも成長の波に乗り続けるWebscale Market Tracker 3Q25 - 12 Month Capex Hits $450 Billion: Revenues up 14%, but 63% YoY Capex Surge Depresses Cash Flow and Worsens Debt, NVIDIA Races to Secure Dominance, Big Tech CEOs Hedge Bets but Continue Riding the Wave |
||||||
|
|||||||
|
|||||||


| Webスケール市場の追跡調査 (2025年第3四半期):過去12カ月のCAPEXが4,500億ドルに到達 - 収益は14%増加するも、前年比63%増のCAPEX急増がキャッシュフローを圧迫し負債を悪化させる。NVIDIAは優位性確保に向け急ピッチで動き、ビッグテック企業のCEOらはリスクヘッジを図りつつも成長の波に乗り続ける |
|
出版日: 2025年12月13日
発行: MTN Consulting, LLC
ページ情報: 英文
納期: 即納可能
|

概要
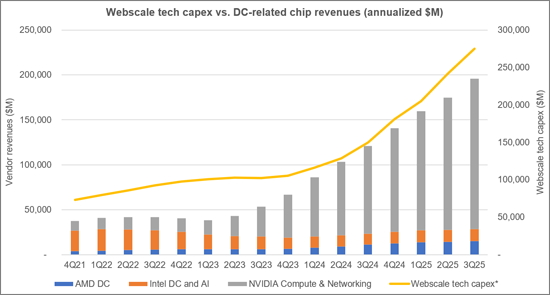
Webスケールの追跡を開始した2011年におけるCAPEX総額は年間285億米ドルでした。約7年後の2018年第2四半期、同セクターの12カ月間 (年換算) CAPEX総額は初めて1,000億米ドルを突破しました。さらに4年後の2022年第3四半期には初めて2,000億米ドルを突破し、3,000億米ドルの大台は、その2年後の2024年第4四半期に突破されました。その後2四半期を経て、4,000億米ドルに達し、2025年第3四半期には上昇を続けて4,500億米ドルに達し、5,000億米ドルの大台へ急速に近づいています。
ビジュアル
当社は1年半以上にわたり、この市場をバブルと呼んできました。これはAIを嫌っているわけでも、世界に与えるその巨大な可能性を見落としているわけでもありません。AIには驚異的な成長可能性があると同時に、下振れリスクもあります。過去30年間に数多くの技術変革を経験してきた立場から、ハイプサイクルが過熱し得ることを理解しています。また、2008-9年の金融危機が示すように、技術革新が伴わなくても投資バブルが起こり得ることを理解しています。
現在のWebスケール市場においては、実証されたビジネスモデルが乏しい一方で、異常なレベルの過熱感が蔓延しており、調整 (クラッシュ) は遅かれ早かれ起こり得る状況です。AI投資は、米国政府の補助金、大衆市場の関心 (ただし支払い意欲は極めて低い)、買い手と売り手の自己強化ループ、そして「何が得られるのか分からなくても、とにかく先行したい」と考えるAI推進派によって支えられてきました。
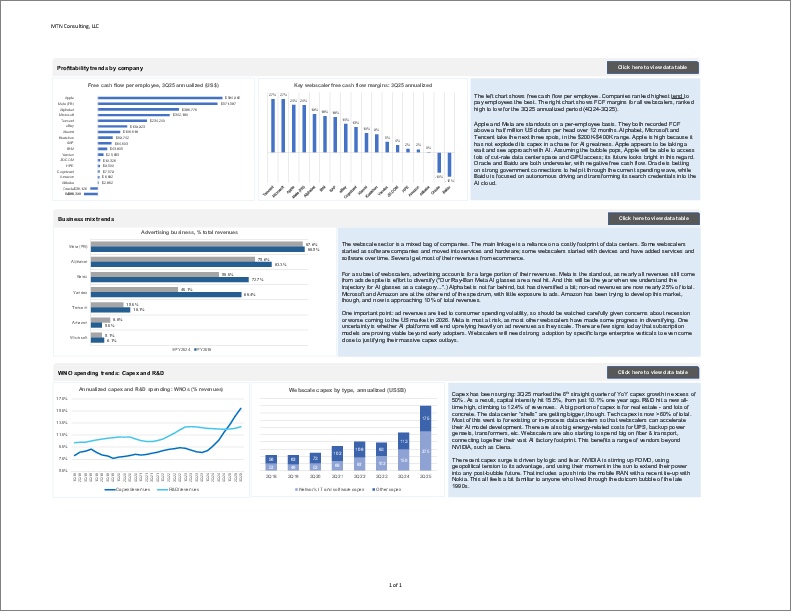
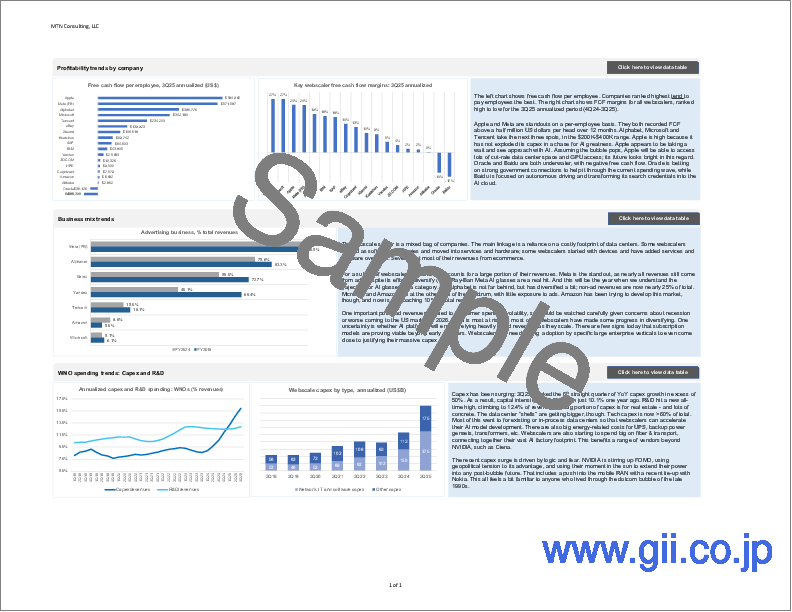
Webスケール企業によるAI駆動型インフラ拡張は記録を更新し続けています。2025年第3四半期において、Webスケールトラッカー対象25社の収益は7,490億米ドル (前年比+14.0%)、CAPEXは1,290億米ドル (同+63.0%)、研究開発費は990億米ドル (同+23.6%) に達し、現金残高は6,410億米ドル (前年比横ばい) に対し、負債は5,720億米ドル (+4.0%) でした。純有形固定資産は前年比41.1%増の1兆2,270億米ドルに急増。従業員数は458万人 (+1.9%) に達しました。
対象企業:
- 合計25社:うち21社が稼働中で公開データを報告、4社は非稼働 (ChinaCache)、非公開化 (Twitter)、または他社傘下 (AltabaとLinkedIn)
- 稼働中の21社:Alibaba、Alphabet、Amazon、Apple、Baidu、Cognizant、CoreWeave、eBay、Fujitsu、HPE、IBM、JD.COM、Kuaishou、Meta (FB)、Microsoft、Nebius、Oracle、SAP、Tencent、Xiaomi、Yandex
- 2025年第2四半期には、Kuaishou、Nebius、Xiaomiの3社が新たに追加され、CoreWeaveは2024年第4四半期に追加
- 対象ベンダー:AMD、Arista、Ciena、Cisco、HPE、Infinera、Intel、Juniper、Nokia、NVIDIA、Wiwynn
当レポートでは、世界の主要Webスケール企業の動向を追跡調査し、収益、設備投資、雇用などの各種データをまとめています。

