
|
市場調査レポート
商品コード
1435899
減粘剤:市場シェア分析、業界動向と統計、成長予測(2024~2029年)Viscosity Reducing Agents - Market Share Analysis, Industry Trends & Statistics, Growth Forecasts (2024 - 2029) |
||||||
カスタマイズ可能
適宜更新あり
|
|||||||
| 減粘剤:市場シェア分析、業界動向と統計、成長予測(2024~2029年) |
|
出版日: 2024年02月15日
発行: Mordor Intelligence
ページ情報: 英文 120 Pages
納期: 2~3営業日
|

全表示
- 概要
- 目次
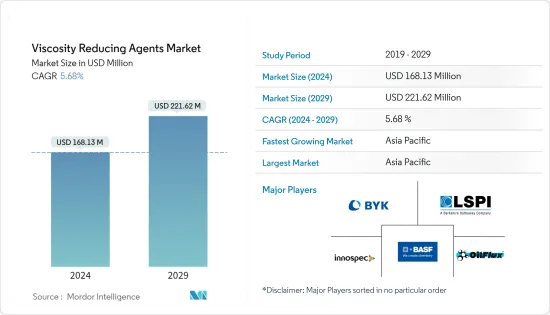
減粘剤市場規模は2024年に1億6,813万米ドルと推定され、2029年までに2億2,162万米ドルに達すると予測されており、予測期間(2024年から2029年)中に5.68%のCAGRで成長します。
石油・ガス業界からの需要の増加と他の推進力が市場を牽引しています。その一方で、厳しい環境規制と新型コロナウイルス感染症(COVID-19)の流行により生じた不利な条件が市場の成長を妨げています。
主なハイライト
- 減粘剤市場は、石油・ガス業界からの需要の増加により、予測期間中に成長すると予想
- アジア太平洋地域は、中国やインドなどの国々からの最大の消費量による世界中の市場を独占へ
減粘剤市場動向
石油・ガス業界からの需要の拡大
- 減粘剤は石油・ガス産業で広く使用されており、予測期間中に急速に成長すると予想されます。
- 粘度低減剤は、石油およびガス産業では抗力低減剤と呼ばれることが多く、原油の輸送および処理中のパイプライン内の乱流を減らし、摩擦エネルギー損失を低減して流れを改善します。
- さらに、これらは長鎖炭化水素であり、同じ流量の圧力降下を減少させ、それによって同じ量のエネルギーを使用してパイプラインの流量を増加させます。
- 減粘剤は、原油製品、最終製品、アスファルト原油、水性システム、および多相システムの自由流動に役立ちます。世界の石油およびその他の石油ベースの液体は、2018年の日量9,997万バレルから2019年には1億75万バレルであり、年間約2億8,470万バレルの増加を示しており、予測期間中に増加すると予想されています。
- しかし、COVID-19感染症の発生により前例のない状況が生じたため、各国でのロックダウンや旅行、観光、eコマース、その他の活動の停止により、石油とガスの消費は日量少なくとも500万バレル減少すると予想されています。レストランは2020年の消費に影響を与える可能性が高いです。
- 都市化の進展と石油ベースの製品の需要の増加により、予測期間中に減粘剤の市場が牽引されると予想されます。
アジア太平洋地域が市場を独占
- アジア太平洋地域は、中国やインドなどの国々からの需要の増加により、予測期間中に減粘剤市場を独占すると予想されます。
- インドや中国などの国での原油消費量の増加が、予測期間中に市場を牽引すると予想されます。世界的には、インドは中国と米国に次ぐ原油と石油製品の消費国であり、アジアでは中国に次ぐ第二位の製油所を有しています。 2019年のインドの石油輸入額は約1,120億米ドルで、2018会計年度から27%増加しました。輸送部門からの消費量の増加と住宅および商業施設からの液化石油ガスが市場を牽引すると予想されます。
- 中国の原油消費量は、2018年の日量約1,350万バレルから、2019年には日量1,450万バレルとなっています。これに加えて、中国の製油所の能力は2019年に日量100万バレル増加しています。中国の消費量の増加は、市場を牽引すると期待されています。
- 塗料およびコーティングでは、分散剤が固体を解膠し、それによって分散液の粘度を低下させ、分散された粉末材料の配合量を増加させます。分散段階は最もエネルギーを消費する段階であり、分散剤は安定性を高め、エネルギー消費を最適化するのに役立ちます。成長する塗料とコーティングが市場を牽引すると予想されます。
- 前述の要因は、政府の支援と相まって、予測期間中のアジア太平洋の減粘剤市場の需要の増加に寄与しています。
減粘剤業界の概要
世界の減粘剤市場は部分的に細分化されており、プレーヤーは市場のわずかなシェアを占めています。 BYK-CHEMIE GMBH、LiquidPower Specialty Products Inc.、Innospec、Oil Flux、BASF SEなどの企業はほとんどありません。
その他の特典
- エクセル形式の市場予測(ME)シート
- 3か月のアナリストサポート
目次
第1章 イントロダクション
- 調査の前提条件
- 調査範囲
第2章 調査手法
第3章 エグゼクティブサマリー
第4章 市場力学
- 促進要因
- 石油・ガス業界からの需要の拡大
- その他の 促進要因
- 抑制要因
- 厳しい環境規制
- COVID-19感染症の流行による不利な状況
- 業界のバリューチェーン分析
- ポーターのファイブフォース分析
- 供給企業の交渉力
- 消費者の交渉力
- 新規参入業者の脅威
- 代替製品やサービスの脅威
- 競合の程度
第5章 市場セグメンテーション
- タイプ
- 抵抗低減剤
- 界面活性剤と添加剤
- 分散剤
- その他
- エンドユーザー産業
- 石油ガス
- 塗料とコーティング
- プラスチック
- その他の製造業
- 地域
- アジア太平洋
- 中国
- インド
- 日本
- 韓国
- その他アジア太平洋地域
- 北米
- 米国
- カナダ
- メキシコ
- 欧州
- ドイツ
- 英国
- イタリア
- フランス
- その他欧州
- 南米
- ブラジル
- アルゼンチン
- その他南米
- 中東とアフリカ
- サウジアラビア
- 南アフリカ
- その他の中中東とアフリカ
- アジア太平洋
第6章 競合情勢
- 合併と買収、合弁事業、コラボレーション、および契約
- 市場シェア分析
- 有力企業が採用した戦略
- 企業プロファイル
- Alberta Treating Chemicals LTD.
- ARKEMA Group
- Baker Hughes Company
- BASF SE
- BYK-CHEMIE GMBH
- CHINAFLOC
- Ecolab
- Innospec
- LiquidPower Specialty Products Inc.
- NuGenTecx
- Oil Flux
- Qflo
- The Lubrizol Corporation
第7章 市場機会と将来の動向
- 新興国による需要の増大
The Viscosity Reducing Agents Market size is estimated at USD 168.13 million in 2024, and is expected to reach USD 221.62 million by 2029, growing at a CAGR of 5.68% during the forecast period (2024-2029).
Growing demand from the oil & gas industry along with other drives are driving the market. On the flip side, stringent environmental regulations coupled with unfavorable conditions arising due to the COVID-19 outbreak are hindering the market growth.
Key Highlights
- The Viscosity Reducing Agents market is expected to grow during the forecast period owing to the growing demand from the oil & gas industry.
- Asia-Pacific region to dominate the market across the globe with the largest consumption from countries such as China and India.
Viscosity Reducing Agents Market Trends
Growing Demand from the Oil & Gas Industry
- Viscosity reducing agents are widely used in oil & gas industries and is expected to grow rapidly during the forecast period.
- Viscosity reducing agents are often referred to as drag reducing agents in oil & gas industries, they improve the flow by reducing the frictional energy losses by decreasing the turbulence in the pipeline during crude oil transportation, and processing.
- Moreover, they are long-chain hydrocarbons that decrease the pressure drop for the same flow rate and thereby increase the pipeline flow using the same amount of energy.
- Viscosity reducing agents help in the free-flowing of crude oil products, finished products, asphalt-crude, aqueous systems, and multiphase systems. The global petroleum and other petroleum-based liquids are at 100.75 million barrels per day in 2019 from 99.97 million barrels per day in 2018, which shows an increase of about 284.7 million barrels per year and is expected to grow during the forecast period.
- However, due to unprecedented conditions arisen due to the COVID-19 outbreak the consumption of oil & gas will be down by at least 5 million barrels per day due to lockdown in various countries and shut down of travel, tourism, e-commerce, and restaurants are likely to affect the consumption in 2020.
- The growing urbanization and increasing demand for petroleum-based products are expected to drive the market for the viscosity reducing agents during the forecast period.
Asia-Pacific Region to Dominate the Market
- The Asia-Pacific region is expected to dominate the market for viscosity reducing agents during the forecast period due to an increase in demand from countries like China and India.
- The growing crude-oil consumption in countries like India and China is expected to drive the market during the forecast period. Globally, India is the third-largest consumer of crude oil and petroleum products after China and the United States, with the second-largest refinery in Asia after China. The Indian petroleum import value is about USD 112 billion in 2019 with a 27% growth from the financial year 2018. The growing consumption from the transportation sector, and liquified petroleum gas from residential and commercial complexes are expected to drive the market.
- In China, crude oil consumption is at 14.5 million barrels per day in 2019 from about 13.5 million barrels per day in 2018. In addition to that, China's refinery capacity is increased by 1 million barrels per day in 2019. The growing consumption in China is expected to drive the market.
- In paints & coatings, the dispersing agents deflocculates solids, thereby reducing the viscosity of dispersion and increasing the loading of dispersed powder material. The dispersing phase is the most energy consuming stage and dispersing agents help in increasing stability and optimize energy consumption. The growing paints and coatings are expected to drive the market.
- The aforementioned factors, coupled with government support, are contributing to the increasing demand for viscosity reducing agents market in the Asia-Pacific during the forecast period.
Viscosity Reducing Agents Industry Overview
The global viscosity reducing agents market is partially fragmented with players accounting for a marginal share of the market. Few companies include BYK-CHEMIE GMBH, LiquidPower Specialty Products Inc., Innospec, Oil Flux, and BASF SE.
Additional Benefits:
- The market estimate (ME) sheet in Excel format
- 3 months of analyst support
TABLE OF CONTENTS
1 INTRODUCTION
- 1.1 Study Assumptions
- 1.2 Scope of the Study
2 RESEARCH METHODOLOGY
3 EXECUTIVE SUMMARY
4 MARKET DYNAMICS
- 4.1 Drivers
- 4.1.1 Growing Demand From the Oil & Gas Industry
- 4.1.2 Other Drivers
- 4.2 Restraints
- 4.2.1 Stringent Environmental Regulations
- 4.2.2 Unfavourable Conditions Arising Due to the COVID-19 Outbreak
- 4.3 Industry Value Chain Analysis
- 4.4 Porters Five Forces Analysis
- 4.4.1 Bargaining Power of Suppliers
- 4.4.2 Bargaining Power of Consumers
- 4.4.3 Threat of New Entrants
- 4.4.4 Threat of Substitute Products and Services
- 4.4.5 Degree of Competition
5 MARKET SEGMENTATION
- 5.1 Type
- 5.1.1 Drag Reducing Agents
- 5.1.2 Surfactants & Additives
- 5.1.3 Dispersing Agents
- 5.1.4 Others
- 5.2 End-user Industry
- 5.2.1 Oil & Gas
- 5.2.2 Paints & Coatings
- 5.2.3 Plastics
- 5.2.4 Other Manufacturing Industries
- 5.3 Geography
- 5.3.1 Asia-Pacific
- 5.3.1.1 China
- 5.3.1.2 India
- 5.3.1.3 Japan
- 5.3.1.4 South Korea
- 5.3.1.5 Rest of Asia-Pacific
- 5.3.2 North America
- 5.3.2.1 United States
- 5.3.2.2 Canada
- 5.3.2.3 Mexico
- 5.3.3 Europe
- 5.3.3.1 Germany
- 5.3.3.2 United Kingdom
- 5.3.3.3 Italy
- 5.3.3.4 France
- 5.3.3.5 Rest of Europe
- 5.3.4 South America
- 5.3.4.1 Brazil
- 5.3.4.2 Argentina
- 5.3.4.3 Rest of South America
- 5.3.5 Middle-East and Africa
- 5.3.5.1 Saudi Arabia
- 5.3.5.2 South Africa
- 5.3.5.3 Rest of Middle-East and Africa
- 5.3.1 Asia-Pacific
6 COMPETITIVE LANDSCAPE
- 6.1 Mergers & Acquisitions, Joint Ventures, Collaborations, and Agreements
- 6.2 Market Share Analysis**
- 6.3 Strategies Adopted by Leading Players
- 6.4 Company Profiles
- 6.4.1 Alberta Treating Chemicals LTD.
- 6.4.2 ARKEMA Group
- 6.4.3 Baker Hughes Company
- 6.4.4 BASF SE
- 6.4.5 BYK-CHEMIE GMBH
- 6.4.6 CHINAFLOC
- 6.4.7 Ecolab
- 6.4.8 Innospec
- 6.4.9 LiquidPower Specialty Products Inc.
- 6.4.10 NuGenTecx
- 6.4.11 Oil Flux
- 6.4.12 Qflo
- 6.4.13 The Lubrizol Corporation
7 MARKET OPPORTUNITIES AND FUTURE TRENDS
- 7.1 Growing Demand Due from Emerging Economies

