
|
市場調査レポート
商品コード
1851873
レブリン酸:市場シェア分析、産業動向、統計、成長予測(2025年~2030年)Levulinic Acid - Market Share Analysis, Industry Trends & Statistics, Growth Forecasts (2025 - 2030) |
||||||
カスタマイズ可能
適宜更新あり
|
|||||||
| レブリン酸:市場シェア分析、産業動向、統計、成長予測(2025年~2030年) |
|
出版日: 2025年07月15日
発行: Mordor Intelligence
ページ情報: 英文 120 Pages
納期: 2~3営業日
|

概要
レブリン酸の市場規模は2025年に22.29キロトンと推計され、2030年には30.01キロトンに達すると予測され、予測期間(2025-2030年)のCAGRは6.13%です。
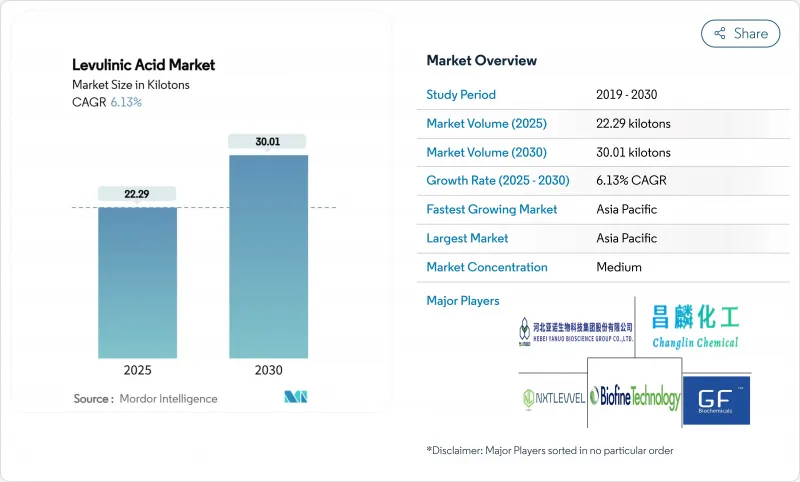
EUの「持続可能性のための化学物質戦略」や米国連邦の「持続可能な化学物質計画」といった規制プログラムが、バリューチェーンの脱炭素化に役立つバイオベース中間体の採用をメーカーに迫る中、需要が拡大しています。レブリン酸は、クリーンラベルの嗜好を満たす天然由来の防腐剤として機能するため、化粧品とパーソナルケアは依然として最大の販売先です。持続可能な航空燃料のためのガンマーバレロラクトン経路を支える化合物であるため、燃料および燃料添加剤メーカーが最も早く購入を拡大しています。酸加水分解技術が引き続き設備容量の大半を占めているが、単価の削減と触媒の不活性化の問題を緩和するために、酵素と微生物によるルートが新たな投資を引き寄せています。アジア太平洋は、豊富なバイオマス、支持的な政策、密集した化学製造基盤により、生産量と成長率の両面でリードを保っているが、イタリアと北米の新規プロジェクトは、レブリン酸市場全体で生産能力が徐々に強化されていることを示しています。
世界のレブリン酸市場の動向と洞察
バイオベースの溶剤と可塑剤に対する需要の高まり
フタル酸系可塑剤の代替を求める規制の圧力が、レブリン酸エステルをポリマーフィルムや硬質パッケージングに押し上げつつあります。最近の試験では、従来のクエン酸系可塑剤に代わってレブリン酸エステルを20wt%使用した場合、ポリ乳酸の破断伸度が546%になり、バイオ含有率を高めながら性能も同等になりました。EUの化学物質戦略では、バイオベースの可塑剤を必須用途の基準で優先的に使用するよう定めており、ブランドオーナーにレブリン酸の誘導体を指定するよう促しています。確立された触媒サプライヤーは、エステル化のエネルギー需要を20%近く下げ、石油ルートとの価格差を縮めています。消費財メーカーは、2030年までにバイオ原料の投入量を少なくとも25%に引き上げることを目標としており、レブリン酸市場全体の新しい生産能力契約を支える前方購買コミットメントを作り出しています。
低炭素燃料添加剤としてのレブリン酸誘導体の使用拡大
レブリン酸をガンマーバレロラクトンに変換することで、持続可能な航空燃料(SAF)の中間体が提供され、統合バイオリファイナリーではガソリン換算ガロン当たり3.15米ドル付近の損益分岐生産コストに達することができます。2024年に開発された触媒は、2-メチルテトラヒドロフランの収率87.6%を達成し、これはオクタン価を向上させ、ライフサイクルの炭素強度を低下させる混合成分です。世界のバイオ燃料消費量は2023年に1億700万トンに増加し、投資額は130億米ドルを超えました。一方、航空利害関係者は2070年までにSAFの35%普及を約束し、レブリン酸誘導体の長期引取契約を先鋭化させました。現在、試験的な酵素ルートでは、同一のバイオマス投入から前駆体収量が10倍増加するとしており、さらなるコスト削減の可能性を示唆しています。
高い生産コストと石油代替物
レブリン酸は、バイオマス収量が控えめであり、下流の精製に資本集約的であるため、既存の石油化学中間体よりも価格が高いままです。化学セクターの回復が弱く、米国の生産高は2024年にわずか1.5%しか伸びなかったため、バイオプレミアムを支払うバイヤーの能力は限られています。ポリマーと溶剤では、レブリン酸市場は、資産償却をとっくに終えたメガスケールクラッカーで生産される原料と競合し、コスト格差を拡大します。酸加水分解プラントの触媒の汚れは、メンテナンス費用とダウンタイムを増加させ、マージンを侵食します。その結果、一部のバルク・ユーザーは、第2世代のプロセスがより低い変動コストを実現するまで、代替計画を延期しています。
セグメント分析
酸加水分解は、数十年にわたる商業的経験と70~80%の理論収率を達成するBiofineプロセスを活用することで、2024年のレブリン酸市場で54.65%のシェアを維持した。現在のプラントのほとんどは、希硫酸を使用してセルロースを中間糖に変換し、レブリン酸を製造しています。しかし、触媒の腐敗とフミンの廃棄は、特に原料の水分が変動する場合には、利幅を圧迫する経常的なコストとなります。新興の酵素・微生物法は、バイオマス当たりの前駆体収率が10倍高く、ユーティリティの需要も減少するため、CAGRは6.81%となります。オランダとカナダの新興企業が2025年にシリーズBの資金を獲得し、パルプ工場のサイドストリームに接続するデモ装置の規模を拡大しています。
酸加水分解のプレーヤーは、滞留時間を短縮しフミンの蓄積を抑えるために、インライン分離を備えた連続流リアクターに投資しています。一方、隣の触媒水素化装置は、社内のレブリン酸をガンマーバレロラクトンや2-メチルテトラヒドロフランにアップグレードし、ドロップイン燃料添加剤のマージンを獲得しています。酵素ルートは依然として酵素コストと安定性のハードルに直面しているが、プラットフォーム・サプライヤーは、タンパク質工学のブレークスルー後、酵素負荷が2桁減少したと報告しています。テクノロジー・ミックスは、確立されたプロセスが現在の生産量を確保する一方で、バイオテクノロジーの革新がレブリン酸市場の次の生産性の飛躍を描く移行期を反映しています。
レブリン酸市場レポートは、生産技術(酸加水分解、バイオファインプロセス、その他)、グレード(工業グレード、医薬品グレード、食品グレード)、エンドユーザー産業(化粧品・パーソナルケア、医薬品、その他)、地域(アジア太平洋、北米、欧州、南米、中東・アフリカ)で区分されています。市場予測は数量(トン)で提供されます。
地域別分析
アジア太平洋は2024年の数量シェアで41.29%を占め、2030年までのCAGRは6.58%と予測され、中国のバイオマス余剰と国のカーボンニュートラル目標によって支えられています。省からの補助金は、バイオケミカル・プロジェクトの資本支出の最大30%をカバーし、山東省と広西チワン族自治区での新設プラントに拍車をかけています。日本の木質エタノールの商業生産計画は、レブリン酸の共同生産を下支えし、グジャラート州を中心とするインドの特殊化学品生産能力の拡大は、川下への新たな牽引力を生み出しています。地域的な供給逼迫が価格設定を堅調に保ち、現地投資家に輸入ルート短縮を促します。
北米は、連邦政府による税額控除や融資保証がバイオリファイナリーの改修に拍車をかけており、成熟しつつもチャンスに富んだ基盤を持っています。カナダのクリーン燃料基準は、精製業者に低炭素原料の採用を促し、レブリン酸由来のガンマーバレロラクトンの契約を後押ししています。メキシコのベラクルス州の化学産業クラスターは、トウモロコシの茎葉を手頃な原料として注目しているが、ロジスティクスと農地残渣管理はまだ規模を制限しています。生産者がプロセスの効率を高め、長期的なバイオマス引取を確保するにつれて、市場は一桁台半ばの成長を示します。
欧州は、持続可能な化学物質に関する厳格な法規制により、強力な足場を保っています。イタリアでは年産1万トンの世界最大の単一レブリン酸装置が稼動し、工業的実現可能性を実証しています。EUのFit-for-55パッケージは、輸送用燃料とプラスチックの需要を加速し、Horizon Europeの助成金は、コスト面でアジアを上回ることを目指す触媒研究に資金を提供します。ブラジルのサトウキビバガスと南アフリカの森林残渣は、十分な原料を供給しているが、投資決定は、政治的安定と、レブリン酸市場向けにこれらの埋蔵資源を利用するためのインフラにかかっています。
その他の特典:
- エクセル形式の市場予測(ME)シート
- 3ヶ月間のアナリストサポート
よくあるご質問
目次
第1章 イントロダクション
- 調査の前提条件と市場の定義
- 調査範囲
第2章 調査手法
第3章 エグゼクティブサマリー
第4章 市場情勢
- 市場概要
- 市場促進要因
- バイオベース溶剤と可塑剤の需要増加
- デリバティブの利用拡大
- 化粧品とパーソナルケアにおける天然保存料としての採用増加
- 従来型肥料の代替品としての利用拡大
- パルプ・製紙工場とのサーキュラー・エコノミー・パートナーシップ
- 市場抑制要因
- 高い生産コスト対石油代替品
- 限られた商業規模の製造能力
- 常用反応器におけるフミンビルドアップからの触媒失活
- バリューチェーン分析
- ポーターのファイブフォース
- 供給企業の交渉力
- 買い手の交渉力
- 新規参入業者の脅威
- 代替品の脅威
- 競合の程度
第5章 市場規模と成長予測
- 生産技術別
- 酸加水分解
- バイオファインプロセス
- 触媒水素化ルート
- 新たなバイオテクノロジー・ルート
- グレード別
- 工業用グレード
- 医薬品グレード
- 食品グレード
- エンドユーザー業界別
- 化粧品とパーソナルケア
- 医薬品
- ポリマー・可塑剤
- 燃料および燃料添加剤
- 香料
- その他のエンドユーザー業界(農業、肥料など)
- 地域別
- アジア太平洋地域
- 中国
- 日本
- インド
- 韓国
- ASEAN諸国
- その他アジア太平洋地域
- 北米
- 米国
- カナダ
- メキシコ
- 欧州
- ドイツ
- 英国
- フランス
- イタリア
- スペイン
- ロシア
- 北欧諸国
- その他欧州地域
- 南米
- ブラジル
- アルゼンチン
- その他南米
- 中東・アフリカ
- サウジアラビア
- 南アフリカ
- その他の中東・アフリカ
- アジア太平洋地域
第6章 競合情勢
- 市場集中度
- 戦略的動向
- 市場シェア(%)/ランキング分析
- 企業プロファイル
- AK Scientific Inc.
- Avantium
- Biofine Technology, llc.
- GFBiochemicals
- GODAVARI BIOREFINERIES LTD.
- Hangzhou Aromalake Tech Co., Ltd.
- Hebei Yanuo Bioscience Group Co., Ltd
- LangFang Hawk Technology and Development Co,Ltd.
- Merck KGaA(Sigma-Aldrich)
- NXTLEVVEL Biochem
- Shandong Xinhua Pharma
- Thermo Fisher Scientific Inc.
- Tokyo Chemical Industry Co,. Ltd.
- Zibo Changlin Chemical Industry Co., Ltd.

