
|
市場調査レポート
商品コード
1639385
タンタル-市場シェア分析、産業動向・統計、成長予測(2025年~2030年)Tantalum - Market Share Analysis, Industry Trends & Statistics, Growth Forecasts (2025 - 2030) |
||||||
カスタマイズ可能
適宜更新あり
|
|||||||
| タンタル-市場シェア分析、産業動向・統計、成長予測(2025年~2030年) |
|
出版日: 2025年01月05日
発行: Mordor Intelligence
ページ情報: 英文 180 Pages
納期: 2~3営業日
|

全表示
- 概要
- 目次
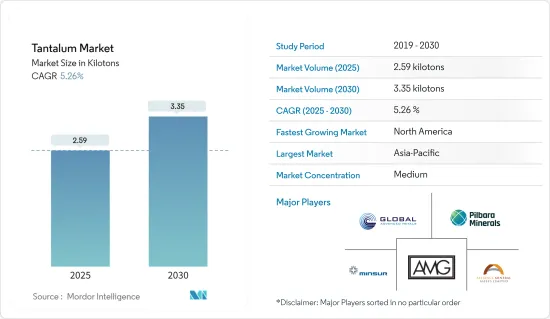
タンタル市場規模は2025年に2.59キロトンと推定され、予測期間(2025~2030年)のCAGRは5.26%で、2030年には3.35キロトンに達すると予測されています。
COVID-19の大流行は、エンドユーザー産業が大きな影響を受けたため、世界的にタンタル市場に打撃を与えました。しかし、電気セグメントの成長は産業で改善しており、市場開拓を支援します。タンタル市場はパンデミックから回復し、大きく成長しています。
主要ハイライト
- 短期的には、電気・電子産業の成長と航空・ガスタービンにおけるタンタル合金の広範な使用が、予測期間を通じて市場成長を促進すると予測されます。
- 固体コンデンサをポリマータンタルコンデンサに置き換えることは、調査された市場にとって好機として作用すると予想されます。
- その反面、タンタルの有害性やエンドユーザー産業からの需要の減少が市場の成長を妨げています。
- アジア太平洋は世界市場を独占しており、中国や韓国などの国からの消費が最も多いです。
タンタル市場の動向
コンデンサセグメントが大きなシェアを占めると予測
- タンタル電解コンデンサは、陽極材料としてタンタル(Ta)金属を使用しており、陽極構造の違いにより箔タイプとタンタル粉末焼結タイプに分けられます。タンタル粉末焼結タンタルコンデンサの中でも、電解質の違いにより固体電解質と非固体電解質のタンタルコンデンサがあります。タンタル電解コンデンサの外殻にはCAと記されていますが、回路上の記号は他の電解コンデンサと同じです。
- タンタル電解コンデンサは、通信、コンピュータ、航空宇宙、軍事、先端電子システム、携帯用デジタル製品などのセグメントで広く使用されています。
- タンタル電解コンデンサは、非常に微細なタンタル粉末で作られており、タンタル酸化皮膜の誘電率はアルミナ酸化皮膜の誘電率よりも高いため、単位体積当たりの静電容量が大きいです。
- タンタル電解コンデンサは-50~100℃の温度で正常に動作します。アルミ電解コンデンサはこの範囲で動作可能ですが、電気的性能はタンタル電解コンデンサほど良くありません。
- タンタル電解コンデンサの酸化タンタル皮膜は耐食性に優れているだけでなく、長期間にわたって良好な性能を維持します。
- 電子情報技術産業協会(JEITA)によると、2021年の世界のコンピュータ・情報端末機器輸出額は3,780億9,700万円(約28億6,295万米ドル)に達し、成長率は106.5%。これは今後数年でさらに伸びると予想され、それによってタンタル市場の需要が高まっている
- さらにZVEIによると、2022年の世界の民生用電子機器市場は5%の成長が見込まれています。2022年には、照明セグメントが再び6%増の1,385億ユーロ(約1,470億8,000万米ドル)とやや高い成長を遂げる一方、民生用電子機器(2,874億ユーロ(約3,052億米ドル))と民生用電子機器製品(2,687億ユーロ(約2,853億4,000万米ドル))はそれぞれ5%増となる可能性があります。この成長により、民生用電子機器アプリケーションからのタンタルベースコンデンサ需要が高まると予想されます。
アジア太平洋が市場を独占する
- アジア太平洋は、中国や韓国のような国からの消費の増加により、タンタルの消費のための主要な市場でした。電子機器、航空宇宙、医療機器などのエンドユーザー産業からの需要の増加が、主にこの地域を牽引しています。
- 中国は世界のタンタルの主要消費国の一つです。その産業からの需要の増加により、調査された市場は今後数年間で中国で成長すると予想されます。中国は世界最大の電子機器生産基地です。スマートフォン、テレビ、電線、ケーブル、ポータブルコンピューティングデバイス、ゲームシステム、その他のパーソナルデバイスなどの電子製品は、エレクトロニクスセグメントで最も高い成長を記録しました。中国はエレクトロニクスの国内需要に応えるだけでなく、エレクトロニクス生産物を他国に輸出しており、また世界有数の各種部品メーカーでもあります。
- 中国は最大の航空機メーカーの1つであり、国内航空旅客市場でも最大の市場の1つです。同国の民間航空機保有数は過去5年間、着実に増加しています。さらに、中国の航空会社は今後20年間で約7690機の航空機の新規購入を計画しており、その評価額は約1兆2,000億米ドルにのぼります。Boeingは、中国国内の平均RPK(Revenue Passenger Kilometer)成長率は今後10年間、年率6.1%で増加すると推定しています。そのため、コンデンサやエンジンタービンブレードの航空宇宙用途の需要が増加しており、調査対象市場の需要をさらに押し上げると予想されます。
- インドは2025年までにデジタル経済が1兆米ドルに達すると予想されており、インドの電子システム設計・製造(ESDM)部門は2025年までに1,000億米ドル以上の経済価値を生み出すと期待されています。Make in India、National Policy of Electronics、Net Zero Imports in Electronics、Zero Defect Zero Effectといったいくつかの施策は、国内製造業の成長、輸入依存度の低下、輸出と製造業の活性化へのコミットメントを提示しています。
- 政府は、インドにおけるエレクトロニクス生産を促進するため、生産連動奨励金(Production Linked Incentive:PLI)と並んで、電子部品・半導体製造促進スキーム(Promotion of Manufacturing of Electronic Components and Semiconductors:SPECS)と改良型エレクトロニクス製造クラスター(EMC 2.0)スキームという新しいスキームを立ち上げました。PLIスキームによると、政府は、メーカーがインドでの生産を増やすと、5年間で55億米ドルのインセンティブを提供するようです。これにより、インドでの電子機器生産が促進される可能性が高いです。
- 韓国もまた、アジア太平洋における重要な輸出経済国のひとつです。韓国のエレクトロニクス産業は、生産量で世界第3位、消費量で世界第5位です。2021年、エレクトロニクスは2,007億9,000万米ドルと評価されます。
タンタル産業概要
タンタル市場は、タンタル採掘企業という点で部分的に統合されています。主要企業(順不同)には、Global Advanced Metals Pty Ltd、AMG Advanced Metallurgical Group NV、Pilbara Minerals、Alliance Mineral Assets Limited、Minsur(Mining Taboca)などがあります。
その他の特典
- エクセル形式の市場予測(ME)シート
- 3ヶ月間のアナリストサポート
目次
第1章 イントロダクション
- 調査の前提条件
- 調査範囲
第2章 調査手法
第3章 エグゼクティブサマリー
第4章 市場力学
- 促進要因
- 電気・電子産業からの需要増加
- 航空・ガスタービンにおけるタンタル合金の使用拡大
- 抑制要因
- タンタルの有害作用とエンドユーザー産業からの需要減少
- その他の抑制要因
- 産業バリューチェーン分析
- ポーターのファイブフォース分析
- 供給企業の交渉力
- 消費者の交渉力
- 新規参入業者の脅威
- 代替品の脅威
- 競合の程度
- 輸出入動向
- 技術スナップショット
- 価格指数
- 規制施策分析
第5章 市場セグメンテーション(市場規模:数量ベース)
- 製品
- 金属
- カーバイド
- 粉末
- 合金
- その他の製品形態
- 用途
- コンデンサ
- 半導体
- エンジンタービンブレード
- 化学処理装置
- 医療機器
- その他の用途(弾道、切削工具、光学用途を含む)
- 地域
- 生産分析
- 米国
- オーストラリア
- ブラジル
- 中国
- コンゴ
- エチオピア
- ナイジェリア
- ルワンダ
- その他の国
- 消費分析
- アジア太平洋
- 中国
- インド
- 日本
- 韓国
- その他のアジア太平洋
- 北米
- 米国
- カナダ
- メキシコ
- 欧州
- ドイツ
- 英国
- イタリア
- フランス
- その他の欧州
- 南米
- ブラジル
- アルゼンチン
- その他の南米
- 中東・アフリカ
- サウジアラビア
- その他の中東・アフリカ
- 生産分析
第6章 競合情勢
- M&A、合弁事業、提携、協定
- 市場シェア(%)**/ランキング分析
- 主要企業の戦略
- 企業プロファイル(概要、財務、製品・サービス、最近の動向)
- AMG Advanced Metallurgical Group NV
- Alliance Mineral Assets Limited
- China Minmetals Corporation
- CNMC Ningxia Orient Group Co. Ltd
- Ethiopian Mineral Development Share Company
- Global Advanced Metals Pty Ltd
- Jiangxi Tungsten Industry Group Co. Ltd
- Minsur(Mining Taboca)
- Pilbara Minerals
- Piran Resources Limited(Pella Resources Limited)
- Tantalex Resources Corporation
- Tantec GmbH
- Techmet(KEMET GROUP)
- Taniobis GmbH
第7章 市場機会と今後の動向
- 固体コンデンサから高分子タンタルコンデンサへの置き換え
- その他の機会
The Tantalum Market size is estimated at 2.59 kilotons in 2025, and is expected to reach 3.35 kilotons by 2030, at a CAGR of 5.26% during the forecast period (2025-2030).
The COVID-19 pandemic hurt the tantalum market globally as end-user industries were significantly affected. However, growth in the electrical segment is improving in the industry, which will assist the market development. The tantalum market has recovered from the pandemic and is growing significantly.
Key Highlights
- Over the short term, the growth of the electrical and electronic industry and the extensive usage of tantalum alloys in aviation and gas turbines are projected to fuel market growth throughout the forecast period.
- Replacing solid capacitors with polymer tantalum capacitors is expected to act as an opportunity for the studied market.
- On the flip side, the harmful effects of tantalum and the decrease in demand from end-user industries are hindering the market's growth.
- Asia-Pacific dominates the market across the world, with the largest consumption from countries such as China and South Korea.
Tantalum Market Trends
Capacitor Segment is Anticipated to Hold a Significant Share
- A tantalum electrolytic capacitor is made of tantalum (Ta) metal as anode material, which can be divided into foil and tantalum powder sintered types according to different anode structures. Among tantalum powder sintered tantalum capacitors, there are tantalum capacitors with solid and non-solid electrolytes due to different electrolytes. The shell of tantalum electrolytic capacitors is marked with CA, but the symbol in the circuit is the same as that of other electrolytic capacitors.
- Tantalum electrolytic capacitors are widely used in communications, computers, aerospace, and military, as well as advanced electronic systems, portable digital products, and other fields.
- Since tantalum electrolytic capacitors are made of very fine tantalum powder, and the dielectric constant of the tantalum oxide film is higher than that of the alumina oxide film, the capacitance per unit volume of tantalum electrolytic capacitors is large.
- Tantalum electrolytic capacitor can work normally at the temperature of -50 ~100 . Although the aluminum electrolytic capacitor can work in this range, its electrical performance is not as good as that of the tantalum electrolytic capacitor.
- Tantalum oxide film in tantalum electrolytic capacitors is not only corrosion-resistant but also maintains good performance for a long time.
- According to the Japan Electronics and Information Technology Industries Association (JEITA), the global computers and information terminal devices export reached JPY 378,097 million (~USD 2,862.95 million) in 2021, with a growth of 106.5%. This is further expected to grow in the coming years, thereby enhancing the demand for the tantalum market.
- Additionally, according to ZVEI, the global consumer electronics market is expected to grow by 5% in 2022. In 2022, the lighting segment should again manage a slightly higher growth of 6% to EUR 138.5 billion (~USD 147.08 billion), while domestic electric appliances (to EUR 287.4 billion (~USD 305.20 billion)) and consumer electronics (to EUR 268.7 billion (~USD 285.34 billion)) might each increase by 5%. This growth is expected to enhance the demand for tantalum-based capacitors from consumer electronics applications.
Asia-Pacific to Dominate the Market
- Asia-Pacific was the major market for the consumption of tantalum, owing to increasing consumption from countries such as China and South Korea. The increase in demand from end-user industries, including electronics, aerospace, and medical equipment, primarily drives the region.
- China is one of the major consumers of tantalum globally. Due to the increasing demand from its industries, the market studied is expected to grow in China in the coming years. China is the largest base for electronics production in the world. Electronic products, such as smartphones, TVs, wires, cables, portable computing devices, gaming systems, and other personal devices, recorded the highest growth in the electronics segment. The country not only serves domestic demand for electronics but also exports electronic output to other countries and is also a leading manufacturer of various components worldwide.
- China is one of the largest aircraft manufacturers and one of the largest markets for domestic air passengers. The civil aircraft fleet in the country has been increasing steadily for the past five years. Moreover, Chinese airline companies plan to purchase about 7,690 new aircraft in the next 20 years, which were valued at approximately USD 1.2 trillion. Boeing estimated that the domestic average RPK (Revenue Passenger Kilometer) growth rate in China is expected to increase at an annual rate of 6.1% in the next 10 years. Therefore, the demand for capacitors and engine turbine blades aerospace application is increasing, which further is expected to boost the demand for the market studied.
- India is expected to have a digital economy of USD 1 trillion by 2025, and the Indian electronics system design and manufacturing (ESDM) sector is expected to generate over USD 100 billion in economic value by 2025. Several policies, such as Make in India, National Policy of Electronics, Net Zero Imports in Electronics, and Zero Defect Zero Effect, offer a commitment to growth in domestic manufacturing, lowering import dependence, and energizing exports and manufacturing.
- The government launched new schemes to promote electronics production in India, the scheme for Promotion of Manufacturing of Electronic Components and Semiconductors (SPECS) and the scheme for modified Electronics Manufacturing Clusters (EMC 2.0), alongside Production Linked Incentive (PLI). According to the PLI scheme, the government is likely to offer incentives as manufacturers increase production in India with USD 5.5 billion available over five years. This is likely to boost the production of electronics in the country.
- South Korea is another important export-based economy in the Asia-Pacific region. South Korea has the third-largest electronics industry in the world in terms of production and fifth-largest in terms of consumption. In 2021, the electronics are valued at USD 200.79 billion.
Tantalum Industry Overview
The tantalum market is partially consolidated in terms of tantalum mining companies. The major companies (not in a particular order) include Global Advanced Metals Pty Ltd, AMG Advanced Metallurgical Group NV, Pilbara Minerals, Alliance Mineral Assets Limited, and Minsur (Mining Taboca).
Additional Benefits:
- The market estimate (ME) sheet in Excel format
- 3 months of analyst support
TABLE OF CONTENTS
1 INTRODUCTION
- 1.1 Study Assumptions
- 1.2 Scope of the Study
2 RESEARCH METHODOLOGY
3 EXECUTIVE SUMMARY
4 MARKET DYNAMICS
- 4.1 Drivers
- 4.1.1 Increasing Demand from the Electrical and Electronics Industry
- 4.1.2 Extensive Usage of Tantalum Alloys in Aviation and Gas Turbines
- 4.2 Restraints
- 4.2.1 Harmful Effects of Tantalum and Decrease in Demand from End-user Industries
- 4.2.2 Other Restraints
- 4.3 Industry Value Chain Analysis
- 4.4 Porter's Five Forces Analysis
- 4.4.1 Bargaining Power of Suppliers
- 4.4.2 Bargaining Power of Consumers
- 4.4.3 Threat of New Entrants
- 4.4.4 Threat of Substitute Products and Services
- 4.4.5 Degree of Competition
- 4.5 Import-Export Trends
- 4.6 Technological Snapshot
- 4.7 Price Index
- 4.8 Regulatory Policy Analysis
5 MARKET SEGMENTATION (Market Size by Volume)
- 5.1 Product
- 5.1.1 Metal
- 5.1.2 Carbide
- 5.1.3 Powder
- 5.1.4 Alloys
- 5.1.5 Other Product Forms
- 5.2 Application
- 5.2.1 Capacitors
- 5.2.2 Semiconductors
- 5.2.3 Engine Turbine Blades
- 5.2.4 Chemical Processing Equipment
- 5.2.5 Medical Equipment
- 5.2.6 Other Applications (includes Ballistics, Cutting Tools, Optical Applications)
- 5.3 Geography
- 5.3.1 Production Analysis
- 5.3.1.1 United States
- 5.3.1.2 Australia
- 5.3.1.3 Brazil
- 5.3.1.4 China
- 5.3.1.5 Congo
- 5.3.1.6 Ethiopia
- 5.3.1.7 Nigeria
- 5.3.1.8 Rwanda
- 5.3.1.9 Other Countries
- 5.3.2 Consumption Analysis
- 5.3.2.1 Asia-Pacific
- 5.3.2.1.1 China
- 5.3.2.1.2 India
- 5.3.2.1.3 Japan
- 5.3.2.1.4 South Korea
- 5.3.2.1.5 Rest of Asia-Pacific
- 5.3.2.2 North America
- 5.3.2.2.1 United States
- 5.3.2.2.2 Canada
- 5.3.2.2.3 Mexico
- 5.3.2.3 Europe
- 5.3.2.3.1 Germany
- 5.3.2.3.2 United Kingdom
- 5.3.2.3.3 Italy
- 5.3.2.3.4 France
- 5.3.2.3.5 Rest of Europe
- 5.3.2.4 South America
- 5.3.2.4.1 Brazil
- 5.3.2.4.2 Argentina
- 5.3.2.4.3 Rest of South America
- 5.3.2.5 Middle-East and Africa
- 5.3.2.5.1 Saudi Arabia
- 5.3.2.5.2 Rest of Middle-East and Africa
- 5.3.1 Production Analysis
6 COMPETITIVE LANDSCAPE
- 6.1 Mergers and Acquisitions, Joint Ventures, Collaborations, and Agreements
- 6.2 Market Share (%)**/Ranking Analysis
- 6.3 Strategies Adopted by Leading Players
- 6.4 Company Profiles (Overview, Financials, Products and Services, and Recent Developments)
- 6.4.1 AMG Advanced Metallurgical Group NV
- 6.4.2 Alliance Mineral Assets Limited
- 6.4.3 China Minmetals Corporation
- 6.4.4 CNMC Ningxia Orient Group Co. Ltd
- 6.4.5 Ethiopian Mineral Development Share Company
- 6.4.6 Global Advanced Metals Pty Ltd
- 6.4.7 Jiangxi Tungsten Industry Group Co. Ltd
- 6.4.8 Minsur (Mining Taboca)
- 6.4.9 Pilbara Minerals
- 6.4.10 Piran Resources Limited (Pella Resources Limited)
- 6.4.11 Tantalex Resources Corporation
- 6.4.12 Tantec GmbH
- 6.4.13 Techmet (KEMET GROUP)
- 6.4.14 Taniobis GmbH
7 MARKET OPPORTUNITIES AND FUTURE TRENDS
- 7.1 Replacement of Solid Capacitors with Polymer Tantalum Capacitors
- 7.2 Other Opportunities

