
|
市場調査レポート
商品コード
1849877
希土類元素:市場シェア分析、産業動向、統計、成長予測(2025年~2030年)Rare Earth Elements - Market Share Analysis, Industry Trends & Statistics, Growth Forecasts (2025 - 2030) |
||||||
カスタマイズ可能
適宜更新あり
|
|||||||
| 希土類元素:市場シェア分析、産業動向、統計、成長予測(2025年~2030年) |
|
出版日: 2025年06月24日
発行: Mordor Intelligence
ページ情報: 英文 120 Pages
納期: 2~3営業日
|

概要
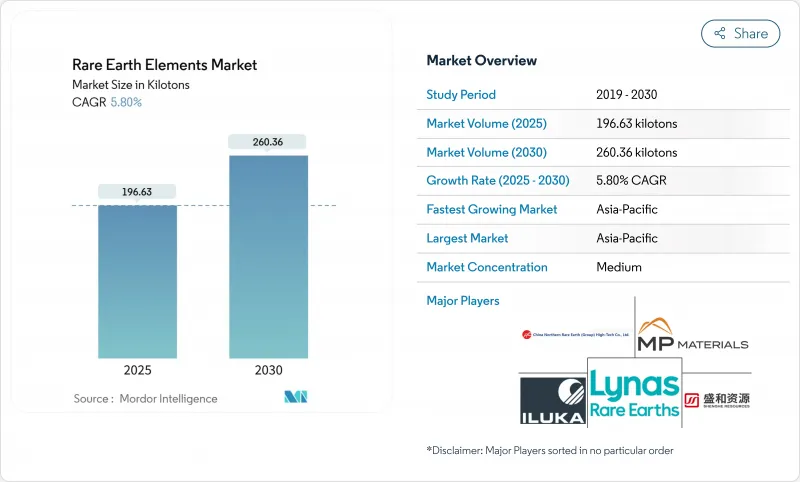
2025年の希土類金属市場は196.63キロトンで、2030年には260.36キロトンに達すると予測され、予測期間のCAGRは5.80%で拡大します。
クリーンエネルギー技術、消費者向け機器、防衛プラットフォームからの旺盛な需要が引き続き生産量を押し上げる一方、電気自動車(EV)の急速な普及により、新たな生産能力や大規模なリサイクルが実現しなければ、2036年までに現在のネオジムとプラセオジムの生産量を上回る恐れがあります。アジア太平洋は、中国が支配的な地位にあることから、依然として生産と加工の中心であり続けているが、米国、カナダ、欧州連合(EU)の政策支援により、集中リスクを軽減できる投資経路が開かれつつあります。高性能NdFeB磁石はEVトラクション・モーターとダイレクト・ドライブ風力タービンに不可欠であるため、磁石用途が最も力強い成長を示し、この分野の予想CAGRは8.02%です。地政学的な摩擦の高まりにより、欧米各国政府は国内プロジェクトに補助金を出すようになっています。米国国防総省だけでも、サプライチェーンを強化するために2020年以降4億3,900万米ドル以上を拠出しています。
世界の希土類元素市場の動向と洞察
新興国からの高い需要
新興国市場では、各国政府が工業化と再生可能エネルギー普及を加速させているため、消費が増加しています。中国は、国内消費が鈍化しているにもかかわらず、2024年には輸出量を増やし、長期的な供給の逼迫を覆い隠しています。インドは、Indian Rare Earths Limitedを通じて2032年までに精製生産量を3倍に増やす計画で、輸入依存度を下げ、地域の自立を強化します。アフリカ諸国は、2029年までに世界の供給量の9%を供給することを目標に掲げており、新たな低コストのトン数を追加することで、価格上昇を抑えることができます。こうした供給サイドの動きは、地域のEV、エレクトロニクス、風力タービン組立工場からの需要増と相まっています。その結果、一国集中は緩和されるもの、川下ユーザーにとっては統合のハードルが高くなります。
グリーンテクノロジーの希土類元素依存性
風力タービン、EV牽引モーター、エネルギー効率の高い照明には、大量のネオジム、プラセオジム、ジスプロシウム、テルビウムが必要です。欧州委員会は、2030年と2050年までに需要がそれぞれ4.5倍から5.5倍に増加すると予測しています。洋上風力タービンには1基あたり数キログラムのネオジム磁石が使用されており、低速回転で高トルクを発揮します。サイクリック・マテリアルズ社は、マイクロソフト社のClimate Innovation Fundから投資を受け、廃棄されたハードディスクからレアアースを最大85%回収するプロセスを開発しました。クローズド・ループ・フローの商業化に成功すれば、原料リスクが緩和され、長期的には中国による供給支配が緩和されるであろう。
分離施設の高い設備投資と放射性廃棄物管理コスト
独立型の分離・酸化物精製施設を建設するには、特殊な溶媒抽出回路と、トリウムやウランを含む残渣の封じ込めシステムが必要になります。これらの要件は操業コストを15~20%上昇させるため、中国国外での先発企業の足かせとなっています。広州の研究グループは、95%の回収率と95%のアンモニア排出を削減する動電法採掘技術を実証し、より厳しい欧米の環境規則に準拠するための実行可能な道筋を提示しました。中国以外の事業者にとっては、十分な資金を調達し、商業規模でこの技術のリスクを回避することが、当面のハードルとなっています。
セグメント分析
軽希土類は、比較的豊富で採掘コストが低いため、2024年には世界トン数の80%を供給します。軽希土類金属の市場規模は、2030年までCAGR 5.98%で拡大すると予測され、研磨パウダー、FCC触媒、NdFeB磁石原料がその原動力となります。欧州と北米のリサイクル・プログラムは廃棄物の流れを転換し始めており、バージン鉱石の成長をマイルドに抑える二次原料を生み出しています。ジスプロシウム、テルビウム、イットリウムなどの重希土類は、単位価値は高いが地質学的希少性に直面しています。現在進行中の動電式浸出のパイロット試験では、60%低い電力使用量で95%の回収率が示されており、製品タイプ間の生産コスト格差が縮小し、長期的な供給経済性が再構築される可能性があります。
EV需要、風力発電の導入、国防調達による二次的効果は、両品種に強い価格シグナルを維持しています。しかし、プロジェクトの資金調達は、冶金が容易で操業開始までの期間が短い軽希土類鉱床に偏っています。重希土類の生産量は、高温磁石、レーザー結晶、蛍光体などの特殊需要に追随すると予想され、レアアース市場全体のバランスの取れた収益構成を支えています。
セリウムは、ガラス研磨用粉末と自動車触媒の使用を背景に、2024年には40%のシェアを占める。HSE大学での実験では、調整可能な黄色の発光が得られ、セリウムの対処可能な市場を広げる可能性のある照明とディスプレーの用途が開かれました。ネオジムは、EVトラクション・モーターとターボ・ジェネレーターが磁石合金の供給を吸収しているため、CAGR9.20%で最速の成長を記録しています。MPマテリアルは、2025年1月にテキサス工場でNdPrの商業生産を開始したが、これは米国の鉱山から磁石までのサプライチェーンを再構築する上で不可欠なマイルストーンです。
テルビウムとジスプロシウムは、洋上風力発電や防衛機器用の高保磁力磁石で安定した需要を享受しているが、冶金の複雑さによって生産量が制約されています。スカンジウムの注目度は高まっており、ルルサールは2025年に酸化スカンジウムの生産を開始し、航空宇宙グレードのAl-Sc合金の投入コストを引き下げ、民間航空機への採用を加速すると見込んでいます。全体として、多様な元素の取り込みが希土類金属市場の弾力的な収益構造を支えています。
地域分析
アジア太平洋は、中国の採掘、分離、磁石製造の統合コンプレックスに支えられ、2024年に世界生産高の86%を生産しました。この地域は、EVと民生用電子機器の生産能力の絶え間ない拡張により、2030年までCAGR 5.92%で成長すると予測されます。日本と韓国は、2025年までに電池と磁石のサプライチェーンのための共有データ・プラットフォームについて連携を深め、回復力を高める。
北米は、新しい鉱山、精製所、磁石プラントの建設スケジュールを短縮する政策的インセンティブを持つ重要な地域です。米国国防総省は2020年以降、国内能力を強化するために4億3,900万米ドル以上を投入しており、MPマテリアルズのマウンテン・パス複合施設はテキサス州の川下事業に供給されています。カナダのクリティカル・ミネラル・ロードマップは、探鉱とパイロット分離ハブに資金を提供し、統合された大陸バリューチェーンを構築することで、米国の目標を補完しています。
欧州の重要原料法は、2030年までに採掘、加工、リサイクルの定量目標を設定し、ノルウェー、スウェーデン、フランスの鉱床への投資と、英国を拠点とするリサイクル事業への投資を促進しています。しかし、許認可のハードルと地元の反対により、グリーンフィールド鉱山の承認は依然として遅れています。ブルンジ、タンザニア、南アフリカのプロジェクトが進展するにつれて、アフリカの貢献度は高まっています。アフリカ大陸は、2029年までに世界需要の9%を供給する可能性があり、貿易の流れを多様化し、単一サプライヤーのリスクを軽減します。
その他の特典:
- エクセル形式の市場予測(ME)シート
- 3ヶ月間のアナリスト・サポート
よくあるご質問
目次
第1章 イントロダクション
- 調査の前提条件と市場の定義
- 調査範囲
第2章 調査手法
第3章 エグゼクティブサマリー
第4章 市場情勢
- 市場概要
- 市場促進要因
- 新興国からの高い需要
- 「グリーンテクノロジー」の希土類元素への依存
- アジア全域で永久磁石EVモーターが急速に普及
- 航空宇宙製造におけるスカンジウムーアルミニウム合金の採用
- 家電製品の高い需要
- 市場抑制要因
- 分離施設への高額な設備投資と放射性廃棄物管理コスト
- 価格変動は中国の政策転換と関連している
- 希土類元素の供給が不安定
- バリューチェーン分析
- ポーターのファイブフォース
- 供給企業の交渉力
- 消費者の交渉力
- 新規参入業者の脅威
- 代替品の脅威
- 競合の程度
第5章 市場規模と成長予測
- 製品タイプ別
- 軽希土類元素
- 重希土類元素
- 元素別
- セリウム
- 酸化物
- 硫化物
- その他の化合物
- ネオジム
- 合金
- ランタン
- 合金
- 酸化物
- その他の化合物
- ジスプロシウム
- テルビウム
- イットリウム
- スカンジウム
- その他の元素
- セリウム
- 用途別
- 触媒
- セラミックス
- リン光体
- ガラスと研磨
- 冶金
- 磁石
- その他の用途
- 最終用途産業別
- クリーンエネルギー
- 家電
- 航空宇宙および防衛
- 産業オートメーション
- ヘルスケア
- その他
- 地域別
- アジア太平洋地域
- 中国
- インド
- 日本
- 韓国
- オーストラリア
- その他アジア太平洋地域
- 北米
- 米国
- カナダ
- メキシコ
- 欧州
- ドイツ
- 英国
- フランス
- イタリア
- 北欧諸国
- その他欧州地域
- 南米
- ブラジル
- アルゼンチン
- その他南米
- 中東・アフリカ
- サウジアラビア
- アラブ首長国連邦
- 南アフリカ
- その他中東・アフリカ地域
- アジア太平洋地域
第6章 競合情勢
- 市場集中度
- 戦略的動向
- 市場シェア分析
- 企業プロファイル
- Appia REU
- China Rare Earth Group Resources Technology Co., Ltd.
- China Rare Earth Holdings Limited
- ChinaTungsten
- Energy Fuels Inc.
- Iluka Resources Limited
- Jiangxi Copper Corporation
- Lynas Rare Earths Ltd
- Mitsubishi Corporation RtM Japan Ltd.
- MP Materials
- Northern Minerals
- Northern Rare Earth
- Rio Tinto
- Shenghe Resources Holding Co., Ltd.
- Ucore Rare Metals Inc.
- Yuyan Rare Earth New Materials Co., Ltd.

