
宇宙採掘・ロボット-市場シェア分析、産業動向と統計、成長予測(2025年~2030年)
Space Mining & Robots - Market Share Analysis, Industry Trends & Statistics, Growth Forecasts (2025 - 2030)- 発行日
- ページ情報
- 英文 167 Pages
- 納期
- 2~3営業日
- 商品コード
- 1693947
- カスタマイズ可能 お客様のご希望に応じて、既存データの加工や未掲載情報(例:国別セグメント)の追加などの対応が可能です。詳細はお問い合わせください。
- 適宜更新あり 本レポートは最新情報反映のため適宜更新し、内容構成変更を行う場合があります。ご検討の際はお問い合わせください。
- 翻訳ツール提供対象 PDF対応AI翻訳ツールの無料貸し出しサービスのご利用が可能です
概要
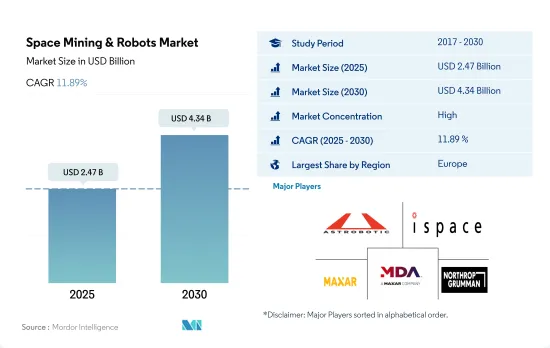
宇宙採掘・ロボット市場規模は2025年に24億7,000万米ドルと推定され、2030年には43億4,000万米ドルに達し、予測期間(2025~2030年)のCAGRは11.89%で成長すると予測されます。
宇宙からの資源採掘範囲の拡大が市場の成長を後押しする見込み
- 世界の宇宙採掘・ロボット市場は、小惑星、月、その他の天体からの資源抽出に応用できる可能性を秘めた新興セグメントです。過去に、様々な企業が宇宙採掘を探求するために新技術を探求し、現在も開発を続けています。
- レアメタルや水などの貴重な資源や宇宙探査の可能性を背景に、宇宙採掘・ロボット市場への関心と投資が高まっています。複数の非公開会社や宇宙機関が、宇宙採掘・ロボットのための技術やシステムの開発に投資しています。2029年には欧州が32.4%のシェアを占め、次いで北米が27.5%、その他が21.1%、アジア太平洋が19%と続くと予想されます。
- 宇宙採掘・ロボット市場は、急速に進歩しているロボット工学と自動化技術に大きく依存しています。これらの進歩には、自律型ロボット、機械学習アルゴリズム、高度センサの開発が含まれ、これによってロボットは過酷な宇宙環境でも動作し、複雑な作業をこなすことができます。2022年、NASAのDART(Dual Asteroid Redirection Test)ミッションは、「キネティックインパクト(kinetic impact)」技術を使って地球を守るために小惑星を偏向させる方法をテストするために設計されました。NASAによると、DARTは小惑星ディモルフォスの軌道速度を1%変えようとして、小惑星ディモルフォスに衝突しました。ディモルフォスは地球にとって脅威ではないが、この野心的なミッションは、小惑星が地球に向かった場合にNASAの科学者が行うであろうことを模倣したものです。全体として、世界の衛星採掘と宇宙ロボット市場は成長段階にあり、2023~2029年の間に183%の成長が見込まれています。
世界の宇宙採掘・ロボット市場動向
ナノ衛星とミニ衛星が市場の需要を生み出す構え
- 宇宙船の質量による分類は、衛星を軌道に打ち上げるためのロケットのサイズとコストを決定するための主要な指標の1つです。北米では、2017~2022年の間に、約45機以上の大型衛星が打ち上げられ、北米の組織が所有していました。北米の組織は、打ち上げられた80機以上の中型衛星を運用し、約2,900機以上の小型衛星がこの地域で製造・打ち上げられました。
- 欧州は、主に異なる質量の衛星に対する需要の増加により、近年著しい成長を遂げています。衛星質量は、欧州の衛星製造市場に影響を与える最も重要な要因の1つです。衛星タイプによって必要な質量が異なるためであり、ひいてはロケット市場にも影響を与えます。例えば、2017~2022年の間に、この地域では合計571機の衛星が打ち上げられました。これら571個の衛星のうち、452個の衛星が軌道に打ち上げられ、超小型衛星45個、大型衛星37個、中型衛星30個、超小型衛星7個と続き、超小型衛星がシェアの大半を占めました。
- 近年、アジア太平洋では、先進的衛星機能に対する需要の高まりに対応する必要性から、衛星製造がますます重要な産業となっています。アジア太平洋で製造される衛星の質量範囲は大きく異なり、これが市場の成長に大きな影響を与えています。例えば、2017~2022年の間に、この地域では合計470機の衛星が打ち上げられました。これら470個の衛星のうち、中型衛星がシェアの大半を占め、152個の衛星が軌道に打ち上げられ、続いて132個の超小型衛星、78個の大型衛星、66個の超小型衛星、42個の超小型衛星が打ち上げられました。
あらゆる種類の人工衛星の開発が進み、さまざまな用途での利用が増加していることが、世界の宇宙開発支出を牽引しています。
- 世界の宇宙開発への政府支出は、2021年に約1,030億米ドルを記録しました。世界最大の宇宙機関であるNASAが存在し、宇宙イノベーションと研究の震源地である北米地域には、世界最大の宇宙機関であるGITAIが存在します。世界有数の宇宙ロボット企業であるGITAIは、米国での事業技術開発を加速・拡大するため、総額40億円(約3,000万米ドル)のシリーズBエクステンションラウンドによる資金調達を完了しました。
- 欧州諸国もまた、宇宙セグメントにおけるさまざまな投資の重要性を認識しています。世界の宇宙産業で競合と革新性を維持するため、宇宙活動や技術革新への支出を増やしています。欧州宇宙機関(ESA)は、2023~2025年の間に185億ユーロの予算を支援するよう22カ国に要請しています。ドイツ、フランス、イタリアが主要拠出国です。2021年6月、7カ国の欧州企業22社からなるコンソーシアムが、ESAのためにロボットを製作しました。欧州ロボットアームの打ち上げと設置は、欧州とロシアにとって宇宙で初めてのことでした。これは、14年間の忍耐の末に実現した、この欧州製ロボットの待望の初披露でした。
- アジア太平洋における宇宙関連活動の増加を考慮すると、2022年、日本の予算案によると、日本の宇宙予算は14億米ドルを超え、これにはH3ロケット、技術検査衛星9号、国の情報収集衛星(IGS)計画の開発が含まれます。同様に、22年度のインドの宇宙開発予算案は18億3,000万米ドルでした。2022年、韓国の科学情報通信省は、人工衛星、ロケット、その他の主要な宇宙機器を製造するための6億1,900万米ドルの宇宙予算を発表しました。
宇宙採掘・ロボット産業概要
宇宙採掘・ロボット市場はかなり統合されており、上位5社で69.52%を占めています。この市場の主要企業は、Astrobotic、iSpace Inc.、Maxar Technologies Inc.、MDA Ltd、Northrop Grumman Corporationです。
その他の特典
- エクセル形式の市場予測(ME)シート
- 3ヶ月のアナリストサポート
目次
第1章 エグゼクティブサマリーと主要調査結果
第2章 レポートのオファー
第3章 イントロダクション
- 調査の前提条件と市場定義
- 調査範囲
- 調査手法
第4章 主要産業動向
- 衛星の質量
- 宇宙開発への支出
- 規制の枠組み
- 世界
- オーストラリア
- ブラジル
- カナダ
- 中国
- フランス
- ドイツ
- インド
- イラン
- 日本
- ニュージーランド
- ロシア
- シンガポール
- 韓国
- アラブ首長国連邦
- 英国
- 米国
- バリューチェーンと流通チャネル分析
第5章 市場セグメンテーション
- 地域
- アジア太平洋
- 欧州
- 北米
- その他
第6章 競合情勢
- 主要な戦略動向
- 市場シェア分析
- 企業情勢
- 企業プロファイル
- Asteroid Mining Corporation
- Astrobotic
- GITAI Inc.
- Honeybee Robotics
- iSpace Inc.
- Maxar Technologies Inc.
- MDA Ltd
- Moon Express
- Motiv Space Systems
- Northrop Grumman Corporation
- Offworld
- Space Applications Services
- Trans Astronautiaca Corporation
第7章 CEOへの主要戦略的質問
第8章 付録
- 世界概要
- 概要
- ファイブフォース分析フレームワーク
- 世界のバリューチェーン分析
- 市場力学(DROs)
- 情報源と参考文献
- 図表一覧
- 主要な洞察
- データパック
- 用語集
目次
Product Code: 50001260
The Space Mining & Robots Market size is estimated at 2.47 billion USD in 2025, and is expected to reach 4.34 billion USD by 2030, growing at a CAGR of 11.89% during the forecast period (2025-2030).
Increased scope for extraction of resources from space is expected to aid the market's growth
- The global space mining and robots market is an emerging field with potential applications in extracting resources from asteroids, the moon, and other celestial bodies. During the historic period, various companies have explored new technologies and are still developing them to explore space mining.
- There is growing interest and investment in the space mining and robots market, driven by the potential for valuable resources such as rare metals and water, as well as the exploration of space. Several private companies and space agencies are investing in developing technologies and systems for space mining and robots. Europe is expected to occupy a major share of 32.4% in 2029, followed by North America, Rest of the World, and Asia-Pacific with 27.5%, 21.1%, and 19%, respectively.
- The space mining and robots market relies heavily on robotics and automation technologies, which are rapidly advancing. These advancements include the development of autonomous robots, machine learning algorithms, and advanced sensors, which enable robots to operate in harsh space environments and perform complex tasks. In 2022, NASA's DART (Dual Asteroid Redirection Test) mission was designed to test a method of deflecting an asteroid to protect the planet using a "kinetic impact" technique. According to NASA, DART crashed into a small asteroid, Dimorphos, in an attempt to change the asteroid's orbital speed by 1%. Although Dimorphos poses no threat to Earth, the ambitious mission mimics what NASA scientists would do if an asteroid were headed for Earth. Overall, the global satellite mining and space robots market is in the growth stage and is expected to grow by 183% during 2023-2029.
Global Space Mining & Robots Market Trends
Nano and mini-satellites are poised to create demand in the market
- The classification of spacecraft by mass is one of the main metrics for determining the launch vehicle size and cost of launching satellites into orbit. In North America, during 2017-2022, around 45+ large satellites launched were owned by North American organizations. North American organizations operated more than 80 medium-sized satellites launched, and around 2,900+ small satellites were manufactured and launched in this region.
- Europe has witnessed significant growth over recent years, primarily driven by the increasing demand for different satellite masses. Satellite mass is one of the most critical factors influencing the European satellite manufacturing market. This is because different types of satellites require different masses, which, in turn, affects the launch vehicle market. For instance, during 2017-2022, a total of 571 satellites were launched in the region. Of these 571 satellites, minisatellites accounted for most of the shares, with 452 satellites launched into orbit, followed by 45 nanosatellites, 37 large satellites, 30 medium size satellites, and seven microsatellites.
- Satellite manufacturing has become an increasingly important industry in the Asia-Pacific region over recent years, driven by the need to meet the growing demand for advanced satellite capabilities. The range of satellite mass being manufactured in the Asia-Pacific region varies significantly, and this has a significant impact on the market's growth. For instance, during 2017-2022, a total of 470 satellites were launched in the region. Of these 470 satellites, medium satellites accounted for most of the shares, with 152 satellites launched into orbit, followed by 132 microsatellites, 78 large satellites, 66 nanosatellites, and 42 minisatellites.
Rising developments across all types of satellites and increased usage for several applications is driving the spending on space programs across the world
- Global government expenditure for space programs hit a record of approximately USD 103 billion in 2021. In the North American region, which is the epicenter of space innovation and research, with the presence of the world's biggest space agency, NASA. GITAI, the world's leading space robotics company, completed a Series B Extension round of funding totaling JPY 4 billion (approximately USD 30 million) to accelerate and expand its business and technology development in the United States.
- European countries are also recognizing the importance of various investments in the space domain. They are increasing their spending on space activities and innovation to stay competitive and innovative in the global space industry. The European Space Agency (ESA) is requesting its 22 nations to back a budget of EUR 18.5 billion during 2023-2025. Germany, France, and Italy are the major contributors. In June 2021, a consortium of 22 European companies from seven countries built a robot for ESA. The launch and installation of the European Robotic Arm was a first for Europe and Russia in space. This was the long-awaited premiere of this European-made robot that followed 14 years of perseverance.
- Considering the increase in space-related activities in the Asia-Pacific region, in 2022, according to the draft budget of Japan, the space budget of the country was over USD 1.4 billion, which included the development of the H3 rocket, Engineering Test Satellite-9, and the nation's Information Gathering Satellite (IGS) program. Similarly, the proposed budget for India's space programs for FY22 was USD 1.83 billion. In 2022, South Korea's Ministry of Science and ICT announced a space budget of USD 619 million for manufacturing satellites, rockets, and other key space equipment.
Space Mining & Robots Industry Overview
The Space Mining & Robots Market is fairly consolidated, with the top five companies occupying 69.52%. The major players in this market are Astrobotic, iSpace Inc., Maxar Technologies Inc., MDA Ltd and Northrop Grumman Corporation (sorted alphabetically).
Additional Benefits:
- The market estimate (ME) sheet in Excel format
- 3 months of analyst support
TABLE OF CONTENTS
1 EXECUTIVE SUMMARY & KEY FINDINGS
2 REPORT OFFERS
3 INTRODUCTION
- 3.1 Study Assumptions & Market Definition
- 3.2 Scope of the Study
- 3.3 Research Methodology
4 KEY INDUSTRY TRENDS
- 4.1 Satellite Mass
- 4.2 Spending On Space Programs
- 4.3 Regulatory Framework
- 4.3.1 Global
- 4.3.2 Australia
- 4.3.3 Brazil
- 4.3.4 Canada
- 4.3.5 China
- 4.3.6 France
- 4.3.7 Germany
- 4.3.8 India
- 4.3.9 Iran
- 4.3.10 Japan
- 4.3.11 New Zealand
- 4.3.12 Russia
- 4.3.13 Singapore
- 4.3.14 South Korea
- 4.3.15 United Arab Emirates
- 4.3.16 United Kingdom
- 4.3.17 United States
- 4.4 Value Chain & Distribution Channel Analysis
5 MARKET SEGMENTATION (includes market size in Value in USD, Forecasts up to 2030 and analysis of growth prospects)
- 5.1 Region
- 5.1.1 Asia-Pacific
- 5.1.2 Europe
- 5.1.3 North America
- 5.1.4 Rest of World
6 COMPETITIVE LANDSCAPE
- 6.1 Key Strategic Moves
- 6.2 Market Share Analysis
- 6.3 Company Landscape
- 6.4 Company Profiles (includes Global Level Overview, Market Level Overview, Core Business Segments, Financials, Headcount, Key Information, Market Rank, Market Share, Products and Services, and Analysis of Recent Developments).
- 6.4.1 Asteroid Mining Corporation
- 6.4.2 Astrobotic
- 6.4.3 GITAI Inc.
- 6.4.4 Honeybee Robotics
- 6.4.5 iSpace Inc.
- 6.4.6 Maxar Technologies Inc.
- 6.4.7 MDA Ltd
- 6.4.8 Moon Express
- 6.4.9 Motiv Space Systems
- 6.4.10 Northrop Grumman Corporation
- 6.4.11 Offworld
- 6.4.12 Space Applications Services
- 6.4.13 Trans Astronautiaca Corporation
7 KEY STRATEGIC QUESTIONS FOR SATELLITE CEOS
8 APPENDIX
- 8.1 Global Overview
- 8.1.1 Overview
- 8.1.2 Porter's Five Forces Framework
- 8.1.3 Global Value Chain Analysis
- 8.1.4 Market Dynamics (DROs)
- 8.2 Sources & References
- 8.3 List of Tables & Figures
- 8.4 Primary Insights
- 8.5 Data Pack
- 8.6 Glossary of Terms
宇宙採掘・ロボット-市場シェア分析、産業動向と統計、成長予測(2025年~2030年)
- 発行日
- 発行
- Mordor Intelligence
- ページ情報
- 英文 167 Pages
- 納期
- 2~3営業日