
|
市場調査レポート
商品コード
1940841
ベトナムの肥料:市場シェア分析、業界動向と統計、成長予測(2026年~2031年)Vietnam Fertilizers - Market Share Analysis, Industry Trends & Statistics, Growth Forecasts (2026 - 2031) |
||||||
カスタマイズ可能
適宜更新あり
|
|||||||
| ベトナムの肥料:市場シェア分析、業界動向と統計、成長予測(2026年~2031年) |
|
出版日: 2026年02月09日
発行: Mordor Intelligence
ページ情報: 英文 80 Pages
納期: 2~3営業日
|

概要
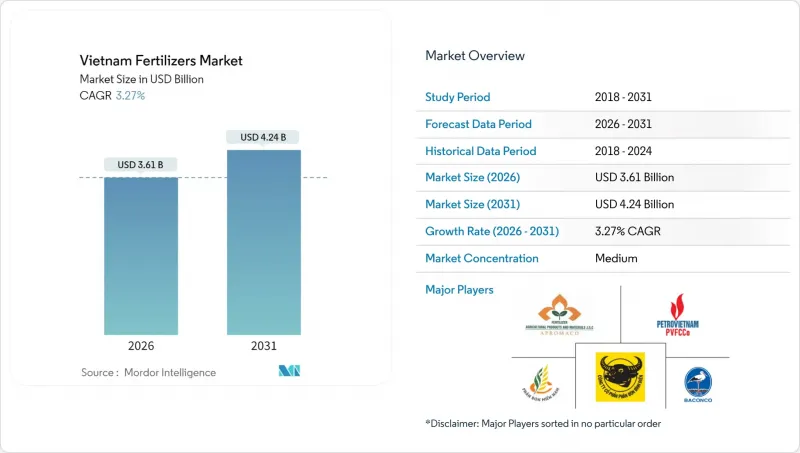
ベトナムの肥料市場規模は2026年に36億1,000万米ドルと推定され、2025年の35億米ドルから成長が見込まれます。
2031年の予測では42億4,000万米ドルに達し、2026年から2031年にかけてCAGR3.27%で拡大する見通しです。
ベトナムは、国内の尿素余剰、政府の強力な近代化プログラム、カンボジア、韓国、フィリピンへの輸出拡大の恩恵を受けています。物流コストの上昇や新たな5%の付加価値税(VAT)導入によるコスト構造の変化が競合圧力となっていますが、税額控除制度は最終的に国内生産者に有利に働きます。高付加価値輸出作物向けの精密施肥システムや特殊肥料の需要が技術投資を牽引する一方、偽造品輸入やカリ塩、DAPへの依存が利益率を圧迫し続けています。一方、国内主要企業による積極的な生産能力増強と世界の流通業者との提携により、ベトナムは地域肥料ハブとしての役割を強化しております。
ベトナムの肥料市場の動向と分析
国内尿素の余剰が輸出拡大を牽引
ベトナムでは年間約120万メートルトンの尿素が余剰生産されており、2024年には173万メートルトン(7億991万米ドル相当)の輸出が実現し、2023年比で数量が11.7%増加しました。輸出先の34.3%をカンボジアが占め、次いで韓国が12.7%、フィリピンが6.3%となっています。コスト優位性はフーミー及びカマウのガス統合複合施設に由来し、競合する原料価格を確保しています。輸出拡大は輸送リスクを分散させ、プラント稼働率を向上させるため、国内需要が鈍化しても国内収益を支えています。
5%の付加価値税(VAT)控除により国内生産コストが低下
ベトナムの肥料市場における5%の付加価値税(VAT)控除の実施は、国内メーカーの生産コストを削減し、輸入品に対する競争力を強化します。2025年7月1日より消費税免税から5%課税制度へ移行することで、生産者は天然ガスや設備に対する仕入税額控除を適用可能となります。この税制改正により、完全課税対象となる輸入肥料と比較して純生産コストが低下します。当措置により運転資金需要は増加しますが、特にリン酸二アンモニウム(DAP)やカリウム輸入価格が上昇する繁忙期において、国内企業の利益率を強化します。
遠隔地への液体肥料・徐放性肥料(CRF)の物流コスト高
ベトナムの遠隔地への液体肥料および徐放性肥料(CRF)輸送に伴う高い物流コストが市場成長を制約しています。これらのコストは最終価格を押し上げ、採用率を低下させ、市場浸透を阻害します。インフラの制約、サプライチェーンの非効率性、国際輸送への依存により、ベトナムの物流費用は農業関連事業の収益において大きな割合を占めています。ベトナムにおける肥料物流コストのうち、輸送費は60%を占めており、世界平均の30%を大きく上回っています。海上輸送費はパンデミック前のコンテナ当たり3,000米ドルから、2024年には1万4,000米ドルに上昇しました。加えて、山岳地帯である北西部地域への道路アクセスは依然として制限されています。液体肥料や徐放性肥料の温度管理輸送要件は配送コストをさらに押し上げ、デルタ地域以外での特殊肥料の導入を制限しています。
セグメント分析
2025年時点で単一成分肥料はベトナムの肥料市場シェアの76.65%を占め、2031年までにCAGR3.42%という最速の成長が見込まれています。これは米・トウモロコシ・サトウキビ生産におけるコスト重視の小規模農家による利用が牽引しています。このカテゴリー内では、尿素は国内生産の経済性から恩恵を受けていますが、DAP(リン酸アンモニウム)とMAP(リン酸一アンモニウム)は輸入依存状態が続き、価格変動要因となっています。複合肥料はシェアこそ小さいもの、硫黄や微量栄養素を配合したバランスの取れたNPK混合肥料を求めるプランテーション経営者の需要により、より速いペースで拡大しています。
尿素の入手容易性は従来型の散布施肥を支えていますが、揮発による窒素損失が抑制剤やコーティング技術への関心を高めています。複合配合肥料は輸出向け収量を目標とするコーヒー・果樹栽培者に支持を得ています。微量栄養素配合製品は初期段階ながら、ラテライト土壌に多い亜鉛・ホウ素欠乏を解消し、果実の品質プレミアム向上に寄与しています。政府による栄養管理教育の継続により、2030年までにバランスの取れた配合製品への需要シフトが見込まれます。
2025年時点で、従来型粒状肥料がベトナムの肥料市場の94.85%を占めており、確立された流通網と散布用具への慣れが反映されています。特殊形態の肥料は、施肥灌漑と温室栽培の拡大により、2031年までCAGR3.58%で推移しました。水溶性結晶および液体懸濁液は、点滴灌漑を行う熱帯果樹園において迅速な吸収を実現し、粒状肥料の散布と比較して栄養効率を向上させます。
徐放性肥料は高価格帯に位置付けられ、遠隔地への輸送コストは高額ですが、大規模コーヒー農園では人件費削減のため高額な支出を受け入れています。微生物接種剤やフミン酸強化液肥は土壌健康問題に対応し、有機認証基準を満たします。デジタルプラットフォームの拡大に伴い、特殊肥料メーカーはニッチ需要に効率的に対応可能となり、主要生産者の製品ポートフォリオ多様化を促進しています。
ベトナムの肥料市場は、種類(複合肥料と単一肥料)、形態(従来型と特殊品)、施用方法(施肥灌漑、葉面散布、土壌施用)、作物タイプ(畑作物、園芸作物など)によってセグメンテーションされます。市場予測は金額(米ドル)と数量(メトリックトン)で提供されます。
その他の特典:
- エクセル形式の市場予測(ME)シート
- アナリストによる3ヶ月間のサポート
よくあるご質問
目次
第1章 イントロダクション
- 調査の前提条件と市場の定義
- 調査範囲
- 調査手法
第2章 レポート提供
第3章 エグゼクティブサマリー主要な調査結果
第4章 主要産業動向
- 主要作物類の作付面積
- 畑作作物
- 園芸作物
- 平均施肥量
- 微量栄養素
- 畑作作物
- 園芸作物
- 主要栄養素
- 畑作作物
- 園芸作物
- 二次性主要栄養素
- 畑作作物
- 園芸作物
- 微量栄養素
- 灌漑設備が整備された農地
- 規制の枠組み
- バリューチェーン及び流通チャネル分析
- 市場促進要因
- 国内尿素の過剰生産が輸出拡大を促進
- 未確定の5%付加価値税控除により、現地生産コストが低下
- 高付加価値輸出作物向けスペシャリティグレードへの転換
- メコン・紅河デルタ地域における精密施肥灌漑の導入
- 政府の有機肥料目標(2050年までに50%の面積)
- 小規模農家への電子商取引流通プラットフォームの普及
- 市場抑制要因
- 遠隔地への液体肥料・CRF輸送における高い物流コスト
- 偽造品及び規格外輸入品による農家信頼の低下
- カリウム肥料及びDAPの輸入依存が価格変動リスクに晒される
- 季節的な在庫過剰が生産者の利益率を圧迫
第5章 市場規模と成長予測(数量と金額)
- タイプ
- 複合肥料
- 単一肥料
- 微量栄養素
- ホウ素
- 銅
- 鉄
- マンガン
- モリブデン
- 亜鉛
- その他
- 窒素系
- 尿素
- その他
- リン酸塩
- DAP
- MAP
- TSP
- その他
- カリ肥料
- MoP
- SoP
- その他
- 二次性主要栄養素
- カルシウム
- マグネシウム
- 硫黄
- 微量栄養素
- 形態
- 従来型
- 特殊肥料
- CRF
- 液体肥料
- SRF
- 水溶性
- 施用方法
- 施肥灌漑
- 葉面散布
- 土壌
- 作物タイプ
- 畑作作物
- 園芸作物
- 芝生・観賞植物
第6章 競合情勢
- 主要な戦略的動きs
- 市場シェア分析
- 企業概況
- 企業プロファイル
- PetroVietnam Fertilizer and Chemical Corporation
- PetroVietnam Ca Mau Fertilizer Joint Stock Company
- Baconco Company Limited
- Binh Dien Fertilizer Joint Stock Company
- Duc Giang Chemical Group Joint Stock Company
- Southern Fertilizer Joint Stock Company
- Ninh Binh Phosphate Fertilizer Joint Stock Company
- Agricultural Products and Materials Joint Stock Company
- Haifa Chemicals Ltd.
- Yara International ASA
- Grupa Azoty S.A.
- Lam Thao Fertilizers and Chemicals Joint Stock Company
- Song Gianh Corporation
- Que Lam Group Joint Stock Company
- Israel Chemicals Ltd.
- Nutrien Ltd.
