
|
市場調査レポート
商品コード
1693550
米国の肥料:市場シェア分析、産業動向・統計、成長予測(2025年~2030年)United States Fertilizers - Market Share Analysis, Industry Trends & Statistics, Growth Forecasts (2025 - 2030) |
||||||
カスタマイズ可能
適宜更新あり
|
|||||||
| 米国の肥料:市場シェア分析、産業動向・統計、成長予測(2025年~2030年) |
|
出版日: 2025年03月18日
発行: Mordor Intelligence
ページ情報: 英文 299 Pages
納期: 2~3営業日
|

全表示
- 概要
- 目次
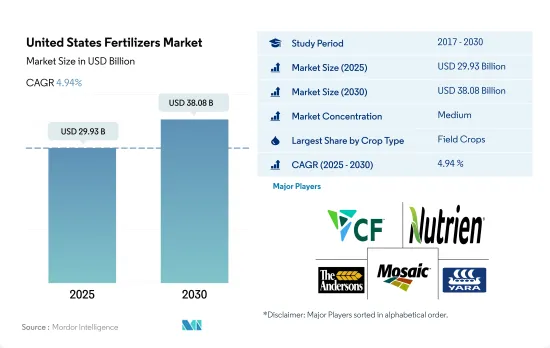
米国の肥料市場規模は2025年に299億3,000万米ドルと推定・予測され、2030年には380億8,000万米ドルに達し、予測期間中(2025-2030年)のCAGRは4.94%で成長すると予測されています。
栽培面積の広さから畑作物が市場を独占
- 畑作物は2022年に87.2%を占め、米国の肥料市場の主要シェアを占めています。米国で最も生産量の多い作物はトウモロコシで、その大部分はコーンベルトと呼ばれる地域で栽培されています。米国で2番目に多く栽培されている作物は大豆です。トウモロコシと同様、農家は主に中西部諸州で大豆を栽培しています。
- 園芸作物の生産は主に10州で行われており、カリフォルニア、フロリダ、オレゴンが売上高でトップです。2022年の最大シェアは慣行肥料の77.6%で、次いで特殊肥料の22.4%です。慣行肥料のシェアが高いのは、農家による慣行肥料の採用率が高いことと、特殊肥料に比べて価格が安いことによる。
- 芝生と観賞用作物は米国肥料市場の10.3%を占めています。米国では、芝生や観賞植物への肥料の使用が増加しているが、これは一般的な動向です。この動向は、手入れの行き届いた芝生や庭園、景観を求める人々の願望が原動力となっていることが多いです。この市場は2023年から2030年にかけてCAGR 4.2%を記録すると予想されています。
- 従来型肥料は2022年に77.8%の最大シェアを占めました。慣行肥料は他の代替品よりも費用対効果が高いことが多く、大規模農業や商業造園にとって実用的な選択肢となっています。
- 主要な畑作物に対する需要の高まり、果物や芝の栽培面積の拡大、自給自足を重視する政府の方針が、観賞用花の温室生産などの戦略の開発につながりました。この開発は、2023年から2030年のCAGRが4.7%と予測されるセグメントの成長に大きく寄与すると予想されます。
米国の肥料市場動向
農地が限られているため、農業用投入資材を利用して農業生産性を高める必要があります。
- 米国では、人口が2020年の3億3,590万人から2022年には3億3,820万人に増加します。農地面積は2000年から5,000万エーカー近く減少し、2022年時点では8億9,340万エーカーに達します。農地が限られているということは、農業投入物を使用して農業生産性を高める必要があることを示しています。作物の生産性を高めるために、肥料は長い間使用されてきました。米国の主要4作物は、トウモロコシ、綿花、大豆、小麦であり、2022年の主要作物作付面積の65.7%以上を占める。
- 大豆とトウモロコシは米国で栽培されている2大作物です。2022年には大豆の栽培面積が最も多く、米国の耕地面積の25.8%を占め、次いでトウモロコシが25.7%、小麦が11.1%です。これらの作物の大部分は、インディアナ西部、イリノイ州、アイオワ州、ミズーリ州、ネブラスカ州東部、カンザス州東部をカバーする「コーンベルト」と呼ばれる地域で栽培されています。トウモロコシと大豆の生産がこの地域を支配しています。米国農務省によれば、米国は米の主要輸出国であり、その栽培の大部分は4つの地域で行われています。
- 農業資材メーカーは、農家の正確な肥料散布を支援する革新的な製品を開発しています。これにより、農家は栽培効率を上げながらコストを削減することができます。同国の畑作物には計り知れない市場ポテンシャルがあり、政府の資金援助や支援が強化されることで、この分野の作物栽培のプラス成長が期待されます。
窒素欠乏は、米国の作付面積全体で最も広く見られる作物養分の問題のひとつです。
- 同国の畑作産業における一次養分(窒素、カリウム、リン)の平均施用量は、約166.61kg/ヘクタールです。窒素は45.93%、カリウムは28.11%、リンは25.96%です。
- 畑作物では、菜種/カノーラの平均一次養分施用量は284.92kg/ヘクタールであり、畑作物で最も多くなりました。一次養分では、窒素が平均施用量229.60 kg/haで第1位を占めています。これは、窒素が植物の代謝に大量に必要であり、葉緑素やアミノ酸の主要成分であるためです。
- 米国では、トウモロコシ/メイズが第2位の畑作物となっており、平均一次養分施用量は245.40 kg/ヘクタール、次いで菜種/カノーラとなっています。トウモロコシの生産量は、同国の畑作物総生産量の約31.44%を占めています。具体的には、トウモロコシは窒素を約50.06%、リンを23.77%、カリを26.17%必要とし、全養分施用量の大部分を占めています。
- 一次栄養素は、植物酵素の機能を高め、植物細胞の成長を促進し、重要な生化学的プロセスを促進する上で極めて重要な役割を果たします。これらの一次栄養素が欠乏すると、植物の健康に重大な影響を与え、成長を阻害し、作物の収量を妨げることになります。これに対して、畑作物への一次栄養素の施用は、高まる生産性要求に応える必要性によって増加すると予想されます。
米国の肥料産業の概要
米国の肥料市場は適度に統合されており、上位5社で57.61%を占めています。この市場の主要企業は以下の通りです。 CF Industries Holdings, Inc., Nutrien Ltd., The Andersons Inc., The Mosaic Company and Yara International ASA(アルファベット順)
その他の特典
- エクセル形式の市場予測(ME)シート
- 3ヶ月のアナリストサポート
目次
第1章 エグゼクティブサマリーと主な調査結果
第2章 レポートのオファー
第3章 イントロダクション
- 調査の前提条件と市場定義
- 調査範囲
- 調査手法
第4章 主要産業動向
- 主要作物の作付面積
- 畑作物
- 園芸作物
- 平均養分施用率
- 微量栄養素
- 畑作物
- 園芸作物
- 一次栄養素
- 畑作物
- 園芸作物
- 二次多量栄養素
- 畑作物
- 園芸作物
- 微量栄養素
- 灌漑農地
- 規制の枠組み
- バリューチェーンと流通チャネル分析
第5章 市場セグメンテーション
- タイプ
- 複合型
- ストレート
- 微量栄養素
- ホウ素
- 銅
- 鉄
- マンガン
- モリブデン
- 亜鉛
- その他
- 窒素
- 硝酸アンモニウム
- 無水アンモニア
- 尿素
- その他
- リン酸
- DAP
- MAP
- SSP
- TSP
- カリウム
- MoP
- SoP
- その他
- 二次栄養素
- カルシウム
- マグネシウム
- 硫黄
- 形態
- 従来型
- 特殊
- CRF
- 液体肥料
- SRF
- 水溶性
- 施肥モード
- 施肥
- 葉面散布
- 土壌
- 作物タイプ
- 畑作物
- 園芸作物
- 芝・観賞用
第6章 競合情勢
- 主要な戦略動向
- 市場シェア分析
- 企業情勢
- 企業プロファイル
- CF Industries Holdings, Inc.
- Haifa Group
- ICL Group Ltd
- Koch Industries Inc.
- Nutrien Ltd.
- Sociedad Quimica y Minera de Chile SA
- The Andersons Inc.
- The Mosaic Company
- Wilbur-Ellis Company LLC
- Yara International ASA
第7章 CEOへの主な戦略的質問
第8章 付録
- 世界概要
- 概要
- ファイブフォース分析フレームワーク
- 世界のバリューチェーン分析
- 市場力学(DROs)
- 情報源と参考文献
- 図表一覧
- 主要洞察
- データパック
- 用語集
The United States Fertilizers Market size is estimated at 29.93 billion USD in 2025, and is expected to reach 38.08 billion USD by 2030, growing at a CAGR of 4.94% during the forecast period (2025-2030).
Field crops dominated the market owing to their larger cultivation area
- Field crops hold a major share of the US fertilizer market, as they accounted for 87.2% in 2022. The largest crop in the United States in terms of total production is corn, the majority of which grows in a region known as the Corn Belt. The second-largest crop grown in the United States is soybeans. Like corn, farmers primarily grow soybeans in the Midwestern states.
- Horticulture production primarily occurs in 10 states, with California, Florida, and Oregon leading the country in sales. Conventional fertilizers occupied a maximum share of 77.6% in 2022, followed by specialty fertilizers with 22.4%. The higher share of conventional fertilizers is due to the higher adoption of conventional fertilizers by farmers and their lower prices compared to specialty fertilizers.
- Turf and ornamental crops contribute to 10.3% of the US fertilizer market. The increased use of fertilizers in turf and ornamental plants in the United States is a common trend. This trend is often driven by the desire for well-manicured lawns, gardens, and landscapes. The market is expected to register a CAGR of 4.2% from 2023 to 2030.
- Conventional fertilizers occupied a maximum share of 77.8% in 2022. Conventional fertilizers are often more cost-effective than other alternatives, making them a practical choice for large-scale agriculture and commercial landscaping.
- The rising demand for major field crops, the expansion of cultivated areas for fruits and turf, and the government's emphasis on self-sufficiency have led to the development of strategies like greenhouse production of ornamental flowers. This development is expected to significantly contribute to segmental growth, with a projected CAGR of 4.7% between 2023 and 2030.
United States Fertilizers Market Trends
The limited farmland indicates the need to enhance agricultural productivity by employing agri-inputs
- In the United States, the population increased from 335.9 million in 2020 to 338.2 million in 2022. From 2000, the total farmland area decreased by almost 50 million acres, reaching a total of 893.4 million acres as of 2022. The limited farmland indicates the need to increase agricultural productivity with the use of agri inputs. Fertilizers have been used for a long time to increase the productivity of crops. The four major crops in the United States are corn, cotton, soybean, and wheat, which account for more than 65.7% of the principal crop acreage in 2022.
- Soybean and corn are the two largest crops grown in the United States. In 2022, soybeans had the highest area under cultivation, accounting for 25.8% of the total arable land in the United States, followed by corn at 25.7% and wheat at 11.1%. The majority of these crops are grown in a region known as the "Corn Belt," which covers western Indiana, Illinois, Iowa, Missouri, eastern Nebraska, and eastern Kansas. The production of corn (maize) and soybeans dominates this area. Additionally, the United States is a major exporter of rice, with most of the cultivation happening in four regions, three of which are in the South and one in California, according to the USDA.
- Manufacturers of farm inputs are developing innovative products to assist farmers with the precise application of fertilizers. This helps farmers reduce the cost of cultivation while increasing efficiency. The country's field crops have immense market potential, and with increased government funding and support, they are expected to drive positive growth in crop cultivation in this area.
Nitrogen deficiency is one of the most prevalent crop nutrient problems across cropping areas in the United States
- The average application rate of primary nutrients (nitrogen, potassium, and phosphorus) in the country's field crops industry stands at approximately 166.61 kg/hectare. Nitrogen constitutes 45.93%, potassium accounts for 28.11%, and phosphorus makes up 25.96% of the total primary nutrient application in field crops.
- In field crops, rapeseed/ canola was applied with an average primary nutrient application rate of 284.92 kg/hectare, which is the highest in field crops. In primary nutrients, nitrogen occupies first place with an average application rate of 229.60 kg/hectare. This is because nitrogen is required in large amounts for plant metabolism, and it is a major component of chlorophyll and amino acids.
- In the United States, corn/maize stands as the second-largest field crop, with an average primary nutrient application rate of 245.40 kg/hectare, followed by rapeseed/canola. Corn production constitutes approximately 31.44% of the country's total field crop output. Specifically, corn requires about 50.06% of nitrogen, 23.77% of phosphorus, and 26.17% of potash, making up the lion's share of the total nutrient application.
- Primary nutrients play a pivotal role in enhancing plant enzyme function, bolstering plant cell growth, and facilitating crucial biochemical processes. Any deficiency in these primary nutrients can significantly impact plant health, stunting growth and hampering crop yields. In response, the application of primary nutrients in field crops is expected to rise, driven by the need to meet escalating productivity demands.
United States Fertilizers Industry Overview
The United States Fertilizers Market is moderately consolidated, with the top five companies occupying 57.61%. The major players in this market are CF Industries Holdings, Inc., Nutrien Ltd., The Andersons Inc., The Mosaic Company and Yara International ASA (sorted alphabetically).
Additional Benefits:
- The market estimate (ME) sheet in Excel format
- 3 months of analyst support
TABLE OF CONTENTS
1 EXECUTIVE SUMMARY & KEY FINDINGS
2 REPORT OFFERS
3 INTRODUCTION
- 3.1 Study Assumptions & Market Definition
- 3.2 Scope of the Study
- 3.3 Research Methodology
4 KEY INDUSTRY TRENDS
- 4.1 Acreage Of Major Crop Types
- 4.1.1 Field Crops
- 4.1.2 Horticultural Crops
- 4.2 Average Nutrient Application Rates
- 4.2.1 Micronutrients
- 4.2.1.1 Field Crops
- 4.2.1.2 Horticultural Crops
- 4.2.2 Primary Nutrients
- 4.2.2.1 Field Crops
- 4.2.2.2 Horticultural Crops
- 4.2.3 Secondary Macronutrients
- 4.2.3.1 Field Crops
- 4.2.3.2 Horticultural Crops
- 4.2.1 Micronutrients
- 4.3 Agricultural Land Equipped For Irrigation
- 4.4 Regulatory Framework
- 4.5 Value Chain & Distribution Channel Analysis
5 MARKET SEGMENTATION (includes market size in Value in USD and Volume, Forecasts up to 2030 and analysis of growth prospects)
- 5.1 Type
- 5.1.1 Complex
- 5.1.2 Straight
- 5.1.2.1 Micronutrients
- 5.1.2.1.1 Boron
- 5.1.2.1.2 Copper
- 5.1.2.1.3 Iron
- 5.1.2.1.4 Manganese
- 5.1.2.1.5 Molybdenum
- 5.1.2.1.6 Zinc
- 5.1.2.1.7 Others
- 5.1.2.2 Nitrogenous
- 5.1.2.2.1 Ammonium Nitrate
- 5.1.2.2.2 Anhydrous Ammonia
- 5.1.2.2.3 Urea
- 5.1.2.2.4 Others
- 5.1.2.3 Phosphatic
- 5.1.2.3.1 DAP
- 5.1.2.3.2 MAP
- 5.1.2.3.3 SSP
- 5.1.2.3.4 TSP
- 5.1.2.4 Potassic
- 5.1.2.4.1 MoP
- 5.1.2.4.2 SoP
- 5.1.2.4.3 Others
- 5.1.2.5 Secondary Macronutrients
- 5.1.2.5.1 Calcium
- 5.1.2.5.2 Magnesium
- 5.1.2.5.3 Sulfur
- 5.2 Form
- 5.2.1 Conventional
- 5.2.2 Speciality
- 5.2.2.1 CRF
- 5.2.2.2 Liquid Fertilizer
- 5.2.2.3 SRF
- 5.2.2.4 Water Soluble
- 5.3 Application Mode
- 5.3.1 Fertigation
- 5.3.2 Foliar
- 5.3.3 Soil
- 5.4 Crop Type
- 5.4.1 Field Crops
- 5.4.2 Horticultural Crops
- 5.4.3 Turf & Ornamental
6 COMPETITIVE LANDSCAPE
- 6.1 Key Strategic Moves
- 6.2 Market Share Analysis
- 6.3 Company Landscape
- 6.4 Company Profiles
- 6.4.1 CF Industries Holdings, Inc.
- 6.4.2 Haifa Group
- 6.4.3 ICL Group Ltd
- 6.4.4 Koch Industries Inc.
- 6.4.5 Nutrien Ltd.
- 6.4.6 Sociedad Quimica y Minera de Chile SA
- 6.4.7 The Andersons Inc.
- 6.4.8 The Mosaic Company
- 6.4.9 Wilbur-Ellis Company LLC
- 6.4.10 Yara International ASA
7 KEY STRATEGIC QUESTIONS FOR FERTILIZER CEOS
8 APPENDIX
- 8.1 Global Overview
- 8.1.1 Overview
- 8.1.2 Porter's Five Forces Framework
- 8.1.3 Global Value Chain Analysis
- 8.1.4 Market Dynamics (DROs)
- 8.2 Sources & References
- 8.3 List of Tables & Figures
- 8.4 Primary Insights
- 8.5 Data Pack
- 8.6 Glossary of Terms

