
|
市場調査レポート
商品コード
1911713
北米の肥料:市場シェア分析、業界動向と統計、成長予測(2026年~2031年)North America Fertilizers - Market Share Analysis, Industry Trends & Statistics, Growth Forecasts (2026 - 2031) |
||||||
カスタマイズ可能
適宜更新あり
|
|||||||
| 北米の肥料:市場シェア分析、業界動向と統計、成長予測(2026年~2031年) |
|
出版日: 2026年01月12日
発行: Mordor Intelligence
ページ情報: 英文 100 Pages
納期: 2~3営業日
|

概要
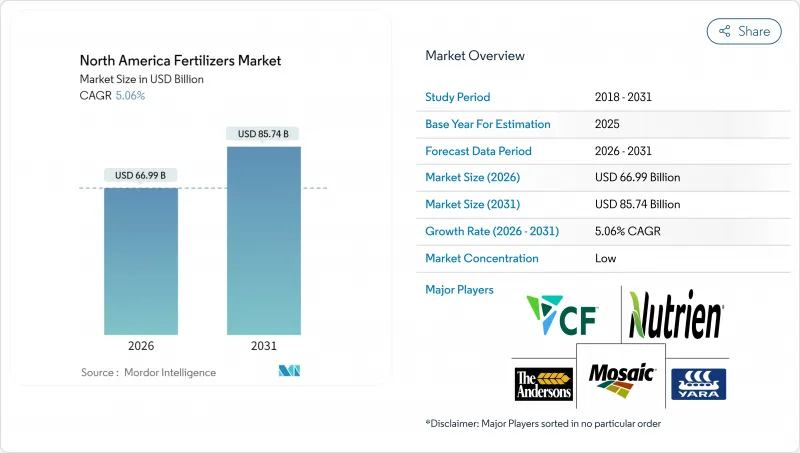
北米の肥料市場は、2025年の637億6,000万米ドルから2026年には669億9,000万米ドルへ成長し、2026年から2031年にかけてCAGR5.06%で推移し、2031年までに857億4,000万米ドルに達すると予測されています。
現在の成長勢いは、トウモロコシと大豆の作付面積拡大、輸入リスクを低減する国内生産能力の増強、約2億7,000万エーカーの耕作地における養分利用効率を向上させる精密農業ツールによって牽引されています。生産者はまた、被覆肥料や徐放性製品を優遇する環境規制の強化に直面している一方、グリーンアンモニアに対する政府の優遇措置が、低炭素生産設備への新たな資本投資を促進しています。2021-2022年の輸送混乱後、供給の回復力は向上しました。しかしながら、物流の改善と運賃コストの低下は製品の標準化を継続的に支え、輸入カリウム塩およびリン酸塩のコスト競争力を維持しています。地域ごとの土壌特性や作物の多様性が製品の標準化を制限するため、競合の激しさは依然として分散した状態です。これにより、特殊ブレンド業者、農学サービス企業、およびプラットフォームベースの課題者たちが、圃場レベルでソリューションをカスタマイズする余地が生まれています。
北米の肥料市場の動向と洞察
米国におけるトウモロコシ・大豆作付面積の拡大
トウモロコシと大豆の作付面積は2026年までに9,620万エーカーに達すると予測されています。作付面積が100万エーカー増加するごとに、約18万メートルトンの窒素肥料が必要となります。この成長は再生可能燃料基準と安定した輸出販売に支えられています。新品種のハイブリッドは窒素をより効率的に利用しますが、作付面積の拡大により総消費量は増加傾向を維持しています。新規作付面積の大半はアイオワ州、イリノイ州、ネブラスカ州に集中しており、これらの地域ではパイプライン網により低コストのアンモニアが供給されています。トウモロコシの連作ではより多量の窒素施肥が必要となるため、今後10年間にわたる需要が確保される見込みです。
高付加価値作物向け特殊肥料への移行
カリフォルニア州セントラルバレーの果樹・ナッツ・野菜生産者は、既に約280万エーカーの農地で特殊製品を導入しています。徐放性粒剤は労力を削減し、果実のサイズ・色・保存性を保護する安定した栄養供給を実現します。水溶性製品ラインは、アボカドや柑橘類の果樹園において施肥管理を微調整する肥料灌漑システムと連携します。有機肥料のプレミアム価格は、標準品より40~60%高いこれらの投入資材のコストを相殺するのに役立ちます。フロリダの柑橘類生産者も、集中的な微量栄養素プログラムで病害圧と戦うため、同様の戦略を採用しています。
天然ガス価格の変動が窒素コストを押し上げております
アンモニア生産には1トンあたり約28~30百万BTUの天然ガスを消費するため、肥料コストはヘンリーハブ先物価格の変動に連動します。2024年冬季暖房シーズンには同先物が1百万BTUあたり9.50米ドルでピークを記録しました。季節的な需要急増とパイプライン制約が価格変動を助長しています。メーカーは可能な限り燃料コストをヘッジしていますが、使用量が急増する春先には農家でも価格上昇を実感しています。
セグメント分析
2025年時点で、単一成分肥料は北米の肥料市場シェアの79.90%を占めております。この数値は、大規模穀物生産者が信頼性が高く低コストな単一栄養素製品への依存を継続していることを示しています。グレートプレーンズ及び中西部におけるトウモロコシや小麦の作付面積が安定した需要を牽引しているため、窒素グレードがこのカテゴリーを支配しております。複数の栄養素を1つの粒状肥料に配合した複合肥料は、2031年までにCAGR6.72%と最も高い伸びを示しています。これは特殊作物の生産者が、施肥回数の削減と人件費の低減につながるバランスの取れた配合を好むためです。
カリ肥料も6.72%の成長率を維持します。カナダのカリ鉱山に加え、干ばつ対策や品質向上におけるカリウムの役割が広く認識されているためです。これら3種類の肥料すべてにおいて、被覆タイプの需要が急速に高まっています。ポリマーや硫黄層が養分流失を抑制し、農家が水質規制を満たすことを可能にするためです。精密な土壌検査により亜鉛、マンガン、ホウ素の不足が顕在化しているため、単一配合肥料への微量栄養素添加が一般的になりつつあります。可変施肥装置が適切な区域に適切な製品を投入するこの変化は、従来の「一律」NPK施肥法よりも、高収量化にはより精密な栄養管理が求められる時代を反映しています。
2025年には従来型肥料が売上高の82.60%を占めており、コスト意識の高い穀物生産者は実績ある主力製品を継続して採用しています。特殊肥料分野は、水質規制と労働コスト上昇により複数回の散布よりも単回施肥プログラムが有利となる状況を受け、5.55%のCAGRで業界を牽引しています。高付加価値の果実・ナッツ・野菜部門の生産者は、徐放性コーティングが養分利用効率を高め製品品質を保護する場合、進んでプレミアム価格を支払います。
液体肥料も、注入装置を通じて流動性が高く、作業者がその場で施肥量を調整できる点で存在感を増しています。こうしたコーティング技術の開発には多額の資本と専門知識が必要であり、既存メーカーを模倣業者から守っています。現在、研究開発の焦点はより強固な被膜と安定した放出曲線の開発に置かれており、日単位で作物の需要に栄養供給を確実に合わせることを目指しています。
北米の肥料市場レポートは、種類別(複合肥料と単一肥料)、形態別(従来型と特殊品)、施用方法別(土壌、葉面散布など)、作物種別(畑作物、園芸作物など)、地域別(米国、カナダ、メキシコなど)に分類されています。市場予測は、金額(米ドル)および数量(メトリックトン)で提供されます。
その他の特典:
- エクセル形式の市場予測(ME)シート
- アナリストによる3ヶ月間のサポート
よくあるご質問
目次
第1章 イントロダクション
- 調査の前提条件と市場の定義
- 調査範囲
- 調査手法
第2章 レポート提供
第3章 エグゼクティブサマリー
第4章 主要産業動向
- 主要作物類の作付面積
- 畑作作物
- 園芸作物
- 平均施肥量
- 微量養素
- 畑作作物
- 園芸作物
- 主要養素
- 畑作作物
- 園芸作物
- 二次多量養素
- 畑作作物
- 園芸作物
- 微量養素
- 灌漑設備を備えた農地
- 規制の枠組み
- バリューチェーン及び流通経路分析
- 市場促進要因
- 米国におけるトウモロコシ・大豆作付面積の拡大
- 高付加価値作物向け特殊肥料への移行
- グリーンアンモニアプラントに対する連邦および州の優遇措置
- バイオ燃料混合義務化による窒素需要の増加
- 再生農業が微量栄養素配合肥料を牽引
- 水溶性NPKを必要とする制御環境農業
- 市場抑制要因
- 天然ガス価格の変動が窒素コストを押し上げる
- 五大湖流域におけるリン酸流出規制の強化
- 農場で実施される家畜ふん尿の栄養分リサイクルが合成肥料の需要を抑制
- セントローレンス水路経由のカリ物流のボトルネック
第5章 市場規模と成長予測(金額および数量)
- タイプ
- 複合
- 単一
- 微量養素
- 亜鉛
- マンガン
- 銅
- 鉄
- ホウ素
- モリブデン
- その他の微量養素
- 窒素
- 尿素
- 硝酸アンモニウム
- 無水アンモニア
- その他の窒素
- リン酸塩
- リン酸一アンモニウム(MAP)
- リン酸二アンモニウム(DAP)
- 単一過リン酸石灰(SSP)
- 三重過リン酸石灰(TSP)
- その他のリン酸塩
- カリウム
- 塩化カリウム(MoP)
- 硫酸カリウム(SoP)
- その他のカリウム
- 二次主要栄養素
- カルシウム
- マグネシウム
- 硫黄
- 微量養素
- 形態別
- 従来型
- 特殊肥料
- 放出制御肥料(CRF)
- 徐放性肥料(SRF)
- 液体肥料
- 水溶性
- 施用方法別
- 土壌
- 葉面散布
- 施肥灌漑
- 作物タイプ別
- 畑作作物
- 園芸作物
- 芝生および観賞植物
- 国別
- 米国
- カナダ
- メキシコ
- その他北米地域
第6章 競合情勢
- 主要な戦略的動きs
- 市場シェア分析
- 企業概況
- 企業プロファイル
- CF Industries Holdings, Inc.
- Nutrien Ltd.
- The Mosaic Company
- Yara International ASA
- The Andersons Inc.
- Haifa Chemicals Ltd.
- OCI Nitrogen
- Intrepid Potash, Inc.
- J. R. Simplot Company
- Koch Fertilizer LLC
- Wilbur-Ellis Company LLC
- K+S Aktiengesellschaft
- EuroChem Group AG
- IFFCO Canada Enterprise Ltd.
- ICL Group Ltd.

