
|
市場調査レポート
商品コード
1911710
カリ肥料:市場シェア分析、業界動向と統計、成長予測(2026年~2031年)Potash Fertilizer - Market Share Analysis, Industry Trends & Statistics, Growth Forecasts (2026 - 2031) |
||||||
カスタマイズ可能
適宜更新あり
|
|||||||
| カリ肥料:市場シェア分析、業界動向と統計、成長予測(2026年~2031年) |
|
出版日: 2026年01月12日
発行: Mordor Intelligence
ページ情報: 英文 120 Pages
納期: 2~3営業日
|

概要
2026年のカリ肥料市場規模は227億1,000万米ドルと推定され、2025年の215億1,000万米ドルから成長し、2031年には298億3,000万米ドルに達すると予測されています。
2026年から2031年にかけてはCAGR5.6%で拡大する見込みです。
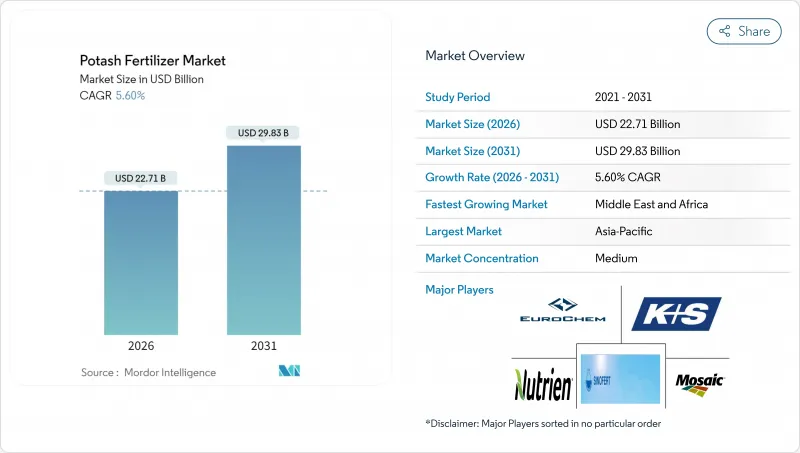
長期的な需要の堅調さは、集約農業地域における土壌養分枯渇の加速、精密施肥ツールの急速な普及、そして国内穀物生産を促進する中国における飼料配合の政策主導型転換に起因しております。生産者側では、湾岸諸国における特殊作物の作付面積拡大、グリーン水素用塩洞貯蔵施設からの新たな産業需要、そして敏感な土壌向けに低塩化物硫酸カリウムを推奨する企業のネットゼロ目標達成への取り組みも追い風となっております。ブラジルにおける物流のボトルネックやエネルギー価格の変動がコスト圧力となる一方、主要サプライヤーは生産能力の拡大、統合された流通網、農薬の意思決定サイクルへのより深い組み込みを可能にするデジタル農業サービスを通じて対応しています。これらの要因が相まって、2030年までカリ肥料市場の継続的な成長が示唆されています。
世界のカリ肥料市場の動向と洞察
集約的農業地域における土壌養分枯渇の進行
数十年にわたる高収量トウモロコシ・大豆輪作と二毛作システムにより、カリウム貯蔵量が自然風化による補充速度を上回るペースで枯渇し、多くの表土が機能的に不足状態に陥っています。米国中西部では現在、農地の大半(60%)が農学的必要基準値を下回っており、この割合は2021年以降、記録的な肥料支出にもかかわらず毎シーズン増加を続けています。同様の土壌劣化が中国の長江穀倉地帯でも進行中です。ここでは稲作と小麦作の集約的な輪作体系が休耕期間を短縮し、有機物の回復を阻んでいます。新たに開墾されたブラジルのセラード地域は当初肥沃に見えますが、5作期も経たないうちに、土壌中の天然鉱物が酸化・溶出するため、大量のカリ肥料が必要となります。こうした重なり合うパターンが構造的な消費基盤を形成し、カリ肥料市場を作付面積の周期的な変動から守っています。農学者は、この栄養素不足を解消できなければ、10年以内に世界の穀物収量が6~8%減少する可能性があると警告しており、持続的なカリ肥料施用の緊急性をさらに強めています。
精密施肥技術の普及加速
可変散布率スプレッダー、マルチスペクトルドローン、圃場内カリウムプローブにより、従来の一律散布では見逃されていた微小欠乏ゾーンを農家が特定できるようになりました。ジョンディアのデータによれば、2,000エーカー以上の農場では、ゾーン別処方への切り替え後、潜在的な低カリウム帯が修正された結果、総カリウム使用量が15%増加しています。デジタルプラットフォームは施肥作業の時刻記録も行うため、カリウムが植物の吸収ピークの数日前ではなく数時間前に投入され、穀物の重量と農家の収益を向上させます。機器メーカーはセンサーとソフトウェアを融資パッケージに組み込み、初期導入障壁を低減することで、コーンベルトやカナダ大平原地域での普及を加速させています。欧州の共通農業政策(CAP)は、デジタルマッピング費用の償還により推進力を加え、2025年までにドイツとフランスの大規模農場の40%で精密農業の導入を促進します。これらのツールが中規模農場に普及するにつれ、カリ肥料市場は持続的な需要増を獲得し、効率化の漸進的向上を相殺します。
ベラルーシカリ輸出を制限する地政学的制裁
2024年3月に発効した欧州連合(EU)の規制により、ベラルーシのカリ生産能力約1,200万トン(世界取引量の5分の1に相当)が停止されました。代替貨物の確保に奔走したトレーダーにより、スポット価格は数週間で30%急騰。東南アジア向け海上輸送期間はサプライチェーンの再編に伴い2カ月延長されました。インドや中国の輸入業者はロシアやカナダの鉱山業者に目を向けましたが、鉄道や港湾の混雑により代替供給量は頭打ちとなりました。銀行はベラルーシ関連の信用状取引に警戒感を強め、融資プレミアムが上乗せされ、それが農業投入コストに転嫁されています。制裁対象分のうち一部は第三国経由で流入する可能性もありますが、不確実性からユーザーは先物予約に慎重な姿勢を維持しています。この制約は少なくとも2026年まで継続し、カリ肥料市場の潜在的な上昇余地を抑制する見込みです。
セグメント分析
2025年、塩化カリウムはカリ肥料市場シェアの86.05%を占め、大規模穀物生産システムにおける低コスト栄養基盤としての役割を反映しています。その普及は、一般的な散布機との互換性と、農業地帯を迅速に横断する大量輸送を可能とする鉄道網に起因します。薄利で経営するトウモロコシ、大豆、小麦生産者にとって、カリウム単価は依然として決定的な要素です。その結果、塩化カリウムは価格が上昇傾向にある場合でも、調達計画の基盤として位置づけられています。
硫酸カリウムは、制御環境下での農業や塩化物に敏感な作物の普及に伴い、5.85%というより高いCAGRで拡大しています。温室トマト、食用ブドウ、ジャガイモの生産者は、製品品質と輸出プレミアムを支える硫酸カリウムの低塩化物特性を高く評価しています。欧州が導入をリードしており、ドイツとオランダでは加熱式ガラス温室で広く使用されています。北米の果物・野菜生産者もこれに続いています。
本カリ肥料市場レポートは、製品別(塩化カリ、硫酸カリ、その他)、施用方法別(フェルティゲーション、葉面散布、土壌施用)、作物種別(畑作物、園芸作物、芝生・観賞植物)、地域別(北米、南米、欧州、アジア太平洋、中東・アフリカ)に分類されています。市場予測は金額および数量ベースで提供されます。
地域別分析
アジア太平洋地域は2025年に世界のカリ肥料市場シェアの41.90%を占め、最大の地域シェアとなりました。同地域は、高密度穀物地帯から拡大する多年生植物栽培に至る多様な農業システムにより、2031年までCAGR5.5%で成長すると予測されています。精密農業資材やバランスの取れた栄養補給を補助する政策インセンティブにより、価格上昇にもかかわらず施用率は増加傾向にあります。環境制御型農業への投資は、広大な面積で生産される塩化カリウムを補完する低塩化物グレードの肥料に対し、年間を通じて安定した需要を生み出しています。資源豊富な経済圏の鉱業サービス企業も肥料流通事業へ参入し、遠隔地生産地域における供給安定性の向上に貢献しています。
北米、中東・アフリカ地域では、2026年から2031年にかけてCAGR6.82%という最も速い拡大ペースが見込まれます。北米では、可変施肥技術の普及により、隠れたカリウム不足が明らかになりつつあり、1エーカー当たりの効率が向上する一方で、総養分使用量は増加傾向にあります。同時に、中東・アフリカの乾燥・半乾燥地域では、灌漑設備の拡充と食料安全保障プログラムにより、従来は限界農地とされていた土地が活用され始めております。砂漠地帯の温室向け特殊硫酸塩肥料の出荷は、新規作付地向け塩化カリウムの大量流通を補完し、地域における製品構成のバランスを保っております。
欧州と南米では、栄養管理と輸出競争力が調和すれば、成熟した耕作地が依然として需要を牽引し得ることを示しています。東欧の生産者は土壌の回復に努めゾーンサンプリングを導入する一方、西欧市場では有機認証要件に適合する高品質硫酸塩混合肥料が好まれています。南米のカリ肥料市場は、物流のボトルネックや通貨変動にもかかわらず、著しいCAGRで拡大が見込まれます。鉄道や港湾の継続的な改良に加え、デジタル農学ツールの普及が進むことで、供給制約が緩和され、同地域の成長勢いが持続すると予想されます。
その他の特典:
- エクセル形式の市場予測(ME)シート
- アナリストによる3ヶ月間のサポート
よくあるご質問
目次
第1章 イントロダクション
- 調査の前提条件と市場の定義
- 調査範囲
- 調査手法
第2章 レポート提供
第3章 エグゼクティブサマリーおよび主要な調査結果
第4章 主要な業界動向
- 主要作物類の作付面積
- 畑作作物
- 園芸作物
- 平均施肥量
- 主要栄養素
- 畑作作物
- 園芸作物
- 主要栄養素
- 灌漑設備が整備された農地
- 規制枠組み
- バリューチェーン及び流通チャネル分析
- 市場促進要因
- 集約的に耕作される地域における土壌養分枯渇の進行
- 大規模生産者における精密施肥技術の採用加速
- 中国飼料規制の移行:穀物ベースの畜産飼料配合への転換
- 湾岸諸国における高付加価値園芸向け特殊作物の作付面積拡大(過小評価)
- グリーン水素貯蔵用塩洞における季節的貯蔵のためのカリ需要(過小報告)
- 企業のネットゼロ目標が低塩化物土壌における硫酸カリウム需要を牽引(過小評価)
- 市場抑制要因
- ベラルーシカリの輸出を制限する地政学的制裁
- 天然ガス価格の変動が下流の肥料コストを押し上げている
- 合成投入物の使用量を削減する再生農業の導入拡大
- ブラジル内陸港湾におけるインフラのボトルネック(過小評価されている)
第5章 市場規模と成長予測(金額と数量)
- タイプ
- MoP
- SoP
- その他
- アプリケーションモード
- 施肥灌漑
- 葉面散布
- 土壌
- 作物タイプ
- 畑作作物
- 園芸作物
- 芝生・観賞用植物
- 地域
- アジア太平洋地域
- オーストラリア
- バングラデシュ
- 中国
- インド
- インドネシア
- 日本
- パキスタン
- フィリピン
- タイ
- ベトナム
- その他アジア太平洋地域
- 欧州
- フランス
- ドイツ
- イタリア
- オランダ
- ロシア
- スペイン
- ウクライナ
- 英国
- その他欧州地域
- 中東・アフリカ
- サウジアラビア
- トルコ
- 南アフリカ
- ナイジェリア
- その他中東・アフリカ地域
- 北米
- カナダ
- メキシコ
- 米国
- その他北米地域
- 南米
- アルゼンチン
- ブラジル
- その他南米
- アジア太平洋地域
第6章 競合情勢
- 主要な戦略的動きs
- 市場シェア分析
- 企業概況
- 企業プロファイル
- Nutrien Ltd.
- The Mosaic Company
- Uralkali PJSC
- K+S Aktiengesellschaft
- Israel Chemicals Ltd.
- EuroChem Group AG
- JSC Belaruskali
- Arab Potash Company PLC
- Compass Minerals International Inc.
- Intrepid Potash Inc.
- Sinofert Holdings Ltd.
- Sociedad Quimica y Minera de Chile S.A.
- Yara International ASA
- BHP Group Limited
- Canpotex Limited

