|
|
市場調査レポート
商品コード
1692477
セメント-市場シェア分析、産業動向と統計、成長予測(2025年~2030年)Cement - Market Share Analysis, Industry Trends & Statistics, Growth Forecasts (2025 - 2030) |
||||||

|
|||||||
カスタマイズ可能
適宜更新あり
|
|||||||


| セメント-市場シェア分析、産業動向と統計、成長予測(2025年~2030年) |
|
出版日: 2025年03月18日
発行: Mordor Intelligence
ページ情報: 英文 349 Pages
納期: 2~3営業日
|

全表示
- 概要
- 目次
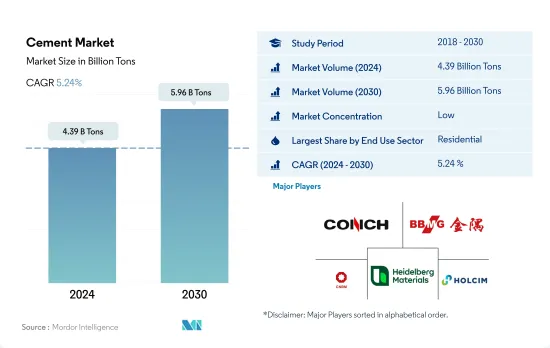
セメント市場規模は2024年に43億9,000万トンと推定され、2030年には59億6,000万トンに達し、予測期間中(2024年~2030年)のCAGRは5.24%で成長すると予測されます。
商業セクターの急成長がセメント需要増につながる
- 2022年のセメント需要は2021年よりも各部門で減少し、その結果、世界全体の需要は3.83%近く減少しました。2023年には全てのセクターで需要が増加すると予測されたため、全体の増加率は2022年よりも0.70%高くなると推定されました。
- 住宅部門は世界最大のセメント消費国であり、ほとんどの国でコンクリート住宅が建設されているため、この部門からの大量のセメント需要に直結しています。セメント市場はアジア太平洋からの需要が最も多いです。この地域は人口が多いため、2022年には世界のセメント総需要の67%を占める。
- インフラは、ほとんどの国がセメント在庫の大部分を利用している分野です。セメントはコンクリートの主原料であり、道路、ダム、港湾などあらゆるインフラ建設に不可欠です。この分野で最大のセメント消費量を占めるのはアジア太平洋で、主に中国、インド、韓国、日本です。これらの国々は、2022年のインフラセクターのセメント需要の90%を占めています。
- 建設活動は、商業部門で最も急速に増加すると予想されます。例えば、全てのセクターの中で商業セクターの新設床面積は、予測期間中(2023年~2030年)に約4.56%のCAGRで最も速く成長すると予測されています。したがって、商業部門からのセメント需要は、予測期間中にCAGR 6.18%で世界的に最も急速に増加し、2030年までに7億6,460万米ドルに達すると予想されます。
建設投資により中東・アフリカでセメント需要が増加
- 2022年、世界のセメント需要は2021年比で3.83%減少したが、これは主にアジア太平洋の6.37%減少による。2023年のセメント需要は比較的堅調に推移し、アジア太平洋はさらに減少すると予測されます。
- アジア太平洋は、2022年5月時点で2,500万米ドル相当のインフラ・プロジェクトが計画されているインドに代表されるように、建設プロジェクト量では常に他国をリードしています。中国とオーストラリアがそれぞれ3位と4位で僅差で続いています。その結果、アジア太平洋は世界のセメント消費の中心地となっています。
- アジア太平洋に続き、中東・アフリカがセメントの重要な消費地として浮上しています。サウジアラビアとアラブ首長国連邦がリードしており、両国の政府がインフラ整備やセクターのイニシアティブに継続的に投資していることが背景にあります。特にアラブ首長国連邦のインフラ投資は、2021年から2022年にかけて82%急増しました。2022年には、サウジアラビアとアラブ首長国連邦がそれぞれ世界のセメント量の12%と3%を占める。
- 予測データによると、中東・アフリカが最も高いセメント需要の伸びを示し、予測期間(2023~2030年)のセメント量のCAGRは7.07%です。特に、サウジアラビアは最近、総額約26億6,000万米ドルに及ぶ協定やMoUを締結し、商業、観光、住宅プロジェクトを強化するための投資ファンドの設立に力を入れており、この地域のセメント需要をさらに促進しています。
世界のセメント市場動向
アジア太平洋における大規模オフィスビル建設プロジェクトの急増により、世界の商業建築専用床面積が増加する見込み
- 2022年、世界の商業用建築物の新設床面積は前年比0.15%の小幅な成長となりました。欧州は12.70%の大幅な伸びで際立っており、これは2030年の二酸化炭素排出目標に合わせてエネルギー効率の高いオフィスビルを推進する動きが原動力となっています。従業員のオフィス復帰に伴い、欧州企業はリース契約を再開し、2022年には450万平方フィートの新規オフィス建設に拍車をかけた。この勢いは2023年も続き、世界の成長率は4.26%と予測されています。
- COVID-19の流行は労働力と資材の不足を引き起こし、商業施設の建設プロジェクトのキャンセルと遅延を招いた。しかし、閉鎖が緩和され、建設活動が再開されるにつれて、2021年の世界の商業施設の新設床面積は11.11%急増し、アジア太平洋が20.98%の成長率でリードしました。
- 今後、世界の商業施設の新設床面積のCAGRは4.56%となります。アジア太平洋のCAGRは5.16%と予測され、他地域を凌駕すると予想されます。この成長の原動力となっているのは、中国、インド、韓国、日本における商業施設建設プロジェクトの活発化です。特に、北京、上海、香港、台北といった中国の主要都市では、Aグレードのオフィススペース建設が加速しています。さらに、インドでは2023年から2025年にかけて、上位7都市で約2,325万平方フィートに及ぶ約60のショッピングモールがオープンする予定です。アジア太平洋全域のこうした取り組みを合計すると、2030年までに商業施設の新規床面積は2022年比で15億6,000万平方フィート増加すると予想されます。
世界の住宅セクターを後押しする手頃な価格の住宅計画への政府投資の増加により、南米の住宅建設が最も急成長すると推定されます。
- 2022年、世界の住宅建築の新規床面積は2021年比で約2億8,900万平方フィート減少しました。これは、土地不足、労働力不足、建設資材価格の持続不可能な高騰が原因で発生した住宅危機に起因します。この危機はアジア太平洋に深刻な影響を与え、2022年の新設床面積は2021年比で5.39%減少しました。しかし2023年には、2030年までに30億人を収容できる手頃な価格の住宅を新たに建設するための資金を調達できる政府投資により、世界の新設床面積は2022年比で3.31%増加すると予測され、より明るい見通しが期待されます。
- COVID-19の流行は景気減速を引き起こし、そのため多くの住宅建設プロジェクトが中止または延期され、2020年の世界の新設床面積は2019年に比べて4.79%減少しました。2021年に規制が解除され、住宅プロジェクトに対する鬱積した需要が解放されると、新設床面積は2020年比で11.22%増加し、欧州が18.28%と最も高い伸びを示し、次いで南米が2021年に2020年比で17.36%増加しました。
- 世界の住宅用新設床面積は予測期間中にCAGR 3.81%を記録し、南米がCAGR 4.05%と最速で発展すると予測されます。2023年に発表されたブラジルのMinha Casa Minha Vidaのような制度やイニシアチブは、いくつかの規制変更とともに発表され、政府は低所得世帯に手頃な価格の住宅を提供するために19億8,000万米ドルの投資を計画しており、同じく2023年に発表されたチリのFOGAESのような制度やイニシアチブは、手頃な価格の住宅のために家族に住宅ローンを提供することを目的としており、新しい住宅の建設を促進します。
セメント産業の概要
セメント市場は細分化されており、上位5社で32.78%を占めています。この市場の主要企業は以下の通り。 Anhui Conch Cement Company Limited, BBMG Corporation, China National Building Material Group Corporation, Heidelberg Materials and Holcim(sorted alphabetically).
その他の特典
- エクセル形式の市場予測(ME)シート
- 3ヶ月のアナリストサポート
目次
第1章 エグゼクティブサマリーと主な調査結果
第2章 レポートのオファー
第3章 イントロダクション
- 調査の前提条件と市場定義
- 調査範囲
- 調査手法
第4章 主要産業動向
- エンドユース分野の動向
- 商業
- 産業・施設
- インフラ
- 住宅
- 主要インフラプロジェクト(現在および発表済み)
- 規制の枠組み
- バリューチェーンと流通チャネル分析
第5章 市場セグメンテーション
- 最終用途分野
- 商業
- 産業・施設
- インフラ
- 住宅
- 製品
- 混合セメント
- 繊維セメント
- 普通ポルトランドセメント
- 白色セメント
- その他
- 地域
- アジア太平洋
- 国別
- オーストラリア
- 中国
- インド
- インドネシア
- 日本
- マレーシア
- 韓国
- タイ
- ベトナム
- その他のアジア太平洋
- 欧州
- 国別
- フランス
- ドイツ
- イタリア
- ロシア
- スペイン
- 英国
- その他の欧州
- 中東・アフリカ
- 国別
- サウジアラビア
- アラブ首長国連邦
- その他の中東・アフリカ
- 北米
- 国別
- カナダ
- メキシコ
- 米国
- 南米
- 国別
- アルゼンチン
- ブラジル
- その他の南米
- アジア太平洋
第6章 競合情勢
- 主要な戦略動向
- 市場シェア分析
- 企業情勢
- 企業プロファイル
- Adani Group
- Anhui Conch Cement Company Limited
- BBMG Corporation
- CEMEX, S.A.B. de C.V.
- Cemros
- China National Building Material Group Corporation
- China Resource Cement Holdings
- CRH
- Dangote Cement Plc.
- Heidelberg Materials
- Holcim
- SIG
- TAIWAN CEMENT LTD.
- UltraTech Cement Ltd.
- Votorantim Cimentos
第7章 CEOへの主な戦略的質問
第8章 付録
- 世界概要
- 概要
- ファイブフォース分析フレームワーク(産業魅力度分析)
- 世界のバリューチェーン分析
- 市場力学(DROs)
- 情報源と参考文献
- 図表一覧
- 主要洞察
- データパック
- 用語集
The Cement Market size is estimated at 4.39 billion Tons in 2024, and is expected to reach 5.96 billion Tons by 2030, growing at a CAGR of 5.24% during the forecast period (2024-2030).
The commercial sector's fast-paced growth is leading to higher cement demand
- The demand for cement across the sectors was reduced in 2022 over 2021, resulting in a nearly 3.83% lower demand worldwide due to very low growth and even declines in the new floor area under construction. As the demand across sectors was projected to rise in 2023, the overall increase was estimated to be 0.70% higher than in 2022.
- The residential sector is the largest consumer of cement in the world, as most countries have concrete homes that directly convert to a large volume of cement demand from this sector. The cement market experiences the highest demand from Asia-Pacific. The region accounted for 67% of the world's total cement demand in 2022, owing to its vast population.
- Infrastructure is the sector in which most countries utilize a significant portion of their cement stock. Cement is among the primary raw materials of concrete, which is essential for all types of infrastructure construction, such as roads, dams, ports, etc. Asia-Pacific accounts for the largest cement consumption in this sector, primarily due to China, India, South Korea, and Japan. These countries together constituted 90% of the region's infrastructure sector's cement demand in 2022.
- Construction activities are expected to rise the fastest in the commercial sector. For instance, the new floor area of the commercial sector among all the sectors is poised to grow with the fastest CAGR of around 4.56% during the forecast period (2023-2030). Hence, the cement demand from the commercial sector is expected to increase the fastest globally at a CAGR of 6.18% during the forecast period and is expected to reach USD 764.6 million by 2030.
The demand for cement to rise in the Middle East & Africa owing to investments in construction
- In 2022, global cement demand saw a 3.83% decline in volume compared to 2021, largely driven by a 6.37% drop in the Asia-Pacific region. Projections suggested that cement demand in 2023 would remain relatively steady, with the Asia-Pacific expected to witness a further decline.
- The Asia-Pacific consistently leads in construction project volumes, exemplified by India's dominance with over USD 25 million worth of infrastructure projects in the pipeline as of May 2022, surpassing other nations. China and Australia followed closely in the third and fourth positions, respectively. Consequently, the Asia-Pacific stands as the global cement consumption hub.
- Following the Asia-Pacific, the Middle East & Africa emerge as a significant consumer of cement. Saudi Arabia and the United Arab Emirates take the lead, buoyed by their governments' consistent investments in infrastructure and sector initiatives. Notably, infrastructure investments in the United Arab Emirates surged by 82% from 2021 to 2022. In 2022, Saudi Arabia and the United Arab Emirates accounted for 12% and 3% of the global cement volume, respectively.
- Anticipated data indicates that the Middle East & Africa will witness the highest cement demand growth, registering a CAGR of 7.07% in volume during the forecast period (2023-2030). Notably, Saudi Arabia's recent agreements and MoUs, totaling nearly USD 2.66 billion, focus on establishing investment funds to bolster commercial, tourism, and residential projects, further fueling the cement demand in the region.
Global Cement Market Trends
Asia-Pacific's surge in large-scale office building projects is set to elevate the global floor area dedicated to commercial construction
- In 2022, the global new floor area for commercial construction witnessed a modest growth of 0.15% from the previous year. Europe stood out with a significant surge of 12.70%, driven by a push for high-energy-efficient office buildings to align with its 2030 carbon emission targets. As employees returned to offices, European companies, resuming lease decisions, spurred the construction of 4.5 million square feet of new office space in 2022. This momentum is poised to persist in 2023, with a projected global growth rate of 4.26%.
- The COVID-19 pandemic caused labor and material shortages, leading to cancellations and delays in commercial construction projects. However, as lockdowns eased and construction activities resumed, the global new floor area for commercial construction surged by 11.11% in 2021, with Asia-Pacific taking the lead with a growth rate of 20.98%.
- Looking ahead, the global new floor area for commercial construction is set to achieve a CAGR of 4.56%. Asia-Pacific is anticipated to outpace other regions, with a projected CAGR of 5.16%. This growth is fueled by a flurry of commercial construction projects in China, India, South Korea, and Japan. Notably, major Chinese cities like Beijing, Shanghai, Hong Kong, and Taipei are gearing up for an uptick in Grade A office space construction. Additionally, India is set to witness the opening of approximately 60 shopping malls, spanning 23.25 million square feet, in its top seven cities between 2023 and 2025. Collectively, these endeavors across Asia-Pacific are expected to add a staggering 1.56 billion square feet to the new floor area for commercial construction by 2030, compared to 2022.
South America's estimated fastest growth in residential constructions due to increasing government investments in schemes for affordable housing to boost the global residential sector
- In 2022, the global new floor area for residential construction declined by around 289 million square feet compared to 2021. This can be attributed to the housing crisis generated due to the shortage of land, labor, and unsustainably high construction materials prices. This crisis severely impacted Asia-Pacific, where the new floor area declined 5.39% in 2022 compared to 2021. However, a more positive outlook is expected in 2023 as the global new floor area is predicted to grow by 3.31% compared to 2022, owing to government investments that can finance the construction of new affordable homes capable of accommodating 3 billion people by 2030.
- The COVID-19 pandemic caused an economic slowdown, due to which many residential construction projects got canceled or delayed, and the global new floor area declined by 4.79% in 2020 compared to 2019. As the restrictions were lifted in 2021 and pent-up demand for housing projects was released, new floor area grew 11.22% compared to 2020, with Europe having the highest growth of 18.28%, followed by South America, which rose 17.36% in 2021 compared to 2020.
- The global new floor area for residential construction is expected to register a CAGR of 3.81% during the forecast period, with South America predicted to develop at the fastest CAGR of 4.05%. Schemes and initiatives like the Minha Casa Minha Vida in Brazil announced in 2023 with a few regulatory changes, for which the government plans an investment of USD 1.98 billion to provide affordable housing units for low-income families, and the FOGAES in Chile also publicized in 2023, with an initial investment of USD 50 million, are aimed at providing mortgage loans to families for affordable housing and will encourage the construction of new residential units.
Cement Industry Overview
The Cement Market is fragmented, with the top five companies occupying 32.78%. The major players in this market are Anhui Conch Cement Company Limited, BBMG Corporation, China National Building Material Group Corporation, Heidelberg Materials and Holcim (sorted alphabetically).
Additional Benefits:
- The market estimate (ME) sheet in Excel format
- 3 months of analyst support
TABLE OF CONTENTS
1 EXECUTIVE SUMMARY & KEY FINDINGS
2 REPORT OFFERS
3 INTRODUCTION
- 3.1 Study Assumptions & Market Definition
- 3.2 Scope of the Study
- 3.3 Research Methodology
4 KEY INDUSTRY TRENDS
- 4.1 End Use Sector Trends
- 4.1.1 Commercial
- 4.1.2 Industrial and Institutional
- 4.1.3 Infrastructure
- 4.1.4 Residential
- 4.2 Major Infrastructure Projects (current And Announced)
- 4.3 Regulatory Framework
- 4.4 Value Chain & Distribution Channel Analysis
5 MARKET SEGMENTATION (includes market size, forecasts up to 2030 and analysis of growth prospects.)
- 5.1 End Use Sector
- 5.1.1 Commercial
- 5.1.2 Industrial and Institutional
- 5.1.3 Infrastructure
- 5.1.4 Residential
- 5.2 Product
- 5.2.1 Blended Cement
- 5.2.2 Fiber Cement
- 5.2.3 Ordinary Portland Cement
- 5.2.4 White Cement
- 5.2.5 Other Types
- 5.3 Region
- 5.3.1 Asia-Pacific
- 5.3.1.1 By Country
- 5.3.1.1.1 Australia
- 5.3.1.1.2 China
- 5.3.1.1.3 India
- 5.3.1.1.4 Indonesia
- 5.3.1.1.5 Japan
- 5.3.1.1.6 Malaysia
- 5.3.1.1.7 South Korea
- 5.3.1.1.8 Thailand
- 5.3.1.1.9 Vietnam
- 5.3.1.1.10 Rest of Asia-Pacific
- 5.3.2 Europe
- 5.3.2.1 By Country
- 5.3.2.1.1 France
- 5.3.2.1.2 Germany
- 5.3.2.1.3 Italy
- 5.3.2.1.4 Russia
- 5.3.2.1.5 Spain
- 5.3.2.1.6 United Kingdom
- 5.3.2.1.7 Rest of Europe
- 5.3.3 Middle East and Africa
- 5.3.3.1 By Country
- 5.3.3.1.1 Saudi Arabia
- 5.3.3.1.2 United Arab Emirates
- 5.3.3.1.3 Rest of Middle East and Africa
- 5.3.4 North America
- 5.3.4.1 By Country
- 5.3.4.1.1 Canada
- 5.3.4.1.2 Mexico
- 5.3.4.1.3 United States
- 5.3.5 South America
- 5.3.5.1 By Country
- 5.3.5.1.1 Argentina
- 5.3.5.1.2 Brazil
- 5.3.5.1.3 Rest of South America
- 5.3.1 Asia-Pacific
6 COMPETITIVE LANDSCAPE
- 6.1 Key Strategic Moves
- 6.2 Market Share Analysis
- 6.3 Company Landscape
- 6.4 Company Profiles
- 6.4.1 Adani Group
- 6.4.2 Anhui Conch Cement Company Limited
- 6.4.3 BBMG Corporation
- 6.4.4 CEMEX, S.A.B. de C.V.
- 6.4.5 Cemros
- 6.4.6 China National Building Material Group Corporation
- 6.4.7 China Resource Cement Holdings
- 6.4.8 CRH
- 6.4.9 Dangote Cement Plc.
- 6.4.10 Heidelberg Materials
- 6.4.11 Holcim
- 6.4.12 SIG
- 6.4.13 TAIWAN CEMENT LTD.
- 6.4.14 UltraTech Cement Ltd.
- 6.4.15 Votorantim Cimentos
7 KEY STRATEGIC QUESTIONS FOR CONCRETE, MORTARS AND CONSTRUCTION CHEMICALS CEOS
8 APPENDIX
- 8.1 Global Overview
- 8.1.1 Overview
- 8.1.2 Porter's Five Forces Framework (Industry Attractiveness Analysis)
- 8.1.3 Global Value Chain Analysis
- 8.1.4 Market Dynamics (DROs)
- 8.2 Sources & References
- 8.3 List of Tables & Figures
- 8.4 Primary Insights
- 8.5 Data Pack
- 8.6 Glossary of Terms

