
分散型エネルギー源管理システム:市場シェア分析、産業動向・統計、成長予測(2025年~2030年)
Distributed Energy Resource Management System - Market Share Analysis, Industry Trends & Statistics, Growth Forecasts (2025 - 2030)- 発行日
- ページ情報
- 英文 200 Pages
- 納期
- 2~3営業日
- 商品コード
- 1690711
- カスタマイズ可能 お客様のご希望に応じて、既存データの加工や未掲載情報(例:国別セグメント)の追加などの対応が可能です。詳細はお問い合わせください。
- 適宜更新あり 本レポートは最新情報反映のため適宜更新し、内容構成変更を行う場合があります。ご検討の際はお問い合わせください。
- 翻訳ツール提供対象 PDF対応AI翻訳ツールの無料貸し出しサービスのご利用が可能です
概要
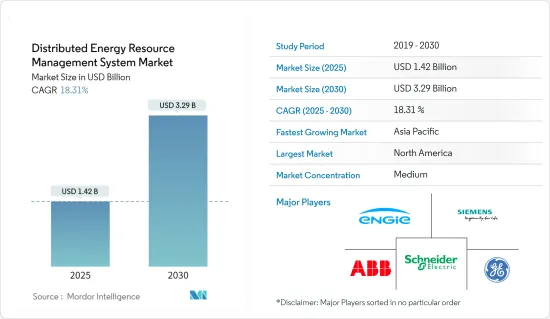
分散型エネルギー源管理システムの市場規模は、2025年に14億2,000万米ドルと推定され、予測期間中(2025-2030年)のCAGRは18.31%で、2030年には32億9,000万米ドルに達すると予測されます。
主なハイライト
- 中期的には、再生可能エネルギーベースの分散型発電へのシフトの増加やスマートグリッドへの投資の増加といった要因が、予測期間中の分散型エネルギー源管理システム(DERGMS)市場の最も大きな促進要因になると予想されます。
- 一方で、DERMSの設置には高い初期コストがかかります。これは予測期間中、分散型エネルギー源管理システム(DERMS)市場に脅威をもたらす可能性があります。
- とはいえ、アジア太平洋やアフリカの低電化地域での分散型発電の採用や、サービスとしてのマイクログリッドの開発は、市場の機会として作用すると予想されます。
- 北米は、分散型発電技術に対する政府の支援政策とエネルギーミックスにおける再生可能エネルギーの割合の増加により、予測期間中最大の市場になると予想されます。
分散型エネルギー源管理システム市場動向
市場を独占する太陽光発電(PV)セグメント
- 太陽光発電は、屋上や地上に設置することができ、世界最大の分散型電源の一つです。このセグメントは、平均設置コスト(米ドル/キロワット)の低下に支えられた設置容量の増加により、分散型エネルギー源管理システムを牽引すると予想されます。分散型エネルギー源管理システムは、太陽光発電(PV)の出力をリアルタイムで制限し、逆潮流や局所的な高電圧を防ぐ。
- 分散型発電は経済的に実行可能であり、同等の従来型設備よりも大幅に少ない資本で済みます。太陽光発電所と分散型太陽光発電の両方に対する税制優遇措置が、世界的に分散型太陽光発電を後押ししています。
- 国際再生可能エネルギー機関(International Renewable Energy Agency)によると、世界の太陽光発電設備容量は2022年に1046.61GWに達します。前年比年間成長率は22.4%で、政府の太陽光発電支援目標もあり、太陽光発電容量は今後も増加すると予想され、それが分散型エネルギー源管理システム市場を牽引する可能性があります。
- 太陽光発電(PV)技術は、今後数年間で、風力や水力を大きく上回り、自然エネルギーで最も大きな年間容量増加を占めると予想されています。IEAによると、太陽光発電は2022年に26%増加し、1300TWhに達し、すべての再生可能技術の中で最大の絶対的な発電量の伸びを示します。太陽光発電のコストも、市場に設備があふれ、過去6年間で劇的に低下しました。ソーラーパネルの価格も指数関数的に低下し、太陽光発電システムの設置が世界的に増加しました。
- 住宅や商業・産業(C&I)分野では、太陽光発電は多くの場合、エンドユーザーが設置した屋根上太陽光発電(PV)によって行われています。発電用の太陽光発電システムは、エネルギーを使用する住宅や商業ビル、工業プラントの屋上に設置されます。個々の所有者が生産した余剰エネルギーは、電力会社に売却されることもあります。
- 世界のいくつかの政府は、国のエネルギー・ミックスに占める太陽エネルギーの割合を増やすために、いくつかの取り組みや政策を導入しています。このような政策は、研究対象の市場にプラスの影響を与えると期待されています。例えばインドでは、新・再生可能エネルギー省が2019年に「系統連系屋根上太陽光発電スキーム(フェーズII)」を発表しました。このスキームは、住宅の屋根に太陽光発電パネルを設置して太陽光発電を行うことを目的としています。インド政府は以前、2022年までに40,000MWの屋上太陽光発電(RTS)を設置するという目標を掲げていました。
- しかし、2023年1月、インドの屋上太陽光発電(RTS)プログラムは4年間の延長を受け、2026年3月までに40GWの屋上太陽光発電(RTS)容量追加という目標を達成することを目指しました。このプログラムにより、インドの太陽エネルギー総容量目標は大幅に達成される見込みです。
- このため、太陽光発電への投資が増加し、政府の規制が変化し、今後のプロジェクトも相まって、予測期間中は太陽光発電分野が最大市場になると予想されます。
市場を独占する北米
- 北米のDERMS市場は、100万台以上の分散型発電ユニットを有する米国とカナダに支えられ、予測期間中最大の市場になると予想されます。
- 十分な発電量があり、トランスミッションや配電ネットワークが利用可能であるにもかかわらず、この地域では洪水や暴風雨などの自然災害により停電が発生する地域があります。分散型エネルギーシステムを調整するために、DERMSのような遠隔電力システムを利用することが、この問題を軽減する可能性が高いです。
- 米国は再生可能エネルギー目標達成のためのロードマップを設定しています。連邦政府と多くの州政府は、太陽エネルギーの導入を促進する政策とプログラムを実施しています。こうした優遇措置には、税額控除、補助金、リベート、再生可能エネルギー・ポートフォリオ基準などがあり、電力会社はエネルギーの一定割合を太陽光などの再生可能エネルギー源から調達する必要があります。
- さらに、太陽光発電プロジェクトの増加に伴い、国内では分散型エネルギー源管理システムの需要が高まっています。
- 米国エネルギー情報局(EIA)によると、同国の小規模太陽光発電容量は、この推計を発表し始めた2014年の7.3GWから、2022年には39.5GWに増加しました。小規模太陽光発電は、米国の全太陽光発電容量の約3分の1を占めています。
- 国際エネルギー機関(IEA)によると、同国における電気自動車の販売台数は、2021年から2022年にかけて近年大幅に増加しています。PHEVとBEVの累積販売台数は2万7,000台以上増加し、過去10年間では販売台数が約60倍増加したのに対し、同国では電気自動車の普及が進んでいることを示しています。
- 同様に、Electric Autonomy社がまとめたデータによると、カナダで公的に利用可能な電気自動車(EV)充電インフラは着実に増加しています。2023年3月1日現在、カナダ天然資源省(NRCan)の統計によると、カナダのEVユーザーは全国8,732カ所の充電ステーションで少なくとも2万478個の充電コネクターを利用できます。これは、2022年の初めから30%という大幅な伸び率に相当します。
- したがって、これらの要因から、予測期間中、北米が分散型エネルギー源管理システムの最大市場になる可能性が高いです。
分散型エネルギー源管理システム(DERMS)産業概要
分散型エネルギー源管理システム市場は細分化されています。同市場の主要企業(順不同)には、General Electric Company、Siemens AG、ABB Ltd、Schneider Electric SE、Engie SAなどがあります。
その他の特典:
- エクセル形式の市場予測(ME)シート
- 3ヶ月間のアナリスト・サポート
目次
第1章 イントロダクション
- 調査範囲
- 市場の定義
- 調査の前提
第2章 エグゼクティブサマリー
第3章 調査手法
第4章 市場概要
- イントロダクション
- 2029年までの市場規模と需要予測
- 最近の動向と開発
- 政府の規制と政策
- 市場力学
- 促進要因
- 再生可能エネルギーベースの分散型発電へのシフトの増加
- スマートグリッドへの投資の増加
- 抑制要因
- 集中型送電網の拡張とアップグレード
- 促進要因
- サプライチェーン分析
- ポーターのファイブフォース分析
- 供給企業の交渉力
- 消費者の交渉力
- 新規参入業者の脅威
- 代替品の脅威
- 競争企業間の敵対関係の強さ
第5章 市場セグメンテーション
- 技術別
- 太陽光発電(PV)
- 電気自動車
- マイクログリッド
- その他の技術
- エンドユーザー別
- 産業
- 住宅
- 商業
- 地域別
- 北米
- 米国
- カナダ
- その他北米
- 欧州
- ドイツ
- イタリア
- フランス
- 英国
- その他欧州
- アジア太平洋
- インド
- 中国
- 日本
- 韓国
- その他アジア太平洋地域
- 南米
- ブラジル
- アルゼンチン
- その他南米
- 中東・アフリカ
- アラブ首長国連邦
- サウジアラビア
- サウジアラビア
- その他中東とアフリカ
- 北米
第6章 競合情勢
- M&A、合弁事業、提携、協定
- 主要企業の戦略
- 企業プロファイル
- General Electric Company
- Siemens AG
- ABB Ltd
- Schneider Electric SE
- Oracle Corporation
- Uplight Inc.
- Doosan Corporation
- Open Access Technology International Inc.
- Mitsubishi Electric Corporation
- Emerson Electric Co.
- Engie SA
第7章 市場機会と今後の動向
- Micro Grid As A Service
目次
Product Code: 71080
The Distributed Energy Resource Management System Market size is estimated at USD 1.42 billion in 2025, and is expected to reach USD 3.29 billion by 2030, at a CAGR of 18.31% during the forecast period (2025-2030).
Key Highlights
- Over the medium term, factors such as an increasing shift toward renewables-based distributed power generation and rising investments in smart grid are expected to be some of the most significant drivers for the distributed energy resource management system (DERMS) market during the forecast period.
- On the other hand, there is a high initial cost of setting up DERMS. This may pose a threat to the distributed energy resource management system (DERMS) market during the forecast period.
- Nevertheless, the adoption of distributed power generation in the low-electrified areas of Asia-Pacific and Africa and the development of microgrids as a service are expected to act as opportunities in the market.
- North America is expected to be the largest market during the forecast period, owing to supportive government policies for distributed power generation technology and the increasing share of renewables in the energy mix.
Distributed Energy Resource Management System Market Trends
Solar Photovoltaic (PV) Segment to Dominate the Market
- Solar PV can be located on rooftops or ground-mounted and is one of the largest distributed power sources globally. This segment is expected to drive the distributed energy resources management system with increased installed capacity supported by decreasing average installed cost (USD/kilowatt). Distributed energy resource management systems limit real-time photovoltaic (PV) output to prevent reverse flows and high local voltages.
- Distributed generation is economically viable, requiring significantly less capital than an equivalent traditional facility. Tax incentives for both solar stations and distributed solar generation are driving distributed solar PV globally.
- According to the International Renewable Energy Agency, the global solar PV installed capacity accounted for 1,046.61 GW in 2022. With an annual growth rate of 22.4% compared to the previous year and supportive solar PV targets of the government, solar PV capacity is expected to increase in the future, which, in turn, may drive the distributed energy resource management system market.
- Solar photovoltaic (PV) technology is expected to account for renewables' most considerable annual capacity additions in the coming years, well above wind and hydro as well. According to IEA, solar PV generation increased by 26% in 2022, reaching 1300 TWh, representing the largest absolute generation growth of all renewable technologies. The cost of solar photovoltaics has also reduced dramatically in the past six years as the market was flooded with equipment. The cost of solar panels also dropped exponentially, leading to increased solar PV system installations globally.
- In the residential and commercial & industrial (C&I) sector, solar power is often generated by rooftop solar photovoltaics (PV) deployed by end users. Solar PV systems for power generation are installed on rooftops of houses and commercial buildings or industrial plants that use the energy. Excess energy produced by individual owners is sometimes sold to power companies.
- Several governments around the world have introduced several initiatives and policies to increase the contribution of solar energy to the country's energy mix. Such policies are expected to have a positive impact on the market studied. For instance, in India, the Ministry of New and Renewable Energy announced the Grid-connected Rooftop Solar Scheme (Phase II) in 2019. The scheme aims to produce solar power by installing solar PV panels on the roofs of houses. The Government of India previously set the goal of installing 40,000 MW of Rooftop Solar (RTS) Power by 2022.
- However, in January 2023, India's Rooftop Solar (RTS) program received a four-year extension and aimed to accomplish its target of 40 GW rooftop solar (RTS) capacity addition by March 2026. This program is expected to achieve India's total solar energy capacity target significantly.
- Therefore, with increased investment in solar PV and changing government regulations, coupled with upcoming projects, the solar PV segment is expected to be the largest market during the forecast period.
North America to Dominate the Market
- The North American DERMS market is further expected to be the largest market during the forecast period, supported by the United States and Canada, which have more than a million distributed generation units.
- Despite enough power generation and accessibility of transmission and distribution networks, power outages are caused in some areas of the region due to natural disasters, such as flooding and storms. The use of remote power systems, such as DERMS, to regulate distributed energy systems is likely to mitigate the issue.
- The United States has set a road map to achieve renewable energy targets. The federal government and many state governments have implemented policies and programs to promote the adoption of solar energy. These incentives include tax credits, grants, rebates, and renewable portfolio standards that need utilities to receive a certain percentage of their energy from renewable sources like solar.
- Moreover, as the number of solar projects increases, the companies increase demand for distributed energy resources management systems in the country.
- According to the US Energy Information Administration (EIA), the country's small-scale solar capacity grew from 7.3 GW in 2014, when they began publishing these estimates, to 39.5 GW in 2022. Small-scale solar accounts for approximately one-third of all solar capacity in the United States.
- According to the International Energy Agency (IEA), electric vehicle sales in the country have increased significantly in recent years between 2021 and 2022; the cumulative sales of PHEV and BEV increased by more than 27,000 units, whereas in the past decade, sales increased by almost 60 folds signifying the increasing adoption of electric vehicles in the country.
- Similarly, Canada's publicly available electric vehicle (EV) charging infrastructure is on a steady rise, as indicated by data compiled by Electric Autonomy. As of March 1, 2023, Natural Resources Canada (NRCan) statistics revealed that Canadian EV users can avail themselves of at least 20,478 charging connectors distributed across 8,732 charging station sites nationwide. This represents a substantial percentage growth rate of 30% since the beginning of 2022.
- Therefore, based on these factors, North America is likely to be the largest market for distributed energy resource management systems during the forecast period.
Distributed Energy Resource Management System (DERMS) Industry Overview
The distributed energy resource management system market is semi-fragmented. Some of the major players in the market (in no particular order) include General Electric Company, Siemens AG, ABB Ltd, Schneider Electric SE, and Engie SA.
Additional Benefits:
- The market estimate (ME) sheet in Excel format
- 3 months of analyst support
TABLE OF CONTENTS
1 INTRODUCTION
- 1.1 Scope of the Study
- 1.2 Market Definition
- 1.3 Study Assumptions
2 EXECUTIVE SUMMARY
3 RESEARCH METHODOLOGY
4 MARKET OVERVIEW
- 4.1 Introduction
- 4.2 Market Size and Demand Forecast, till 2029
- 4.3 Recent Trends and Developments
- 4.4 Government Policies and Regulations
- 4.5 Market Dynamics
- 4.5.1 Drivers
- 4.5.1.1 Increasing Shift Toward Renewables-based Distributed Power Generation
- 4.5.1.2 Rising Investments in Smart Grid
- 4.5.2 Restraints
- 4.5.2.1 Expansion and Upgradation of Centralized Grid
- 4.5.1 Drivers
- 4.6 Supply Chain Analysis
- 4.7 Porter's Five Forces Analysis
- 4.7.1 Bargaining Power of Suppliers
- 4.7.2 Bargaining Power of Consumers
- 4.7.3 Threat of New Entrants
- 4.7.4 Threat of Substitute Products and Services
- 4.7.5 Intensity of Competitive Rivalry
5 MARKET SEGMENTATION
- 5.1 By Technology
- 5.1.1 Solar Photovoltaic (PV)
- 5.1.2 Electric Vehicles
- 5.1.3 Microgrids
- 5.1.4 Other Technologies
- 5.2 By End User
- 5.2.1 Industrial
- 5.2.2 Residential
- 5.2.3 Commercial
- 5.3 By Geography
- 5.3.1 North America
- 5.3.1.1 United States
- 5.3.1.2 Canada
- 5.3.1.3 Rest of North America
- 5.3.2 Europe
- 5.3.2.1 Germany
- 5.3.2.2 Italy
- 5.3.2.3 France
- 5.3.2.4 United Kingdom
- 5.3.2.5 Rest of Europe
- 5.3.3 Asia-Pacific
- 5.3.3.1 India
- 5.3.3.2 China
- 5.3.3.3 Japan
- 5.3.3.4 South Korea
- 5.3.3.5 Rest of Asia-Pacific
- 5.3.4 South America
- 5.3.4.1 Brazil
- 5.3.4.2 Argentina
- 5.3.4.3 Rest of South America
- 5.3.5 Middle East and Africa
- 5.3.5.1 United Arab Emirates
- 5.3.5.2 Saudi Arabia
- 5.3.5.3 Saudi Arabia
- 5.3.5.4 Rest of Middle East and Africa
- 5.3.1 North America
6 COMPETITIVE LANDSCAPE
- 6.1 Mergers and Acquisitions, Joint Ventures, Collaborations, and Agreements
- 6.2 Strategies Adopted by Leading Players
- 6.3 Company Profiles
- 6.3.1 General Electric Company
- 6.3.2 Siemens AG
- 6.3.3 ABB Ltd
- 6.3.4 Schneider Electric SE
- 6.3.5 Oracle Corporation
- 6.3.6 Uplight Inc.
- 6.3.7 Doosan Corporation
- 6.3.8 Open Access Technology International Inc.
- 6.3.9 Mitsubishi Electric Corporation
- 6.3.10 Emerson Electric Co.
- 6.3.11 Engie SA
7 MARKET OPPORTUNITIES AND FUTURE TRENDS
- 7.1 Micro Grid As A Service
分散型エネルギー源管理システム:市場シェア分析、産業動向・統計、成長予測(2025年~2030年)
- 発行日
- 発行
- Mordor Intelligence
- ページ情報
- 英文 200 Pages
- 納期
- 2~3営業日


