
アゾトバクター:市場シェア分析、産業動向・統計、成長予測(2025年~2030年)
Azotobacter - Market Share Analysis, Industry Trends & Statistics, Growth Forecasts (2025 - 2030)- 発行日
- ページ情報
- 英文 277 Pages
- 納期
- 2~3営業日
- 商品コード
- 1687725
- カスタマイズ可能 お客様のご希望に応じて、既存データの加工や未掲載情報(例:国別セグメント)の追加などの対応が可能です。詳細はお問い合わせください。
- 適宜更新あり 本レポートは最新情報反映のため適宜更新し、内容構成変更を行う場合があります。ご検討の際はお問い合わせください。
- 翻訳ツール提供対象 PDF対応AI翻訳ツールの無料貸し出しサービスのご利用が可能です
概要
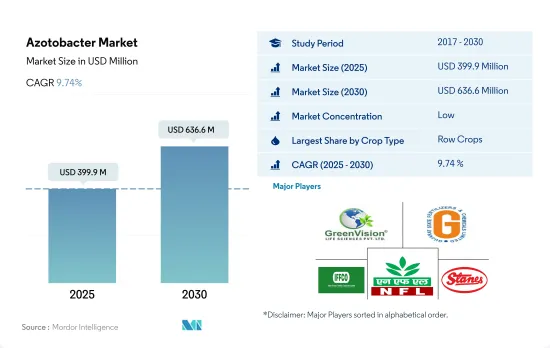
アゾトバクターの市場規模は2025年に3億9,990万米ドルと推定され、2030年には6億3,660万米ドルに達すると予測され、予測期間中(2025-2030年)にCAGR 9.74%で成長すると予測されています。
- アゾトバクターは、宿主植物に依存することなく好気性または嫌気性で生物学的窒素固定を行う自由生活細菌を指します。アゾトバクターバイオ肥料は、2022年の世界のバイオ肥料市場で11.3%のシェアを占めました。
- 世界の有機作物栽培面積は、過去期間中に29.1%増加し、2017年の1,110万ヘクタールから2022年には1,440万ヘクタールに増加しました。2022年には、連作作物が最大の有機栽培面積を占め、シェアは67.5%、次いで園芸作物が17.5%、換金作物が15.1%でした。
- 稲、大麦、トウモロコシ、小麦、菜種、ヒマワリ、大豆、その他主要な畑作物が世界中で栽培されています。世界のアゾトバクター市場は耕作作物が圧倒的に多く、2022年には市場の76.9%を占める。アゾトバクターバイオ肥料は、水稲、小麦、キビ、綿花、トマト、キャベツ、マスタード、ヒマワリなどの非レギューム作物に有用です。
- 様々な無機肥料の代わりに、あるいは無機肥料と併用してアゾトバクターバイオ肥料を施用することで、様々な園芸作物の果実収量を増加させることができるため、園芸作物におけるアゾトバクターの使用量が増加しています。収量と結実の増加は、窒素固定能力によるものだけでなく、アゾトバクターが植物の葉を経由して根から花への他の栄養素の転流を増加させる能力によるものです。
- 窒素肥料の過剰施用は、富栄養化、温室効果、酸性雨などの環境問題に関連しています。アゾトバクターバイオ肥料は、過剰投与することなく植物に必要な窒素を供給することができます。これらの要因によって、世界のアゾトバクターバイオ肥料市場は2023年から2029年の間にCAGR 9.5%を記録すると予想されています。
- 窒素(N)は作物の収量を増やすために不可欠であり、作物の草食動物に対する防御能力を変えることができます。窒素肥料は、植物の収量と経済的収益性を最大化するために、必要以上に頻繁に施用されます。アゾトバクターは、窒素肥料の施用を減らすための実行可能な選択肢です。
- アジア太平洋はアゾトバクターバイオ肥料の最大の地域市場であり、2022年には1億3,820万米ドルの市場規模を占める。中国とインドがアジア太平洋の主要な国別市場で、アゾトバクター市場におけるシェアはそれぞれ99.2%と0.2%です。中国は世界で最も窒素(N)肥料の消費率が高いです。窒素肥料の使用は中国の食糧生産に大いに役立っているが、同時に生物地球化学的サイクルにかつてない変化をもたらし、陸域および水域の生態系を危機に陥れています。中国の肥料政策改革は、窒素肥料の使用とその結果生じる窒素汚染を削減するのに役立ちます。アゾトバクターバイオ肥料は、合成窒素ベースの肥料の使用を削減する可能性も秘めています。
- インドでは、油糧種子と油糧パームに関する国家ミッション(NMOOP)の下、バイオ肥料、供給リゾビウム培養物/リン酸可溶化細菌/亜鉛可溶化細菌/アザトバクター/菌根菌、バーミコンポストなどのさまざまな要素に対して、1ヘクタール当たり300インドルピーの50%補助金を含む資金援助が行われています。これらの要因は、2023年から2029年にかけてアゾトバクターバイオ肥料の市場を押し上げると予想されます。
- 北米は世界のアゾトバクター市場で2番目に大きい地域セグメントです。米国とカナダは有機農業への取り組みにより北米市場を独占しています。
世界のアゾトバクター市場動向
北米と欧州では、有機農業に対する意識の高まりと政府の取り組みにより、有機農業の生産量が過去最高を記録しています。
- 有機農業は持続可能な食料システムに大きく貢献するものとして台頭しており、世界187ヵ国で実践されています。2021年現在、世界の有機農地は7,230万haで、2018年から2021年にかけて全地域で平均2.9%増加しています。有機耕地は1,440万haで、有機農地全体の19.9%を占めています。
- 有機農業の最も強力な市場は北米と欧州で、世界の有機耕地の41.0%を占めています。2022年には、欧州には650万haの有機耕地があり、これは有機耕地全体の44.1%に相当します。北米と欧州で有機栽培されている最も重要な作物は、リンゴ、イチゴ、穀物、オリーブです。
- アジア太平洋の新興諸国も有機農業運動に参加し、国内需要を満たす新鮮な有機農産物の生産と供給で自給自足しつつあります。有機農業の動向はアジア太平洋で勢いを増しており、同地域では2017年から2022年にかけて有機耕地面積が18.8%増加します。この地域の政府による主要な取り組みも、有機農業の拡大傾向に重要な役割を果たしています。例えば、日本の食料・農業・農村基本計画は、2030年までに有機農家と有機農地の数を3倍に増やすことを目標としています。
- 有機農業の成長の原動力となっているのは、土壌の健康を促進し、環境への影響を低減し、より健康的な食品を生産するといった、有機農業の利点に対する意識の高まりです。
有機食品の1人当たり支出は主に米国とドイツで観察されるが、これはより健康的で持続可能な食品に対する消費者の需要に起因します。
- オーガニック食品市場は過去数年間に著しい成長を遂げ、世界の売上高は2012年の708億米ドルから2020年には1,206億米ドルに達します。有機食品への動向は、より健康的で持続可能な食品の選択肢を求める消費者需要の高まりや、従来型農業が環境に与える影響に対する意識の高まりなど、いくつかの要因に後押しされています。世界の有機食品市場は、今後数年間も成長傾向が続くと予想されます。
- オーガニック・トレード協会が2021年に実施した調査によると、同年のオーガニック果物・野菜の売上高は約4.5%増加し、オーガニック売上高全体の15%を占めました。オーガニック製品への平均支出額では北米が市場を独占しており、米国の1人当たり支出額は2021年に186.7米ドルに達し、北米諸国の中で最も高いです。欧州も有機食品市場で大きな成長が見込まれており、2021年の1人当たり支出額が最も高いのはドイツで75.6米ドルです。
- 有機食品市場は、消費者の可処分所得の高い先進諸国が依然として支配的であるが、新興諸国でも成長が見込まれます。例えば、アジア太平洋地域では労働者階級が増加しており、有機食品を入手しやすく手頃な価格で購入できるようになっているため、市場の拡大に寄与する可能性があります。
アゾトバクター産業の概要
アゾトバクター市場は細分化されており、上位5社で14.24%を占めています。この市場の主要企業は以下の通りです。 Green Vision Life Sciences, Gujarat State Fertilizers & Chemicals Ltd, Indian Farmers Fertiliser Cooperative Limited, National Fertilizers Limited and T.Stanes and Company Limited(sorted alphabetically).
その他の特典
- エクセル形式の市場予測(ME)シート
- 3ヶ月のアナリストサポート
目次
第1章 エグゼクティブサマリーと主な調査結果
第2章 レポートのオファー
第3章 イントロダクション
- 調査の前提条件と市場定義
- 調査範囲
- 調査手法
第4章 主要産業動向
- 有機栽培面積
- 一人当たりのオーガニック製品への支出
- 規制の枠組み
- アルゼンチン
- オーストラリア
- ブラジル
- カナダ
- 中国
- エジプト
- フランス
- ドイツ
- インド
- インドネシア
- イタリア
- 日本
- メキシコ
- オランダ
- ナイジェリア
- フィリピン
- ロシア
- 南アフリカ
- スペイン
- タイ
- トルコ
- 英国
- 米国
- ベトナム
- バリューチェーンと流通チャネル分析
第5章 市場セグメンテーション
- 作物タイプ
- 換金作物
- 園芸作物
- 耕作作物
- 地域
- アフリカ
- 国別
- エジプト
- ナイジェリア
- 南アフリカ
- その他のアフリカ
- アジア太平洋
- 国別
- オーストラリア
- 中国
- インド
- インドネシア
- 日本
- フィリピン
- タイ
- ベトナム
- その他アジア太平洋地域
- 欧州
- 国別
- フランス
- ドイツ
- イタリア
- オランダ
- ロシア
- スペイン
- トルコ
- 英国
- その他欧州
- 中東
- 国別
- イラン
- サウジアラビア
- その他中東
- 北米
- 国別
- カナダ
- メキシコ
- 米国
- その他北米地域
- 南米
- 国別
- アルゼンチン
- ブラジル
- その他南米
- アフリカ
第6章 競合情勢
- 主要な戦略動向
- 市場シェア分析
- 企業情勢
- 企業プロファイル.
- Ezzy Bioscience Pvt. Ltd
- Green Vision Life Sciences
- Gujarat State Fertilizers & Chemicals Ltd
- Indian Farmers Fertiliser Cooperative Limited
- Indogulf BioAg LLC(Biotech Division of Indogulf Company)
- IPL Biologicals Limited
- Jaipur Bio Fertilizers
- National Fertilizers Limited
- Samriddhi Crops India Pvt. Ltd
- T.Stanes and Company Limited
第7章 CEOへの主な戦略的質問
第8章 付録
- 世界概要
- 概要
- ファイブフォース分析フレームワーク
- 世界のバリューチェーン分析
- 市場力学(DROs)
- 情報源と参考文献
- 図表一覧
- 主要洞察
- データパック
- 用語集
目次
The Azotobacter Market size is estimated at 399.9 million USD in 2025, and is expected to reach 636.6 million USD by 2030, growing at a CAGR of 9.74% during the forecast period (2025-2030).
- Azotobacter refers to free-living bacteria that perform biological nitrogen fixation aerobically or anaerobically without depending on the host plants. Azotobacter biofertilizers accounted for an 11.3% share of the global biofertilizers market in 2022.
- The global area under organic crop cultivation increased by 29.1% during the historical period, rising from 11.1 million hectares in 2017 to 14.4 million hectares in 2022. In 2022, row crops accounted for the largest area under organic cultivation, with a 67.5% share, followed by horticulture crops and cash crops, with shares of 17.5% and 15.1%, respectively.
- Rice, barley, corn, wheat, rapeseed, sunflower, soybean, and other major field crops are grown worldwide. Row crops dominate the global Azotobacter market, accounting for 76.9% of the market in 2022. Azotobacter biofertilizers are useful for non-leguminous crops like paddy, wheat, millet, cotton, tomato, cabbage, mustard, and sunflower.
- The usage of Azotobacter in horticulture crops is increasing as the application of Azotobacter biofertilizer by replacing or in conjunction with various inorganic fertilizers is capable of increasing the fruit yield in various horticultural crops. The increase in yield and fruit set is not only attributed to its nitrogen-fixing ability but also due to Azotobacter's ability to increase the translocation of other nutrients from root to flower via plant foliage.
- Excessive nitrogen fertilizer application has been linked to environmental issues such as eutrophication, the greenhouse effect, and acid rain. Azotobacter biofertilizers can provide plants with the necessary nitrogen without overdosing them. These factors are anticipated to drive the global Azotobacter biofertilizers market to record a CAGR of 9.5% between 2023 and 2029.
- Nitrogen (N) is essential for increasing crop yields and can alter crops' ability to defend against herbivores. N-fertilizer is applied more frequently than required to maximize plant yield and economic profitability. Azotobacter is a viable option for reducing N fertilizer application.
- Asia-Pacific is the largest regional market for Azotobacter biofertilizers, accounting for a value of USD 138.2 million in 2022. China and India are the major country-wise markets in Asia-Pacific, accounting for shares of 99.2% and 0.2%, respectively, in the Azotobacter market. China has the highest nitrogen (N) fertilizer consumption rate in the world. While N fertilizer use has greatly aided China's food production, it has also resulted in unprecedented changes in biogeochemical cycles and endangered terrestrial and aquatic ecosystems. Fertilizer policy reforms in China can help reduce N fertilizer use and the resultant N pollution. Azotobacter biofertilizers also have the potential to reduce the use of synthetic N-based fertilizers.
- In India, under the National Mission on Oilseeds and Oil Palm (NMOOP), financial assistance, including a 50% subsidy to the tune of INR 300/ha, is being given for different components like biofertilizers, supply Rhizobium culture/Phosphate solubilizing bacteria/Zinc solubilizing bacteria/Azatobacter/Mycorrhiza, and vermicompost. These factors are expected to boost the market for Azotobacter biofertilizers between 2023 and 2029.
- North America is the second-largest regional segment of the global Azotobacter market. The United States and Canada dominate the North American market due to their efforts to achieve organic farming.
Global Azotobacter Market Trends
Organic production is at an all-time high in North America and Europe, due to the increasing awareness and Government initiatives.
- Organic agriculture has emerged as a significant contributor to sustainable food systems, with 187 countries practicing it globally. As of 2021, there was 72.3 million ha of organic agricultural land worldwide, with an average increase of 2.9% across all regions from 2018 to 2021. Organic arable land accounted for 14.4 million ha, representing 19.9% of the total organic agricultural land.
- The strongest markets for organic farming are North America and Europe, accounting for 41.0% of the global organic arable land. In 2022, Europe had 6.5 million ha of organic arable land, equivalent to 44.1% of the overall organic arable agricultural area. The most significant crops grown organically in North America and Europe are apples, strawberries, cereals, and olives.
- Developing countries in Asia-Pacific are also joining the organic agriculture movement and becoming self-sufficient in producing and providing fresh organic produce to meet their domestic demand. The trend of organic farming is gaining momentum in Asia-Pacific, with the region recording an 18.8% increase in organic arable land from 2017 to 2022. The major initiatives by governments in the region also play a vital role in the growing trend of organic farming. For example, Japan's Basic Plan for Food, Agriculture, and Rural Areas aims to triple the number of organic farmers and lands by 2030.
- The growth of organic agriculture is driven by the rising awareness of the benefits of organic farming, such as promoting soil health, reducing environmental impacts, and producing healthier food.
Per capita spending of organic food majorly observed in United States and Germany, attributed to the consumer demand for healthier and sustainable food
- The organic food market experienced significant growth in the past few years, with global sales reaching USD 120.6 billion in 2020, up from USD 70.8 billion in 2012. The trend toward organic food is being driven by several factors, such as increasing consumer demand for healthier, more sustainable food options and a growing awareness of the environmental impact of conventional agriculture. The global organic food market is expected to continue its growth trend over the coming years.
- According to a survey conducted by the Organic Trade Association in 2021, sales of organic fruits and vegetables increased by around 4.5% in the same year, accounting for 15% of the overall organic sales. North America dominates the market in terms of average spending on organic products, with per capita spending in the United States reaching USD 186.7 in 2021, the highest among all North American countries. Europe is also expected to experience significant growth in the organic food market, with Germany accounting for the highest per capita spending of USD 75.6 in 2021.
- While the organic food market is still dominated by developed countries with high consumer disposable incomes, it is also expected to grow in developing nations. For example, the increasing number of working-class people in the Asia-Pacific region may contribute to the market's expansion due to the growing availability and affordability of organic food products.
Azotobacter Industry Overview
The Azotobacter Market is fragmented, with the top five companies occupying 14.24%. The major players in this market are Green Vision Life Sciences, Gujarat State Fertilizers & Chemicals Ltd, Indian Farmers Fertiliser Cooperative Limited, National Fertilizers Limited and T.Stanes and Company Limited (sorted alphabetically).
Additional Benefits:
- The market estimate (ME) sheet in Excel format
- 3 months of analyst support
TABLE OF CONTENTS
1 EXECUTIVE SUMMARY & KEY FINDINGS
2 REPORT OFFERS
3 INTRODUCTION
- 3.1 Study Assumptions & Market Definition
- 3.2 Scope of the Study
- 3.3 Research Methodology
4 KEY INDUSTRY TRENDS
- 4.1 Area Under Organic Cultivation
- 4.2 Per Capita Spending On Organic Products
- 4.3 Regulatory Framework
- 4.3.1 Argentina
- 4.3.2 Australia
- 4.3.3 Brazil
- 4.3.4 Canada
- 4.3.5 China
- 4.3.6 Egypt
- 4.3.7 France
- 4.3.8 Germany
- 4.3.9 India
- 4.3.10 Indonesia
- 4.3.11 Italy
- 4.3.12 Japan
- 4.3.13 Mexico
- 4.3.14 Netherlands
- 4.3.15 Nigeria
- 4.3.16 Philippines
- 4.3.17 Russia
- 4.3.18 South Africa
- 4.3.19 Spain
- 4.3.20 Thailand
- 4.3.21 Turkey
- 4.3.22 United Kingdom
- 4.3.23 United States
- 4.3.24 Vietnam
- 4.4 Value Chain & Distribution Channel Analysis
5 MARKET SEGMENTATION (includes market size in Value in USD and Volume, Forecasts up to 2030 and analysis of growth prospects)
- 5.1 Crop Type
- 5.1.1 Cash Crops
- 5.1.2 Horticultural Crops
- 5.1.3 Row Crops
- 5.2 Region
- 5.2.1 Africa
- 5.2.1.1 By Country
- 5.2.1.1.1 Egypt
- 5.2.1.1.2 Nigeria
- 5.2.1.1.3 South Africa
- 5.2.1.1.4 Rest of Africa
- 5.2.2 Asia-Pacific
- 5.2.2.1 By Country
- 5.2.2.1.1 Australia
- 5.2.2.1.2 China
- 5.2.2.1.3 India
- 5.2.2.1.4 Indonesia
- 5.2.2.1.5 Japan
- 5.2.2.1.6 Philippines
- 5.2.2.1.7 Thailand
- 5.2.2.1.8 Vietnam
- 5.2.2.1.9 Rest of Asia-Pacific
- 5.2.3 Europe
- 5.2.3.1 By Country
- 5.2.3.1.1 France
- 5.2.3.1.2 Germany
- 5.2.3.1.3 Italy
- 5.2.3.1.4 Netherlands
- 5.2.3.1.5 Russia
- 5.2.3.1.6 Spain
- 5.2.3.1.7 Turkey
- 5.2.3.1.8 United Kingdom
- 5.2.3.1.9 Rest of Europe
- 5.2.4 Middle East
- 5.2.4.1 By Country
- 5.2.4.1.1 Iran
- 5.2.4.1.2 Saudi Arabia
- 5.2.4.1.3 Rest of Middle East
- 5.2.5 North America
- 5.2.5.1 By Country
- 5.2.5.1.1 Canada
- 5.2.5.1.2 Mexico
- 5.2.5.1.3 United States
- 5.2.5.1.4 Rest of North America
- 5.2.6 South America
- 5.2.6.1 By Country
- 5.2.6.1.1 Argentina
- 5.2.6.1.2 Brazil
- 5.2.6.1.3 Rest of South America
- 5.2.1 Africa
6 COMPETITIVE LANDSCAPE
- 6.1 Key Strategic Moves
- 6.2 Market Share Analysis
- 6.3 Company Landscape
- 6.4 Company Profiles (includes Global Level Overview, Market Level Overview, Core Business Segments, Financials, Headcount, Key Information, Market Rank, Market Share, Products and Services, and Analysis of Recent Developments).
- 6.4.1 Ezzy Bioscience Pvt. Ltd
- 6.4.2 Green Vision Life Sciences
- 6.4.3 Gujarat State Fertilizers & Chemicals Ltd
- 6.4.4 Indian Farmers Fertiliser Cooperative Limited
- 6.4.5 Indogulf BioAg LLC (Biotech Division of Indogulf Company)
- 6.4.6 IPL Biologicals Limited
- 6.4.7 Jaipur Bio Fertilizers
- 6.4.8 National Fertilizers Limited
- 6.4.9 Samriddhi Crops India Pvt. Ltd
- 6.4.10 T.Stanes and Company Limited
7 KEY STRATEGIC QUESTIONS FOR AGRICULTURAL BIOLOGICALS CEOS
8 APPENDIX
- 8.1 Global Overview
- 8.1.1 Overview
- 8.1.2 Porter's Five Forces Framework
- 8.1.3 Global Value Chain Analysis
- 8.1.4 Market Dynamics (DROs)
- 8.2 Sources & References
- 8.3 List of Tables & Figures
- 8.4 Primary Insights
- 8.5 Data Pack
- 8.6 Glossary of Terms
- 発行日
- 発行
- Mordor Intelligence
- ページ情報
- 英文 277 Pages
- 納期
- 2~3営業日


